I. Design Background
Non-Intrusive Load Monitoring (NILM) is a technology that identifies and classifies different electrical appliances by analyzing electrical load data without requiring physical installation or modification. NILM monitors the total power consumption of a building or facility by installing sensors at the power system's bus or main meter, and then uses algorithms to break down this total power consumption into the consumption of individual appliances. By understanding the power consumption of each appliance, NILM helps users identify high-energy-consuming devices and optimize their electricity usage habits, thereby achieving energy conservation and emission reduction. Furthermore, it can provide detailed load data to power grid companies, helping to optimize grid operation. By monitoring the power consumption patterns of appliances, NILM can detect abnormal behavior of equipment early, prevent potential failures, and extend equipment lifespan. The data collected by NILM can be used for market analysis, helping appliance manufacturers understand user habits and improve product design.
To achieve NILM, sensors capable of detecting and recording three-phase power in a non-invasive manner are needed. To achieve customized functionality and cost savings, we designed our own three-phase power sensor. When using this sensor, only the three-phase voltage acquisition port needs to be connected in parallel to both ends of the incoming power supply to collect voltage, and an external current transformer is used on the incoming power line to collect current. No wiring modifications or connection to the indoor circuit are required to collect and record electrical energy data, which is then uploaded to a computer via host computer software. Afterwards, the recorded data can be processed and analyzed using a non-intrusive load detection algorithm.
II. Scheme Description
This section is divided into four parts: overall system scheme, hardware design, firmware design, and software design.
2.1 Overall System Scheme
The overall scheme of this design is shown in Figure 2-1. The sensor device is responsible for collecting the three-phase current and three-phase voltage of the circuit under test. After quantification and calculation of the internal current, the instantaneous current and voltage sampling values of the three phases, as well as the three-phase active power, reactive power, and apparent power, are obtained. All data is transmitted to the computer via a wireless router through a WIFI interface and recorded by the host computer software on the computer. Simultaneously, the host computer software on the computer can send configuration parameters to the sensor via a USB interface. Once the sensor receives the configuration parameters and successfully establishes a Wi-Fi connection with the computer, the USB connection can be disconnected, and all subsequent data transmission will be via Wi-Fi. In other words, the USB is only used for setting connection parameters.
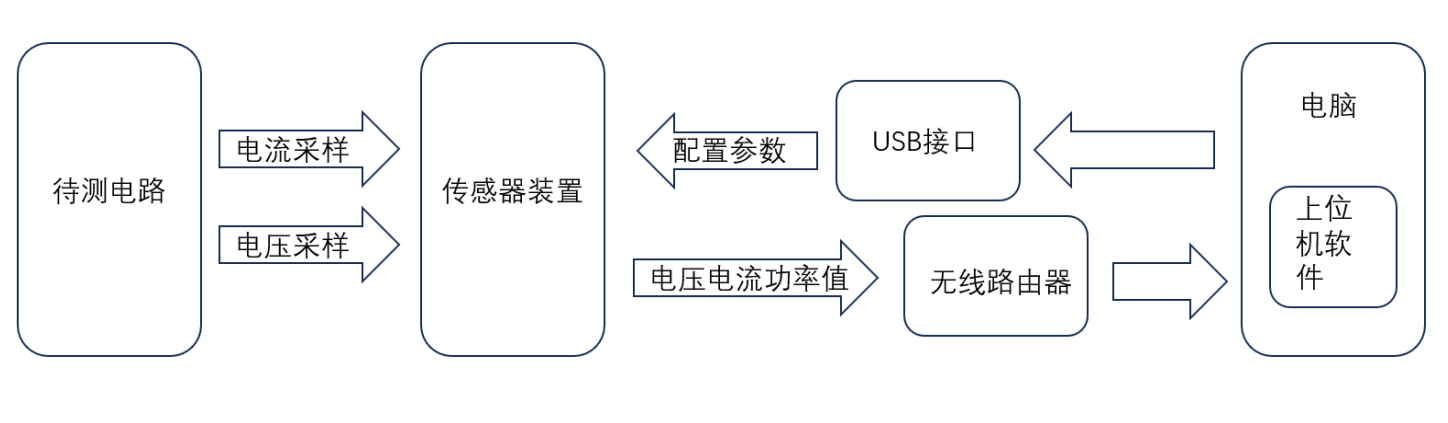
Figure 2-1 shows the overall system block diagram
. 2.2 Hardware Design
Figure 2-2 shows the overall system block diagram of the three-phase power sensor hardware design. Since sampling of the high-voltage AC circuit is required, the circuit is divided into a high-voltage circuit section and a low-voltage section, separated on the PCB by different ground planes. Communication between the two sections is achieved through a digital isolation chip, while the power supply for the three-phase current metering chip in the high-voltage section is provided by a DC-DC isolated power supply. The high-voltage section mainly includes current and voltage sampling circuits and a three-phase power metering chip. The low-voltage section mainly includes an ESP32 IoT chip and a USB-to-serial chip. The low-voltage section is powered by an LDO. The ESP32 IoT module has built-in Wi-Fi, so data can be transmitted directly via Wi-Fi without the need for an additional Wi-Fi chip.
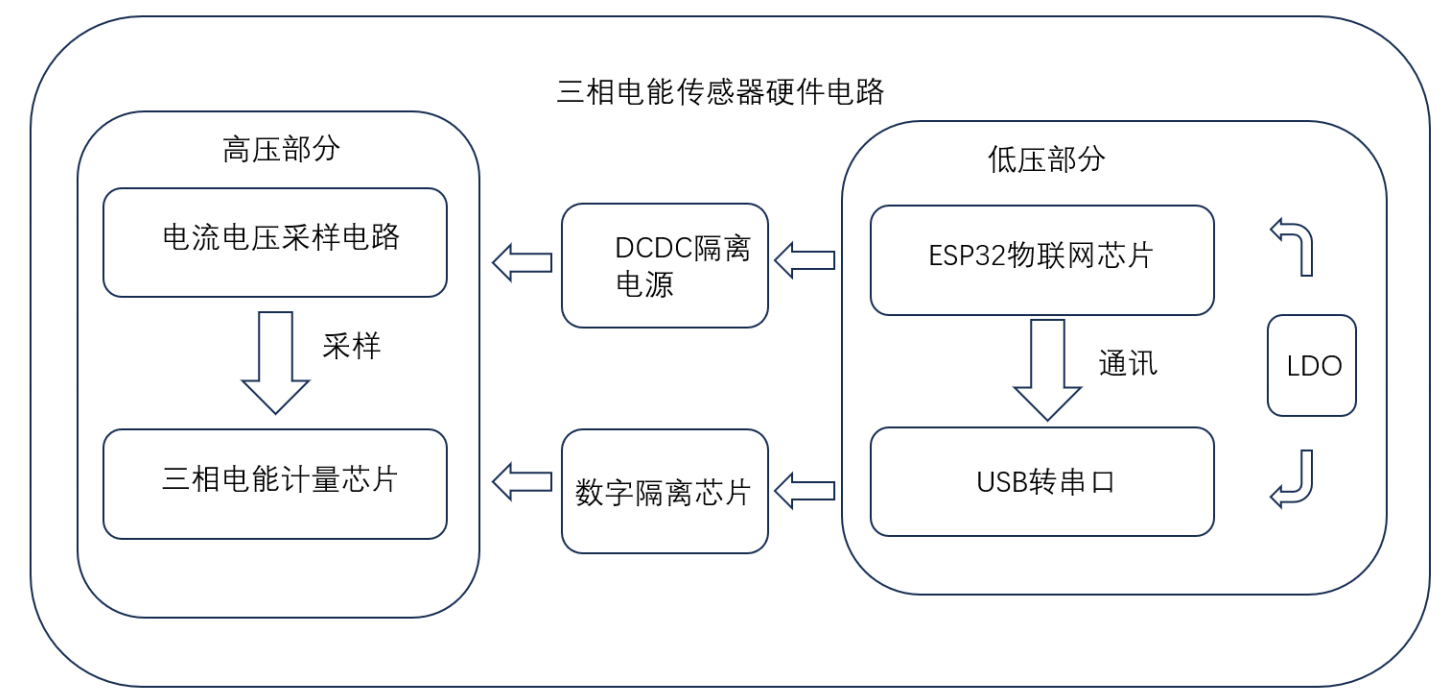
Figure 2-2 shows the hardware design block diagram.
Figure 2-3 shows the schematic diagram of the voltage and current sampling circuit of the system. The voltage sampling port first uses a ferrite bead to prevent voltage pulses, and then the voltage is divided by a resistor before entering the voltage sampling pin of the energy metering chip. The current sampling section also first uses a ferrite bead. Each current sampling channel has two ports for connecting the two ends of the current transformer. After passing through a 7.5-ohm resistor, one end of the resistor is grounded, and the other end is connected to the current sampling port of the energy metering chip. The principle is to measure the voltage across the 7.5-ohm sampling resistor and convert the sampling current into voltage sampling.

Figure 2-3 shows the current and voltage sampling circuit.
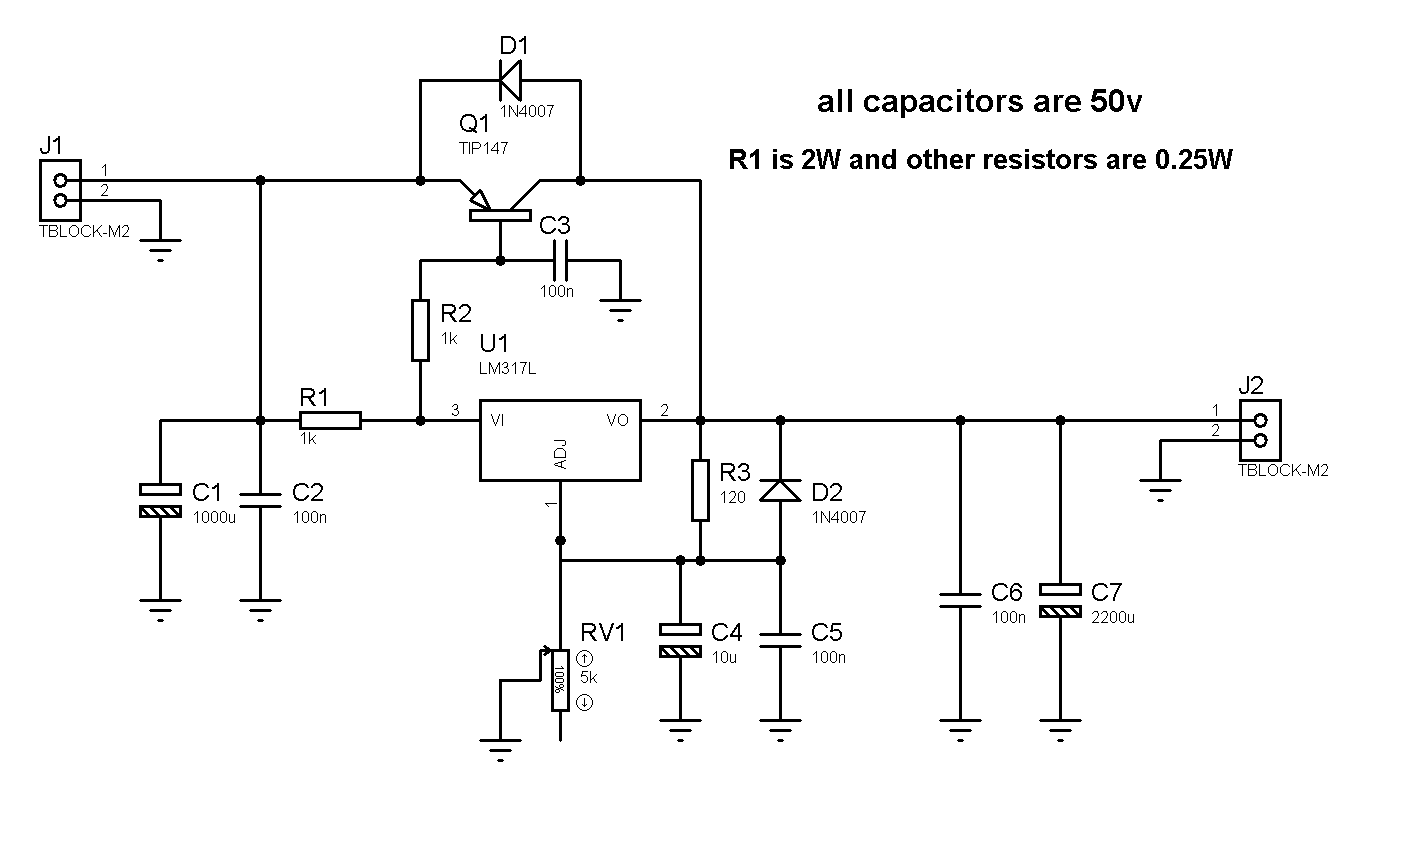
Figure 2-4 shows the system power supply section. The entire circuit board is powered by an external 5V supply, which is converted to 3.3V by an LDO to supply the ESP32 microcontroller and serial port. The three-phase energy metering chip is powered by a 3.3V supply through the B0503S DC-DC isolated power supply module.

Figure 2-4 shows the schematic diagram of the system power supply section.
Figure 2-5 shows the USB-to-serial circuit section, which is responsible for forwarding the serial port data of the ESP32 microcontroller to the computer via the USB interface for communication. Here, the USB-to-serial chip uses the CH340K chip, and two transistors and resistors are used to build the ESP32 automatic download circuit. The USB port uses a TYPE-C interface.
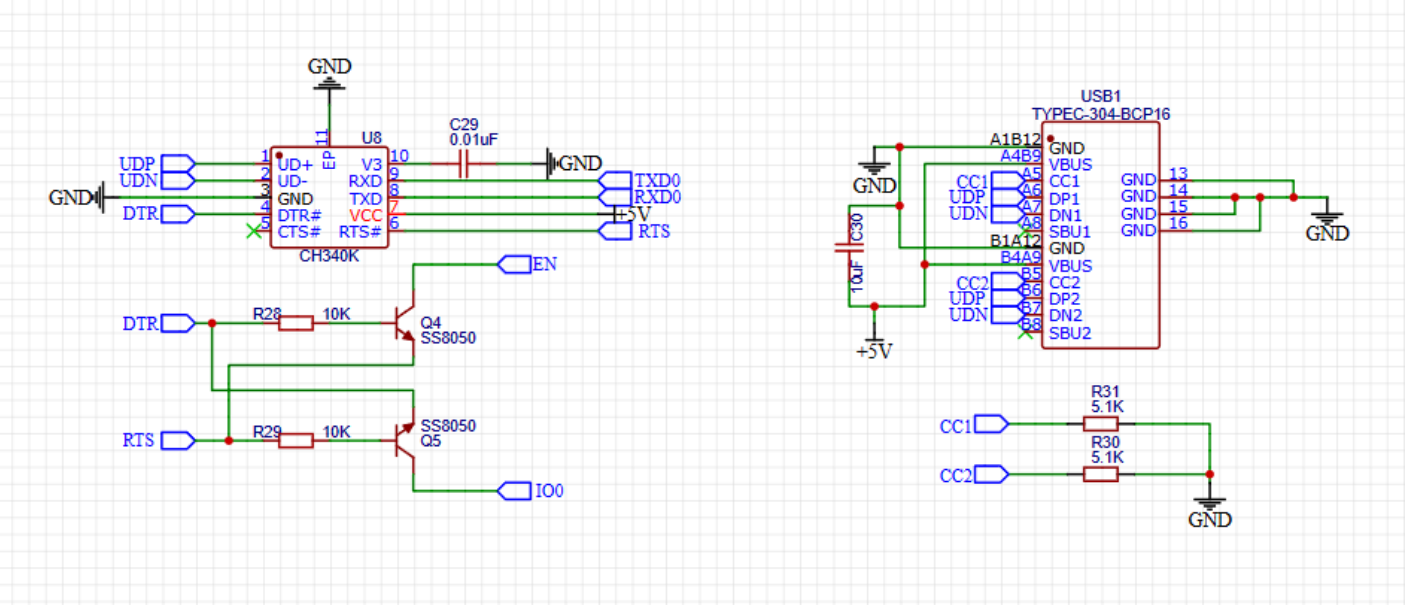
Figure 2-6 shows the schematic diagram of the USB-to-serial section
, which is the schematic diagram of the main control chip module ESP32 and its peripheral circuits, including a reset circuit, automatic download related circuits, RGB three-color LED indicators, I2C pull-up resistors, and an I2C isolation chip. Through the I2C isolation chip, the ESP32 main control chip can send commands to the three-phase power metering chip. The ESP32 chip has a built-in WIFI controller and Bluetooth controller. The built-in WIFI can transmit data at a maximum rate of 40Mbps, while the three-phase power metering chip needs to transmit 512K bytes per second in 8K sampling rate mode, thus meeting the data transmission requirements.
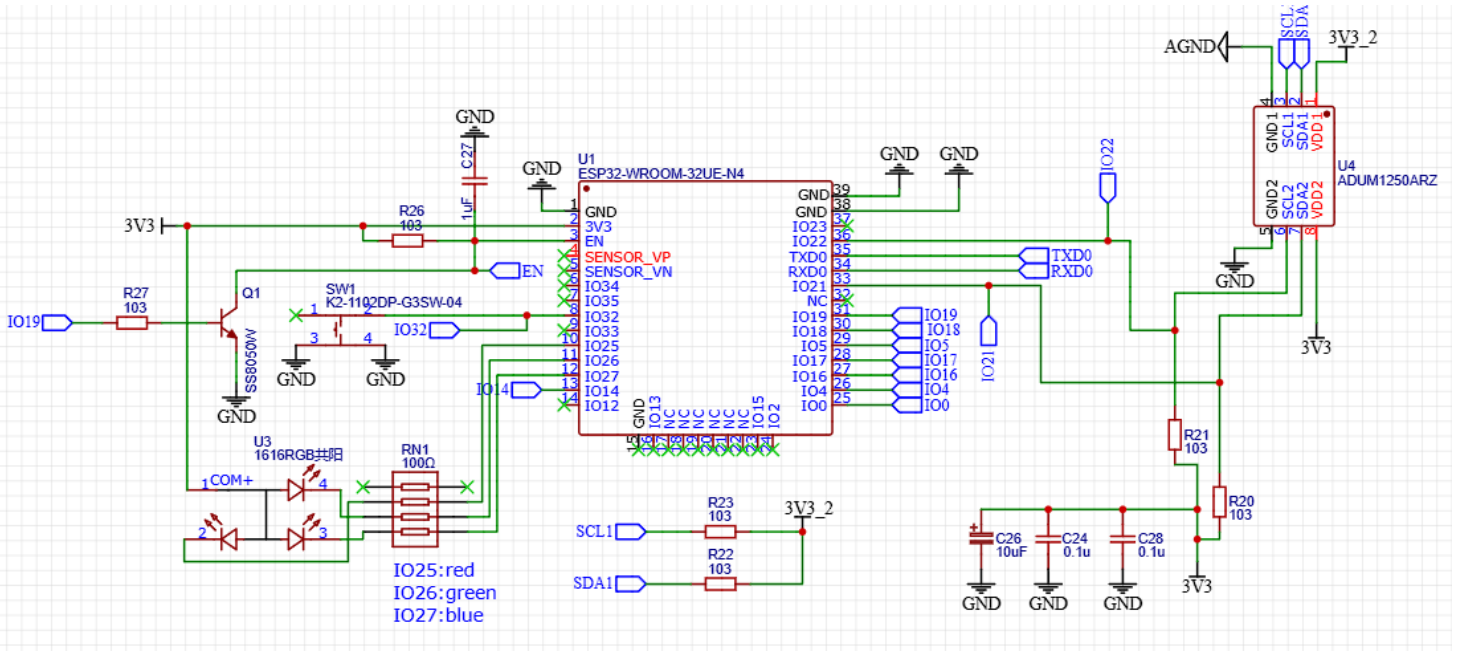
Figure 2-6 shows a partial schematic diagram of the ESP32 main control chip.
Figure 2-7 shows the three-phase energy metering chip and its peripheral circuits. This design uses the ADE7878 three-phase energy metering chip. The ADE7878 has a built-in DSP and ADC module, which, together with the peripheral circuits, can realize the acquisition and quantization of three-phase current and three-phase voltage, with a maximum sampling rate of 8kHz. The built-in DSP can calculate parameters such as apparent power, active power, reactive power, and phase angle internally. The ADE7878 has I2C and SPI interfaces. In this design, the main control chip transmits commands to the ADE7878 chip through the I2C interface. By using the SPI interface, with the ADE7878 as the master and the ESP32 as the slave, data can be transmitted to the main control chip at a rate of 8K points per second using the SPI-based HSDC interface, with each point being 64 bytes in size. The peripheral circuits shown in the figure include a filter circuit, an interface circuit, and a crystal oscillator circuit.
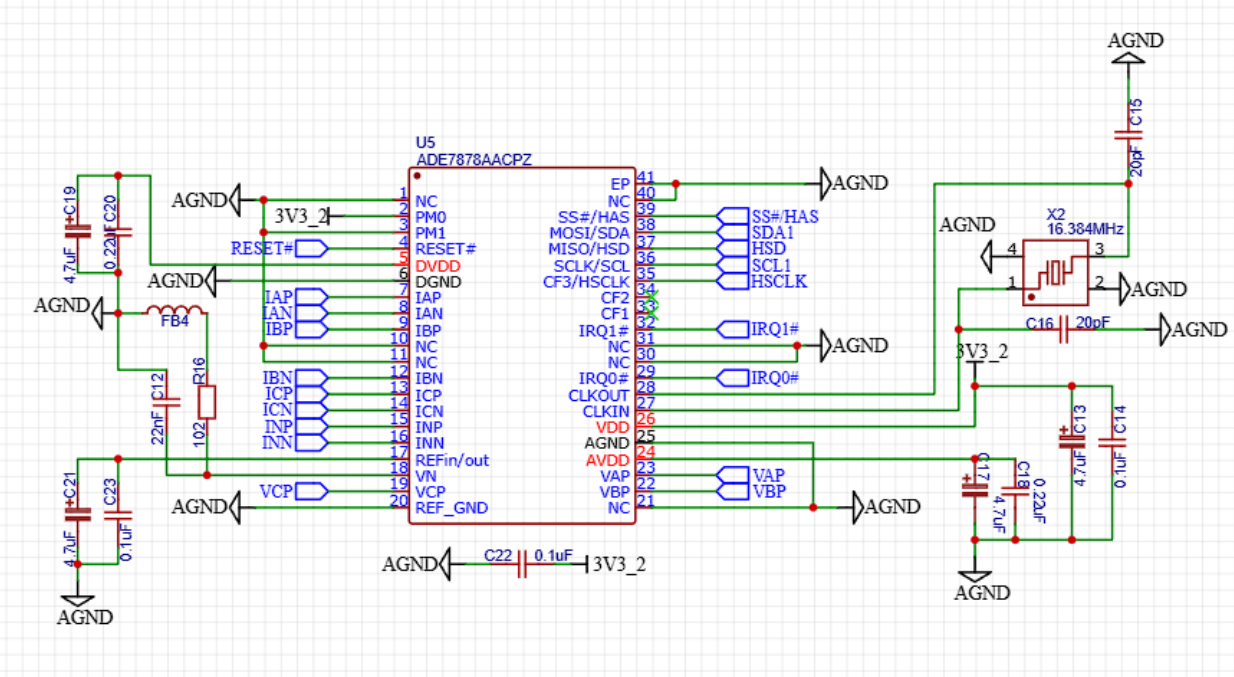
Figure 2-7 shows the schematic diagram of the three-phase power metering chip.
Figure 2-8 shows the digital isolator and related peripheral circuits. The ADUM161N is a 6-channel high-speed digital isolator chip with a maximum transmission rate of 150Mbps, used for isolated communication between the ESP32 and ADE7878 via the HSDC interface, which can fully meet the transmission requirements of the maximum communication rate of the HSDC interface.
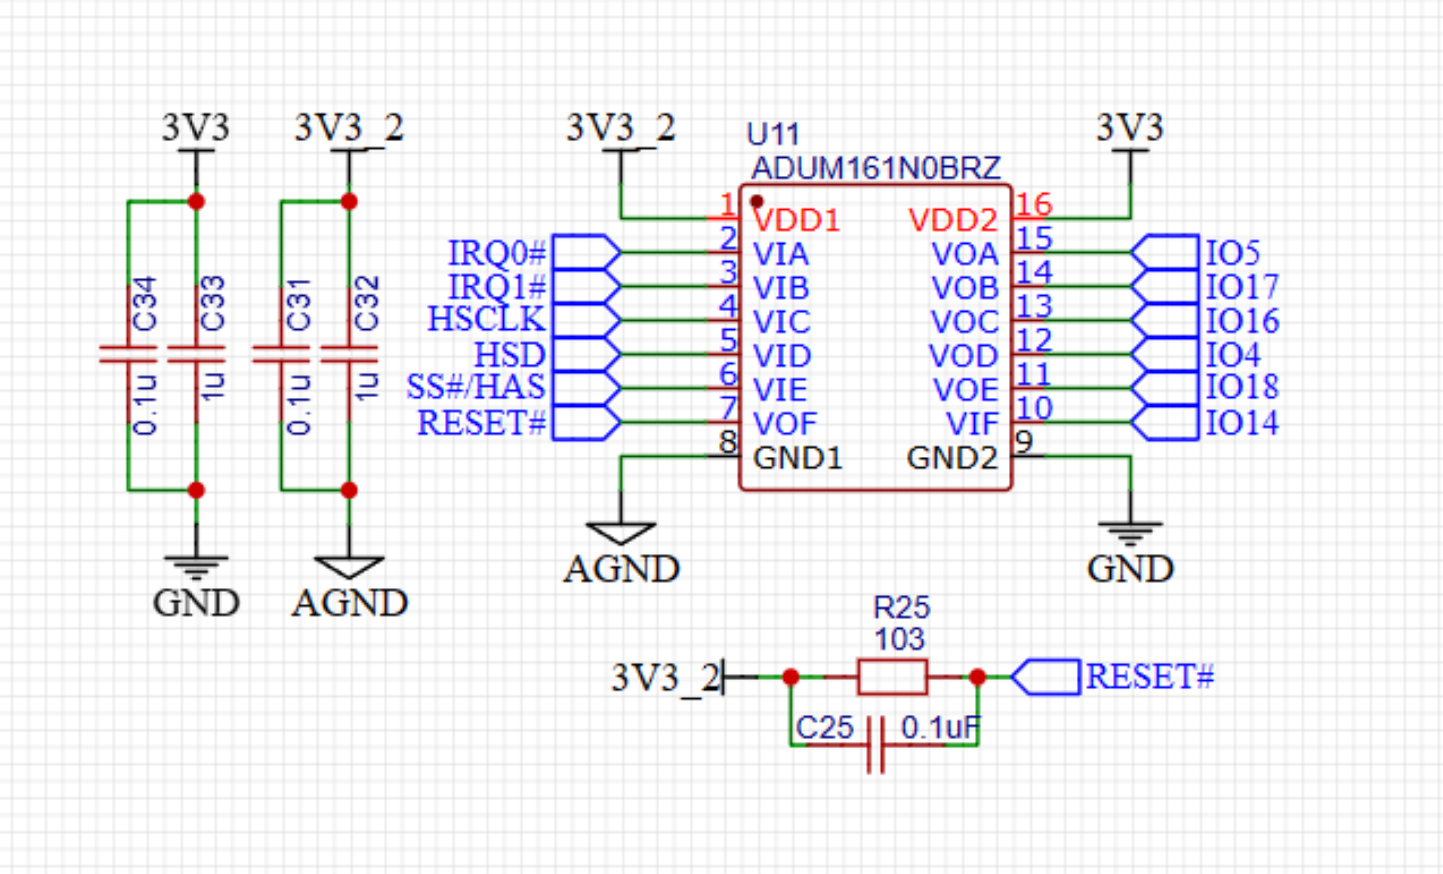
Figure 2-8 Schematic diagram of the digital isolator.
2.3 Firmware Design
Figure 2-9 shows the system block diagram of the sensor firmware. The ESP32 SDK is a firmware development framework provided by Espressif Systems, including FreeRTOS adaptation and related peripheral register operation functions. The firmware is mainly divided into the communication part with the host computer and the WIFI data upload part. The communication part with the host computer mainly includes receiving instructions sent by the host computer through the UART peripheral and parsing the instructions as parameters to set the parameters of the data upload part. The data upload part mainly consists of the code to establish a TCP client and the driver for the ADE7878. The ADE7878 driver is responsible for sending initialization commands and setting registers to the ADE7878. The TCP part is responsible for establishing the connection between the client and the host computer and sending the data read from the ADE7878 chip back to the host computer.

Figure 2-9 Sensor Firmware System Block Diagram
2.4 Software Design
As shown in Figure 2-10, the host computer software is developed based on QT and the Windows operating system SDK. The function of sending serial port commands to the sensor is implemented by calling the relevant Windows serial port APIs. The operations performed by the user on the interface are converted into serial port commands and sent to the sensor. The QT display interface includes three parts: parameter settings, real-time data display, and real-time data charts, all of which are developed based on QT. The data uploaded by the sensor is received through the TCP server established by the host computer software, parsed, and stored in a buffer. If the recording function is enabled, the data in the buffer will be written to the hard drive. The display of real-time data and charts is also done by reading the parsed data in the buffer.

Figure 2-10 Host Computer Software System Block Diagram
III. Results Display
3.1 Hardware Design Diagram and Physical Display:
Figure 3-1 shows an overview of the hardware schematic diagram. It can be seen that each circuit module is separated by black lines, and the same circuit module is drawn in the same area.
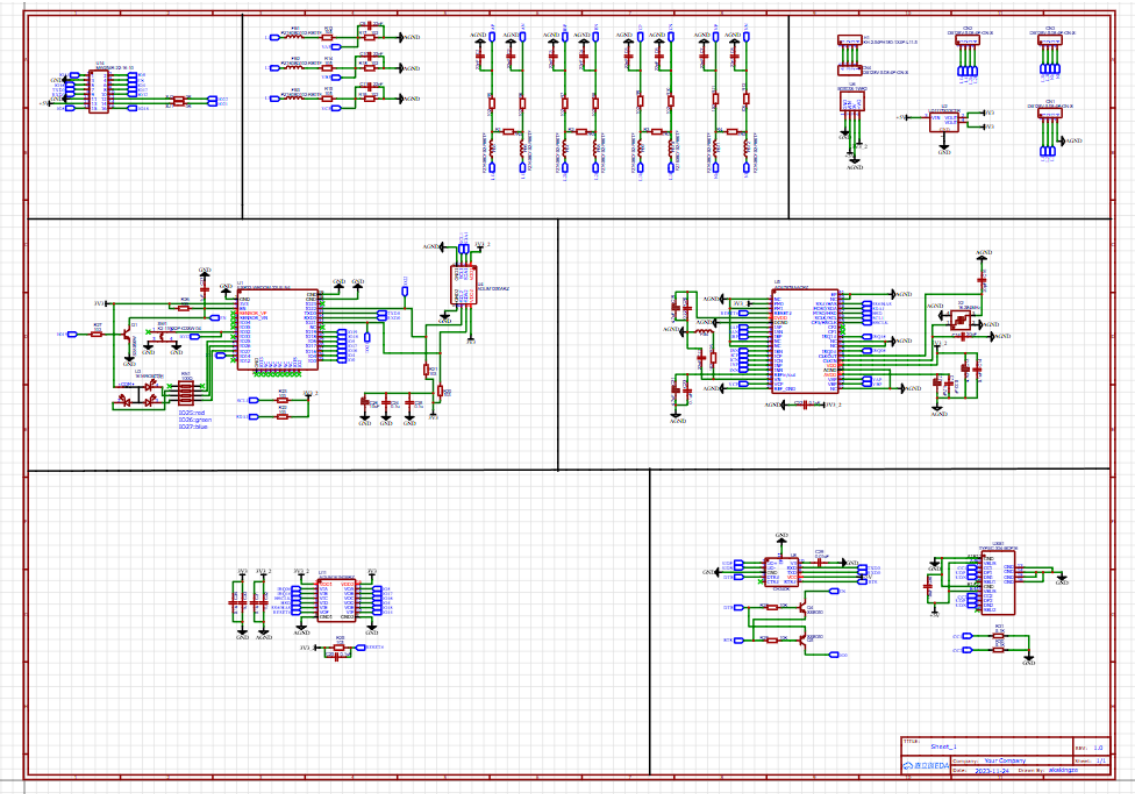
Figure 3-1 shows the schematic design.
Figure 3-2 shows an overview of the PCB design for the hardware section. It can be seen that the ground plane divides the high-voltage and low-voltage circuits into two parts, with the DC-DC isolated power supply and digital isolation chip separated by a dividing line. The power supply traces are thickened, and a grid copper pour is used on the PCB to reduce bending during reflow soldering.

Figure 3-2 shows the PCB design
. Figure 3-3 shows the actual PCB after prototyping and soldering.

Figure 3-3 shows the actual PCB .
3.2 Housing Design and Physical Display:
Figure 3-4 shows the sensor housing design model drawn using CAD software, and Figure 4-5 shows the actual device after the housing is installed on the circuit board.
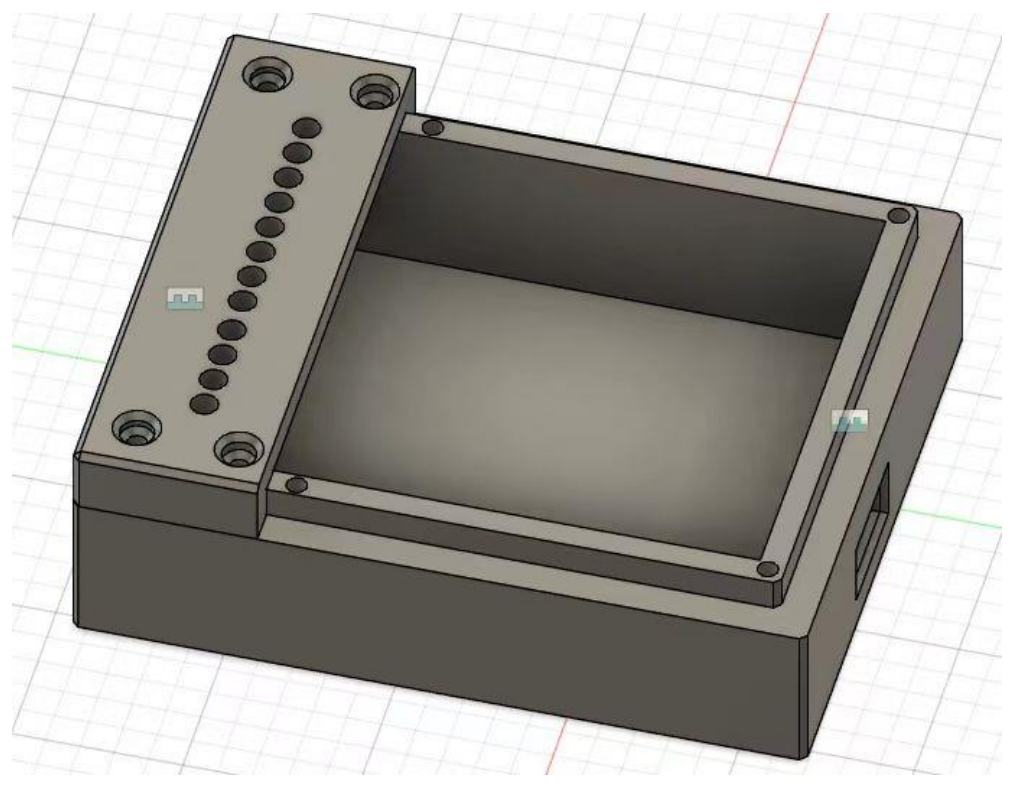
Figure 3-4 shows the housing design . Figure 3-5
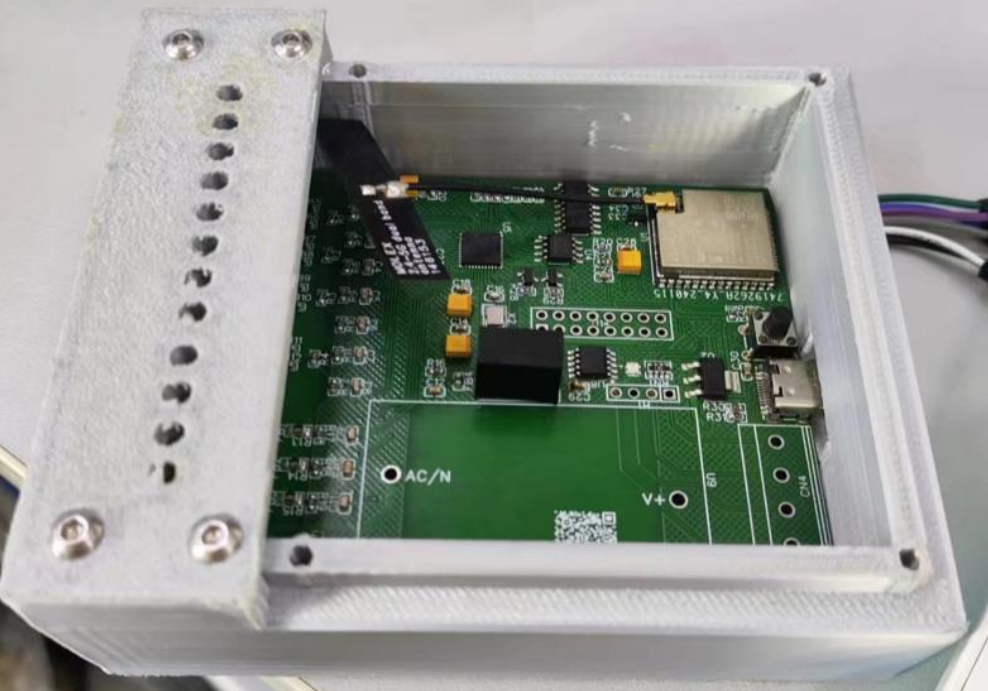
shows the installed device .
3.3 Host Computer Software Interface Design:
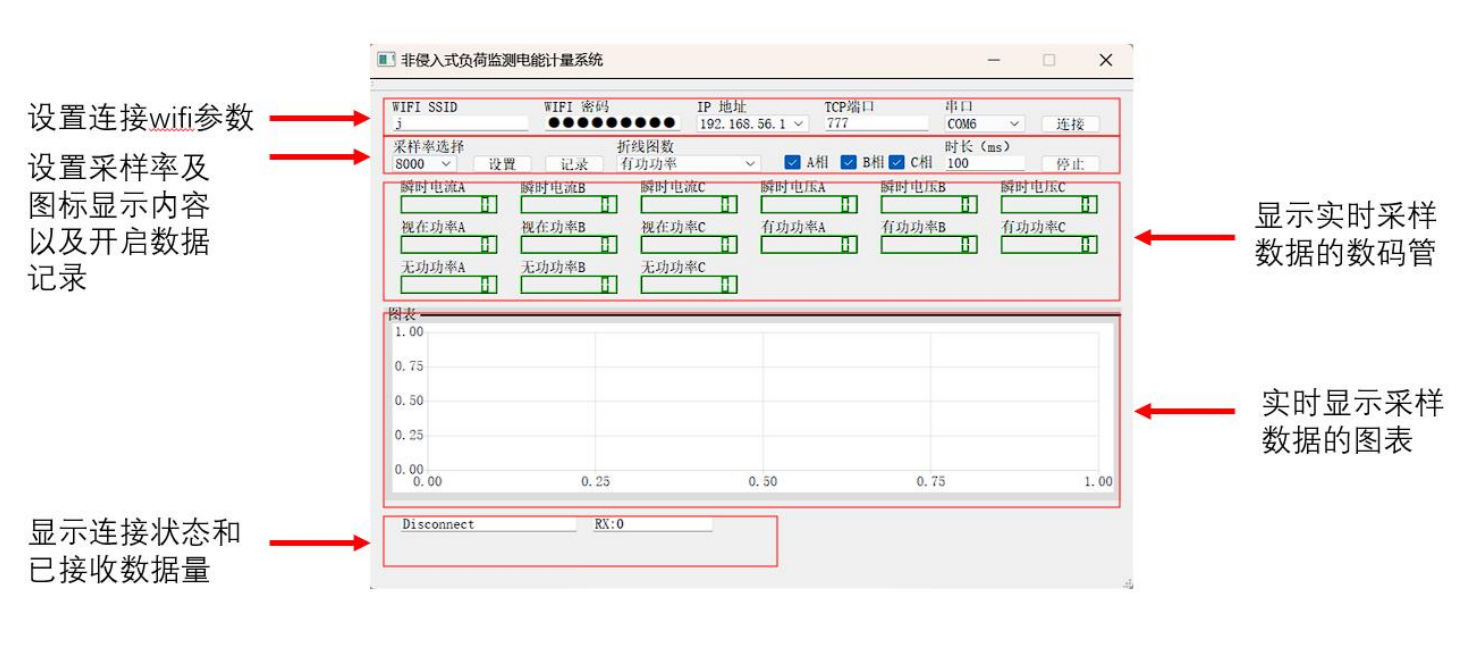
The interface layout and function design of the host computer software are shown in Figure 3-6, which is divided into four parts. The top section is used to set the Wi-Fi hotspot name and password, as well as the computer's IP address and the port to be used for establishing a TCP connection. After clicking connect, these parameters will be sent to the sensor via USB, and a TCP service will be created on the computer. The sensor will automatically connect to the Wi-Fi according to the set parameters and establish a TCP connection with the host computer software, transmitting the sampled data back to the host computer via the TCP connection. The second section is for setting functions such as the sampling rate. Clicking the record button will start recording the collected data to a CSV file. The checkboxes, line chart data selection, and display duration are used to set the data to be displayed in real time in the chart. The LCD display controls below are used to display the sampled data values in real time. The third section is the chart. The bottom fourth section displays the connection status and the amount of data received.
The firmware and host computer components are not currently open source. For commercial cooperation, please contact QQ: 903177586


 京公网安备 11010802033920号

 AD401M321VTB-5