I'm a second-year junior high school student, and my level is limited, so there may be omissions. Please forgive me.
Bilibili video link: [LCSC Geophysical] I've put a volcano into a voltage, current, and resistance meter
?!
_bilibili_ _Bilibili_
Project Functionality:
Measures voltage 0~30V,
current 0~3A, and
resistance 0~4MΩ (5 ranges, automatic switching).
It also includes calibration, simulation measurement, and standardization.
Improvements and innovations compared to the official example:
1. Resistance measurement and simulation
2. OLED screen display
3. Graphical calibration interface
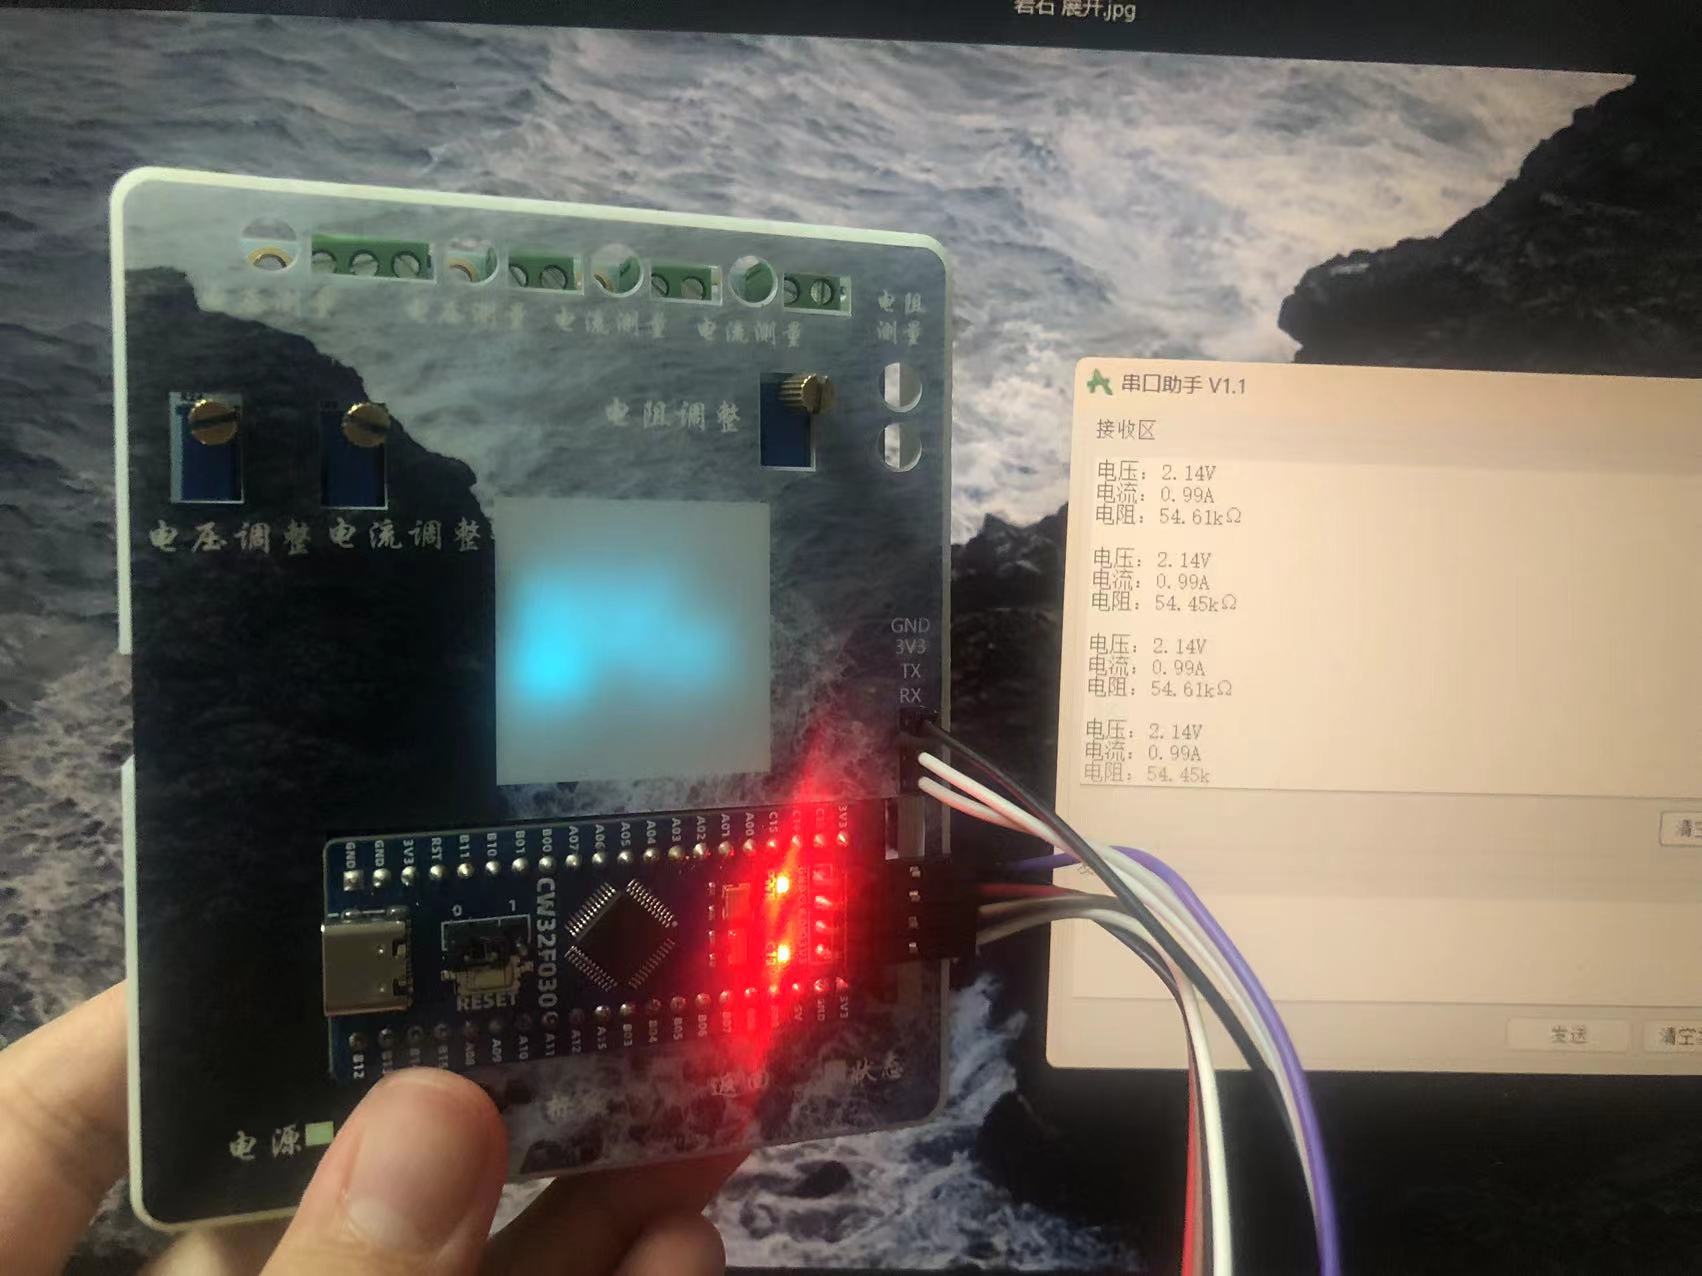
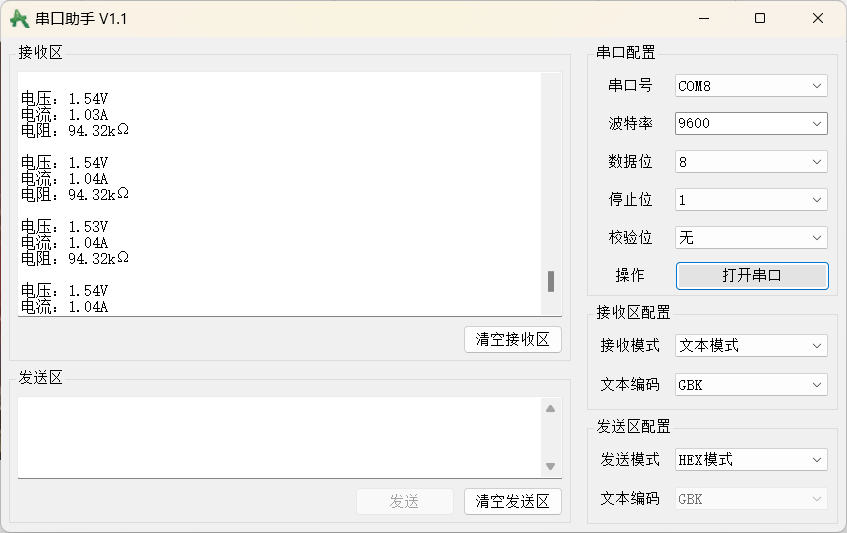
4. Serial port measurement data
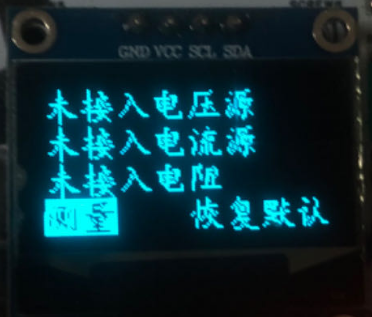
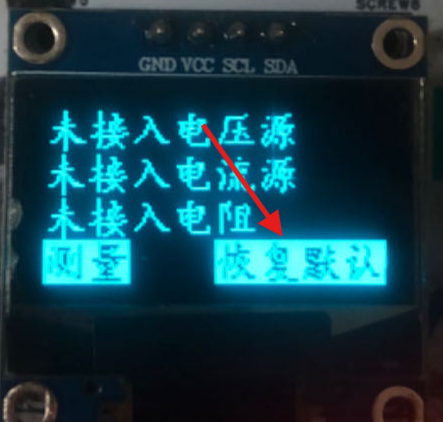
transmission 5. Detection of no connected measurement source
6. Restoration of calibration value to default
7. Automatic switching of resistance ranges
8. Resistance measurement calibration.
This document, except for some code explanations, is entirely original and not copied from the official project document. This project has undergone component standardization checks; surface mount resistors and capacitors
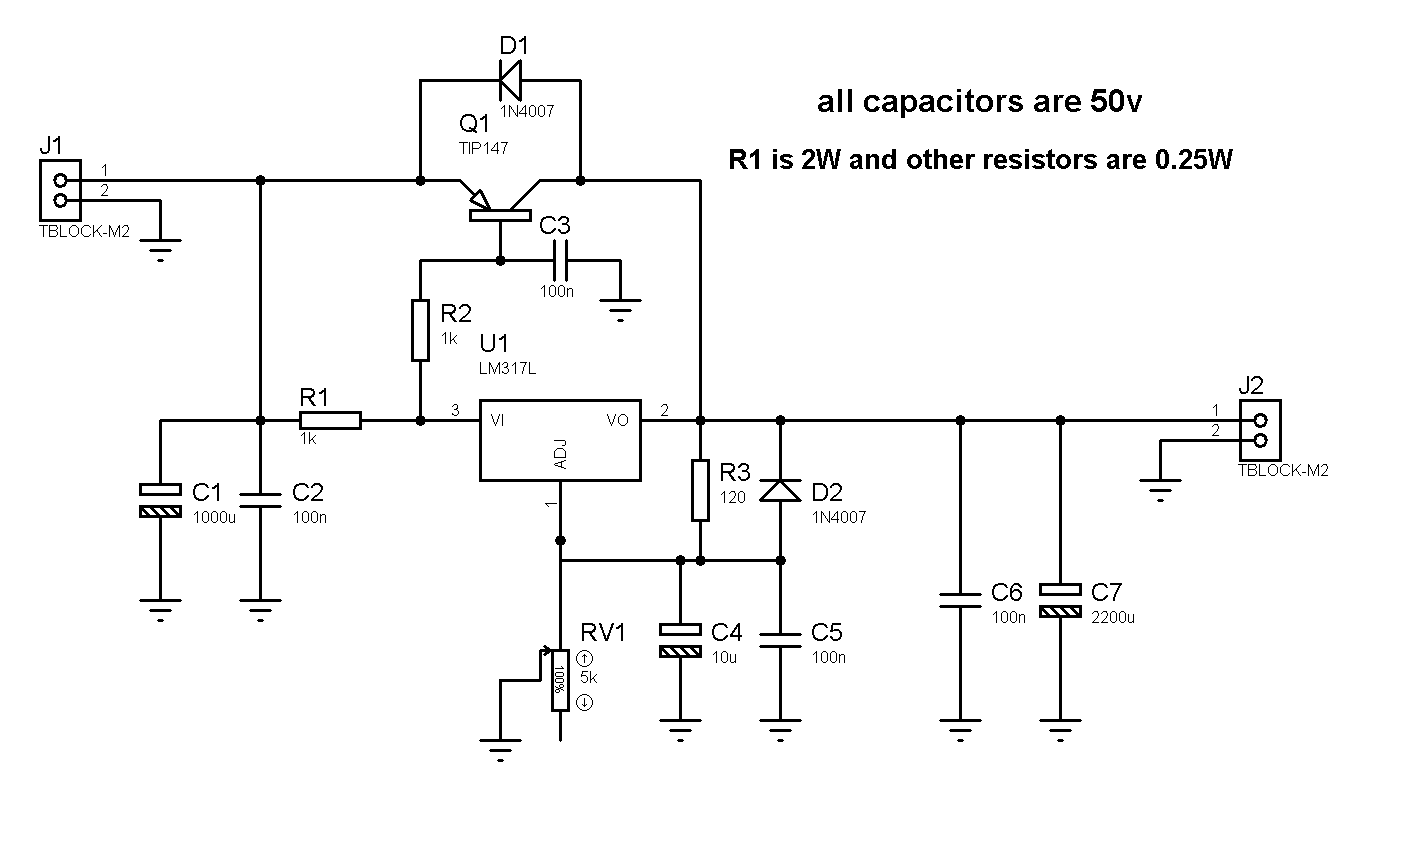
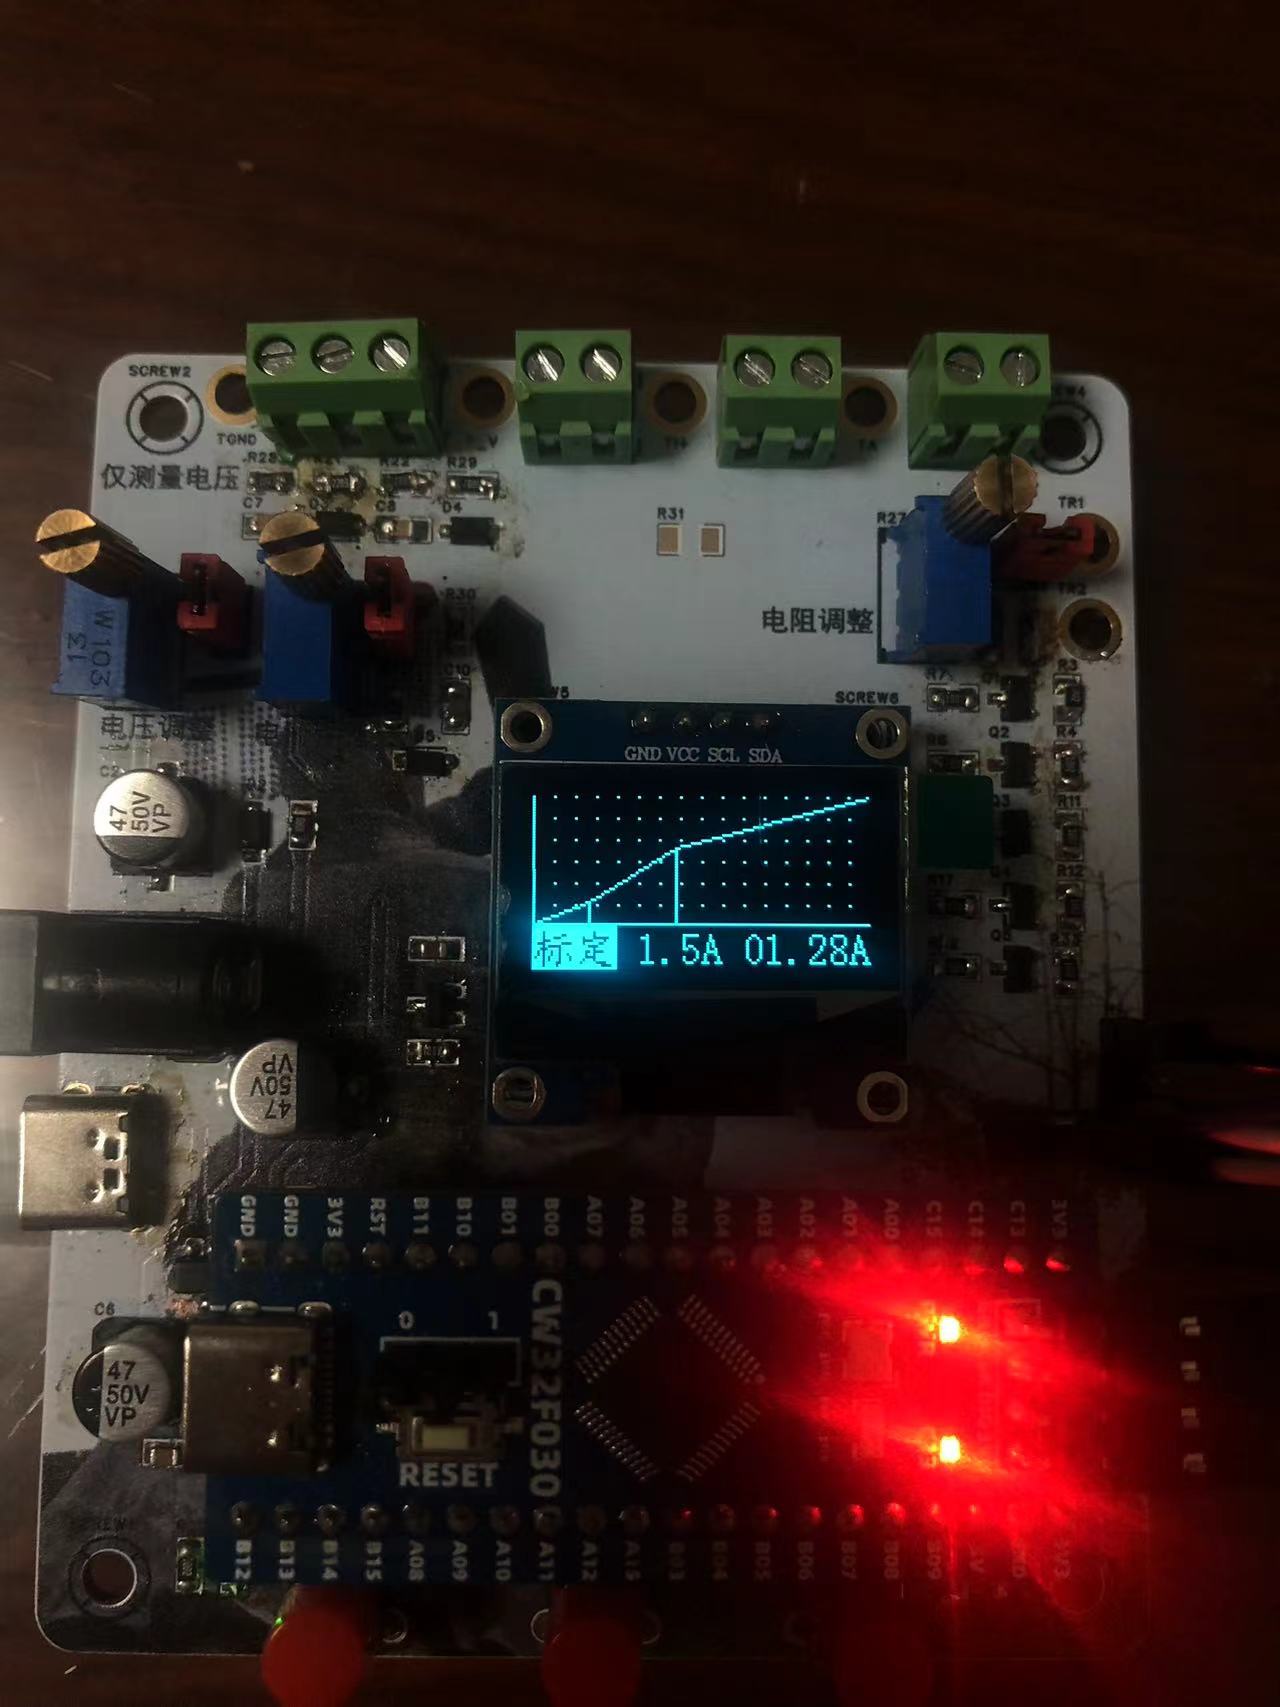
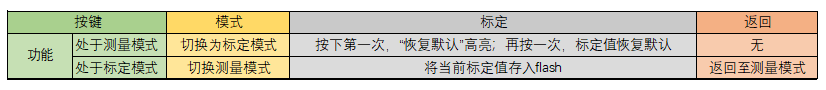
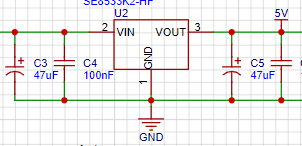
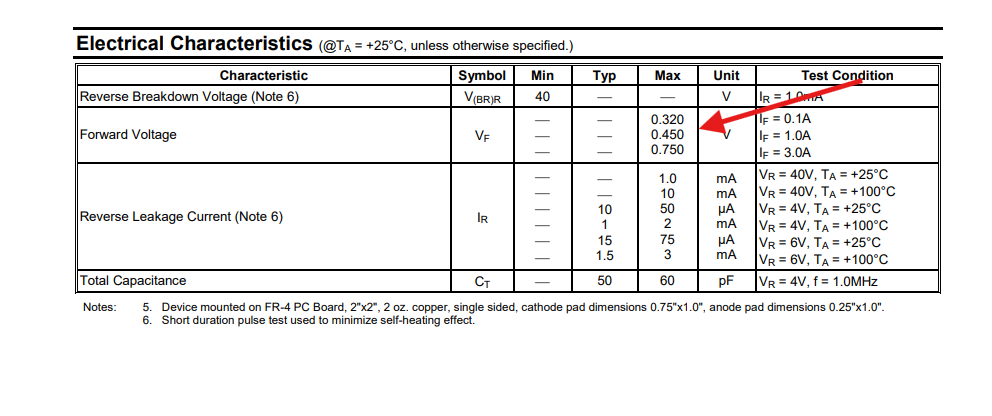
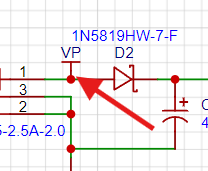
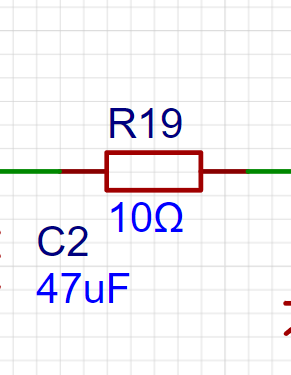
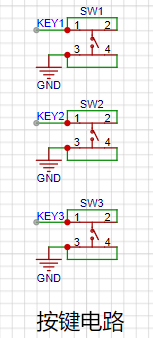
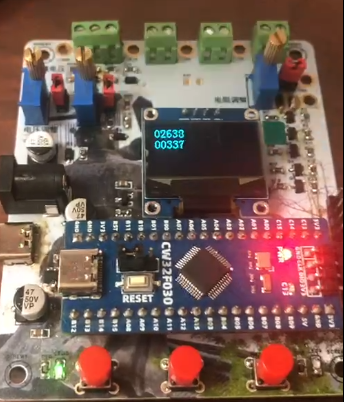
are available for direct order from LCSC Mall. All components use 0805 packages for easy soldering. Modification Record: 2024.8.25: Corrected errors in the resistance measurement schematic . Physical Demonstration: Button Function Table: 1. Schematic and Component Selection 1.1 1.1.1 LDO Selection The voltage measurement range for this project is set to 0~30V. Considering that using a separate power supply would be cumbersome, a high-input-voltage LDO is selected, which can provide power simultaneously with measurement. Datasheet: The SOT89 package offers better heat dissipation, and the PCB uses a filled area connection with vias to further enhance heat dissipation. 1.1.2 A 47uF electrolytic capacitor + 100nF capacitor is used for filtering at the input and output. The larger capacitor filters out low-frequency interference, and the smaller capacitor filters out high-frequency interference. Note: Current flows through the larger capacitor first, then the smaller capacitor. 1.1.3 A Schottky diode is used for reverse polarity protection , resulting in a lower voltage drop. Compared to the official example, following a suggestion from a group member, VP is moved before the diode to prevent reverse polarity of the measurement power supply and damage to the circuit . 1.1.4 A 10Ω resistor acts as a fuse and also performs voltage division, reducing LDO heat generation. 1.1.5 A 10K resistor limits the current of the LED indicator. *1.1.6 Single-point grounding : Due to limited layout capabilities, grounding is difficult to implement, so this project only implemented isolation during copper pouring and did not use single-point grounding. 1.2 Button Circuit : When a button is pressed, the GPIO port is pulled low. The button status can be obtained by reading the input. Three buttons are used to implement mode switching, calibration, and return functions. 1.3 LED Indicator: When the corresponding GPIO output is low, the LED lights up. 1.4 Measurement Circuit: The core of this project. 1.4.0 CW32ADC Main Characteristics 1.4.1 Voltage Sampling 1.4.1.1 Measurement Accuracy and Range Calculation Analysis (Using internal 1.5V as reference voltage) The voltage sampling is set to two ranges: 22:1 voltage divider and 1:1 voltage divider. The sampling resistor accuracy is 1/1000 . In design, this meter measures voltage from 0 to 30V, so the first range is 0 to 30V. The low-side resistance is typically 10K, and the high-side resistance is calculated as: 30V * 10K / (R + 10K) = 1.5V. To allow for margin, a 220K resistor from E24 is selected. The second range is set to 0 to 3V. The low-side resistance remains 10K, and the high-side resistance R is: 3V * 10K / (10K + R) = 1.5V. The high-side resistance is also 10K. The CW32's internal ADC is 12-bit, dividing the input voltage into 2^12 parts. At a 1.5V reference, each part is 1.5V/2^12 = 0.000366V. Therefore, the measurement accuracy of the first range is 0.000366V * 2^3 = 0.0084V, and the measurement accuracy of the second range is 0.000366V * 2 = 0.000732V. This demonstrates the significance of range switching, which improves measurement accuracy. When the measured voltage is below 3V, switching to the second range is necessary (in fact, the first range already has high accuracy, so it's not particularly significant). 1.4.1.2 Diodes and Capacitors : Diodes are forward clamped to prevent excessive voltage from damaging the microcontroller. Capacitors are used for filtering. 1.4.2 Current Sampling 1.4.2.1 Measurement Accuracy and Range Calculation Analysis (Using Internal 1.5V as Reference Voltage) In this project design, the measured current is 0~3A. The selection of the current sensing resistor value cannot be unlimited, neither too large nor too small. Considering various factors, the resistance value is set to 100mΩ (i.e., 0.1Ω). 3A * 100mΩ = 300mV, 900mW. Therefore, a 1W package resistor is selected . The voltage difference brought by the 3A current is 300mV, so the accuracy is 3 * 0.000366V / 300mV = 0.00366A. Because the designed current measurement range is not large, only one range of current measurement is designed. 1.4.2.2 The 1K resistor has a certain current limiting function, which can protect the ADC pins. Together with the capacitor, it forms an RC low-pass filter to filter out high-frequency noise. 1.4.2.3 Diode and Capacitor : The diode is forward clamped to prevent excessive voltage from damaging the microcontroller. The capacitor is used for filtering. *Note: When performing analog measurements, the 100mΩ current sensing resistor should not be soldered! 1.4.3 Resistance Measurement 1.4.3.1 Measurement Accuracy and Range Calculation and Analysis (using internal 1.5V as reference voltage)


Overall Measurement Approach: Utilizing a PMOS transistor with different range voltage divider resistors, resistance measurement is achieved through the principle of voltage divider.
Four resistance ranges are set, all with 1/1000 precision voltage divider resistors.
PMOS Principle: When the voltage difference between the gate (G) and source (S) is lower than the threshold voltage, the source (S) and drain (D) will conduct. In
simpler terms, a low-level PMOS transistor conducts.
Therefore, to connect a transistor to the circuit, the corresponding I/O port needs to output a low level.
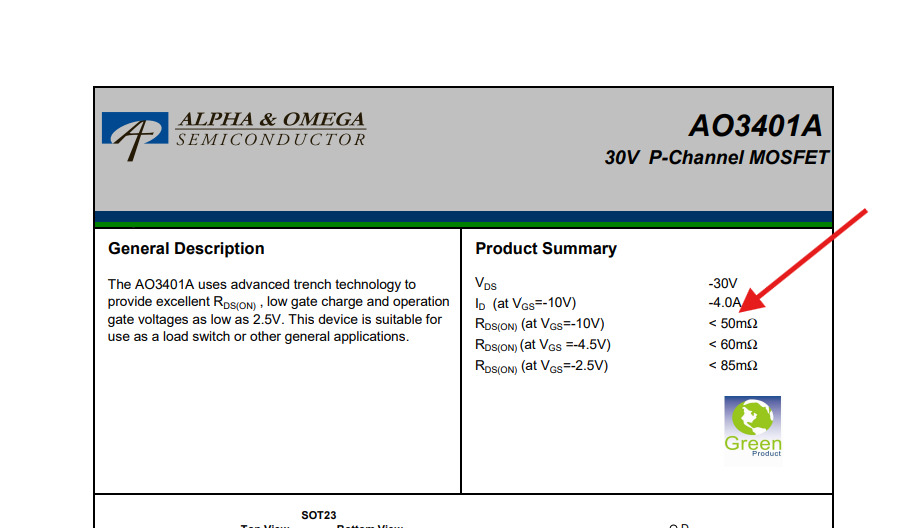
The resistance after this MOSFET conducts is very small compared to KΩ or MΩ and can be ignored.
The reasons for adding a 10K pull-up resistor to the gate are:
1. To prevent uncertain states: Before power-up, the gate of the MOSFET may be in a high-impedance state, making it susceptible to external interference and causing unstable gate voltage. By adding a pull-up resistor, a definite gate voltage level can be ensured upon power-up, avoiding the influence of uncertain states on the MOSFET.
2. To prevent mis-conduction: If the gate is interfered with during power-up, the MOSFET may conduct uncontrollably, potentially damaging other components in the circuit. Pull-up resistors ensure that the gate voltage remains within a safe range, preventing the MOSFET from being accidentally turned on.
3. The presence of parasitic capacitance: Parasitic capacitance exists between the gate and source of a MOSFET. When the circuit is powered off, this parasitic capacitance stores a certain amount of charge. If there is no discharge path, this charge may cause the MOSFET to be in an uncontrolled on-state upon the next power-on.
For the first range, the high-side resistance is 1KΩ, the maximum ADC input voltage is 1.5V, and
the maximum measured value is:
5V*R/(1K+R)=1.5V, R=428Ω.

The measurement accuracy is:
5V*△R/(1K+△R)=0.000366V, △R=0.073Ω.

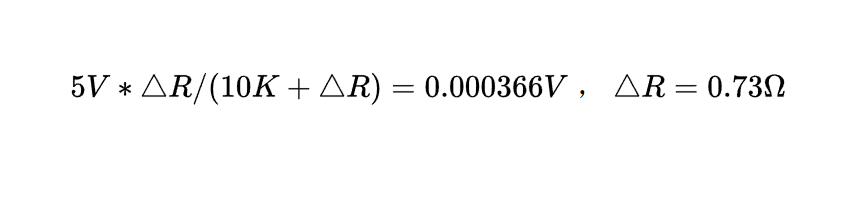
For the second range, the high-side resistance is 10KΩ, the maximum ADC input voltage is 1.5V, and the maximum measured value is:
5V*R/(10K+R)=1.5V, R=4.28KΩ.
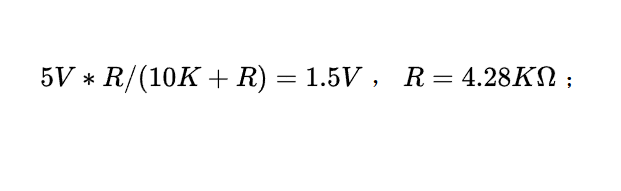
The measurement accuracy is:
5V*△R/(10K+△R)=0.000366V, △R=0.73Ω.
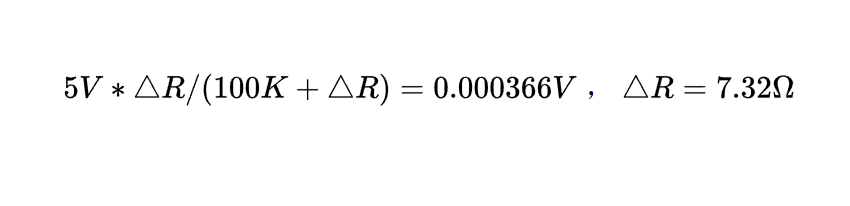
For the third range, the high-side resistance is 100KΩ, the maximum ADC input voltage is 1.5V, and
the maximum measured value is:
5V*R/(1K+R)=1.5V, R=42.85KΩ.

The measurement accuracy is:
5V*△R/(100K+△R)=0.000366V, △R=7.32Ω.
For the fourth range, the high-side resistance is 1MΩ, the maximum ADC input voltage is 1.5V, and
the maximum measured value is:
5V*R/(1K+R)=1.5V, R=428.57KΩ;

measurement accuracy:
5V*△R/(1M+△R)=0.000366V, △R=73.21Ω.

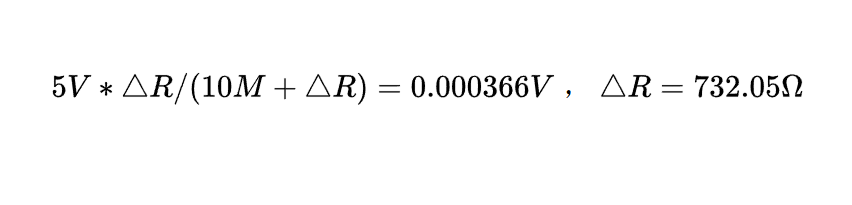
For the fifth range, the high-side resistance is 10MΩ, the maximum ADC input voltage is 1.5V, and
the maximum measured value is:
5V*R/(1K+R)=1.5V, R=4.28MΩ;

measurement accuracy:
5V*△R/(10M+△R)=0.000366V, △R=732.05Ω.
1.4.3.2 Diodes and Capacitors:
Diodes are forward clamped to prevent excessive voltage from damaging the microcontroller . Capacitors
are used for filtering
. 1.4.4 Voltage Analog Measurement and Interface Circuit


1.4.4.1 Voltage Analog Measurement
Considering the lack of an adjustable power supply and the inconvenience of building an experimental platform, an analog measurement circuit is added for experimentation and calibration. A multi-turn adjustable potentiometer is used for voltage division
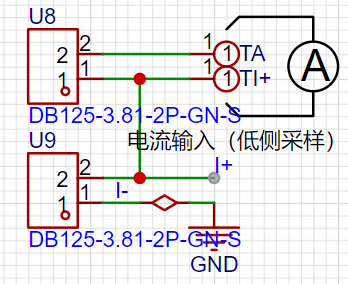
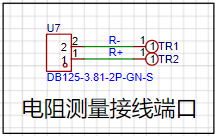
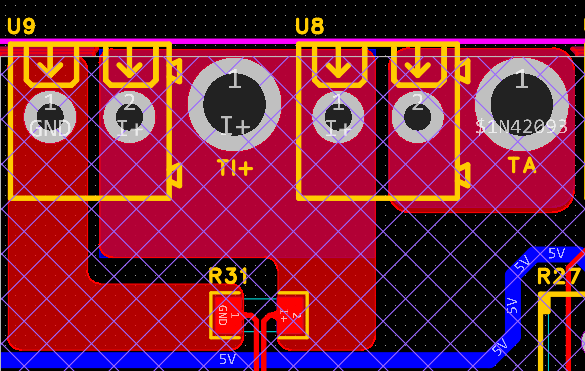
using jumper caps . This potentiometer has a long travel, suitable for analog measurement and calibration (these potentiometers are expensive; five cost over ten yuan). 1.4.4.2 Voltage Measurement Interface: TV and TGND are 2mm banana plugs used to connect multimeter probes. A multimeter can be used for calibration, or 2mm banana plug multimeter probes can be used for measurement. The VP pin is the power supply pin for the development board. When the DC port is not used for power supply, a 5V~30V power supply can be connected to simultaneously measure and supply power. 1.4.5 Current Simulation Measurement and Interface Circuit 1.4.5.1 Current Simulation Measurement Considering the lack of an adjustable power supply and the inconvenience of building an experimental platform, a set of simulation measurement circuits is added for experimentation and calibration . When using it, a jumper cap is used to short-circuit a multi-turn adjustable potentiometer. This potentiometer has a long travel, suitable for simulation measurement and calibration . After voltage division: 5V*10K/(10K+200K)=0.238V, it can simulate a voltage of 0~0.238V. This voltage is the voltage drop generated by the current sensing resistor, so it can simulate a current of 0.238V/100mΩ, i.e., 0~2.38A. 1.4.5.2 Current Measurement Interface TA and TI+ are 2mm banana plugs used to connect multimeter probes. A multimeter can be used for calibration, or a multimeter probe with a 2mm banana plug can be used for measurement. When not using an external ammeter for calibration, the current is connected to the U9 interface. When an external ammeter is needed for calibration, the current is connected to pin 1 of U8 and pin 2 of U9, with the banana plug connected in series with the ammeter. For analog measurements, the multimeter is connected to TI+ and TGND of the voltage interface to measure the corresponding voltage of the analog current. 1.4.6 Resistance Analog Measurement and Interface Circuit 1.4.6.1 Voltage Analog Measurement Considering the limited range of available resistors, and the fact that most of them are surface mount resistors, an analog measurement circuit is added for experimentation and calibration. A multi-turn adjustable potentiometer is used for voltage division using a jumper cap . This potentiometer has a long travel, suitable for analog measurements and calibration. A 100KΩ potentiometer with an analog range of 0~100KΩ is selected (these potentiometers are quite expensive; five cost over ten yuan). 1.4.6.2 Resistance Measurement Interface TR1 and TR2 are 2mm banana plugs used to connect multimeter probes. A multimeter can be used for calibration, or the 2mm banana plug multimeter probes can be used for measurement. A multimeter can be connected to a banana plug to measure a potentiometer, but this method is insufficient. When performing analog measurements, adding a multimeter is equivalent to connecting a resistor in parallel, leading to inaccurate measurements. Simultaneous measurements are not possible, and currently there is no solution; measurements must be performed separately.


1.4.7 Voltage Reference Circuit
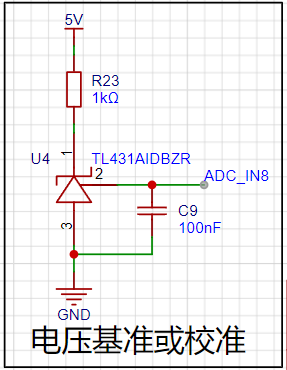
1.4.7.1 TL431 Principle
TL431 Internal Schematic:
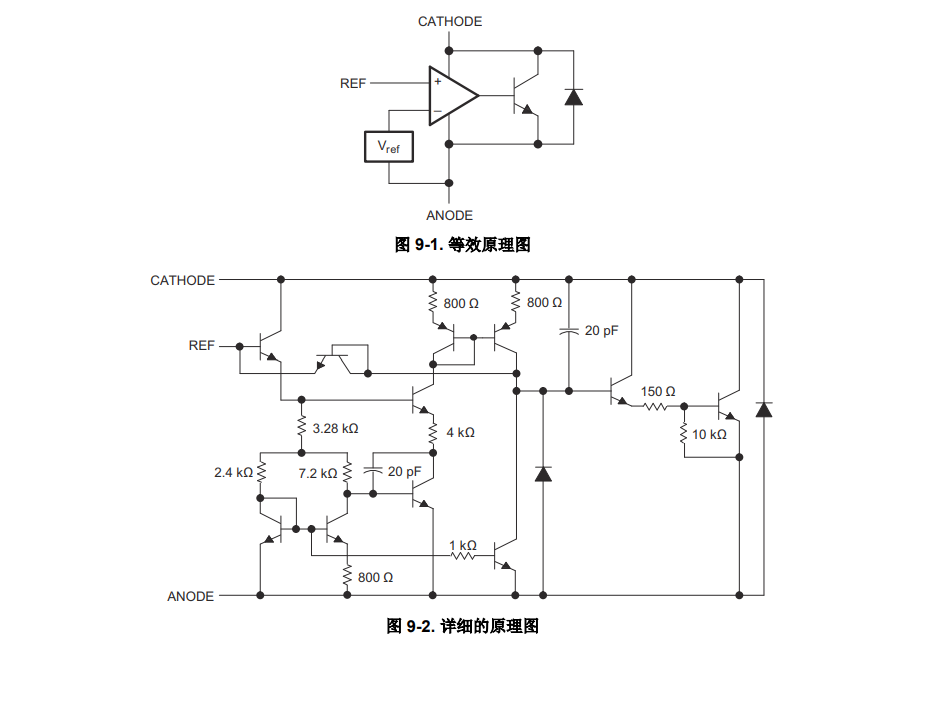
The TL431's internal voltage comparator compares the voltage at the reference terminal R with the internal Vref reference voltage.
Its core is an operational amplifier, which acts as the voltage comparator.
When the voltage at the non-inverting input is greater than that at the inverting input, the output is high; otherwise, it is low.
ANODE can be considered as GND.
When the voltage at REF is greater than 2.5V, the comparator outputs a high level, turning on the output switch and thus pulling down the cathode potential, reducing the output voltage.
When the voltage of REF is less than 2.5V, the comparator output is low, the output switch is cut off, and the REF level rises.
Therefore, REF is almost equal to Vref (i.e., 2.5V).
In addition, the TL431 also has an adjustable output function, which is not used in this project, so it will not be explained.
1.4.7.2 Resistors

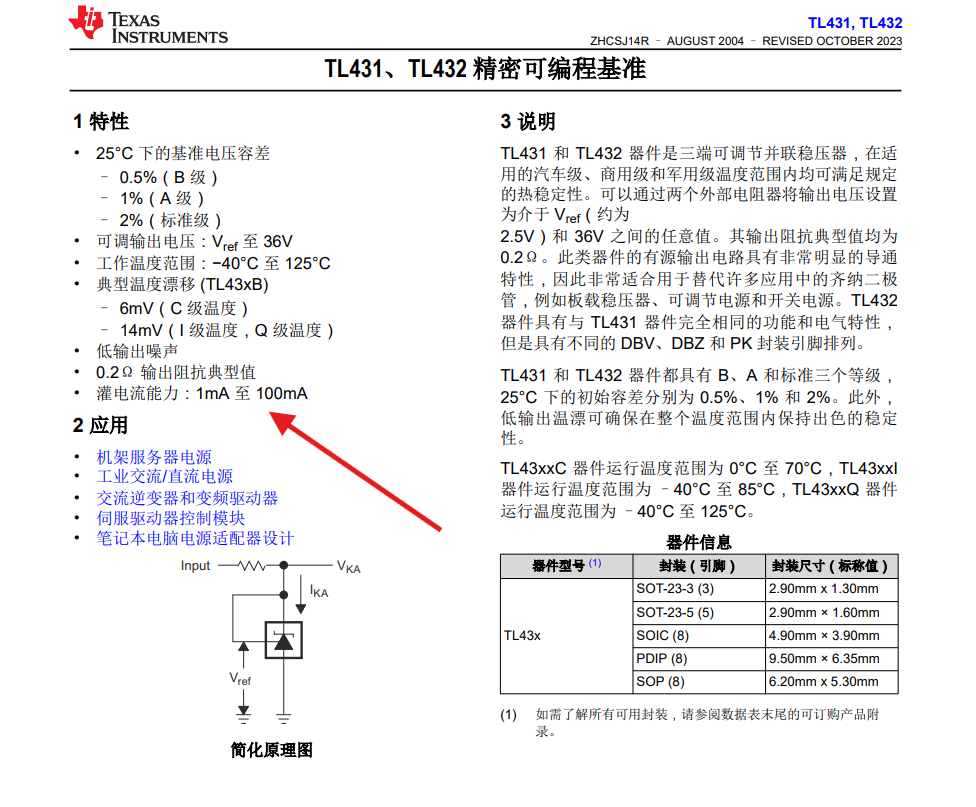
According to the datasheet, the input current of the TL431 should not be less than 1mA.
(5V-2.5V)/1mA=2.5KΩ.

To reduce the types of resistors used, a 1K resistor is selected.
At this time, the current is (5V-2.5V)/1K=2.5mA.

When the TL431 output is under load, the power package of this resistor should also be noted
. It is not used in this project, so it will not be explained.
The above is the schematic diagram of this project.
2. PCB layout and routing points


PCB (color silkscreen and 3D shell are hidden)
2.1 The current sampling section
handles large currents
and can be connected using a fill area or copper pour. However, be careful not to use the default divergent pad connection method (with copper foil).
Also, use a prohibited area to isolate GND
2.2.
Although the I- network and GND network are the same network,
it's important to note that a large current flows through I-, making it a "power ground."
Even if this point is grounded, current fluctuations will cause changes in the network level,
so we can consider this network as an "interference source."
The GND network is the negative terminal of the meter's power supply, i.e., "signal ground."
Since the microcontroller's AGND and the meter's GND are not isolated,
the meter's GND can be considered a "sensitive ground,"
and therefore needs to be protected from interference. In circuit design,
never connect all GNDs together indiscriminately.
2.3 Heat
Dissipation Design: The step-down chip generates significant heat during operation,
requiring vias and copper plating for heat dissipation.
Don't forget to create ventilation holes!
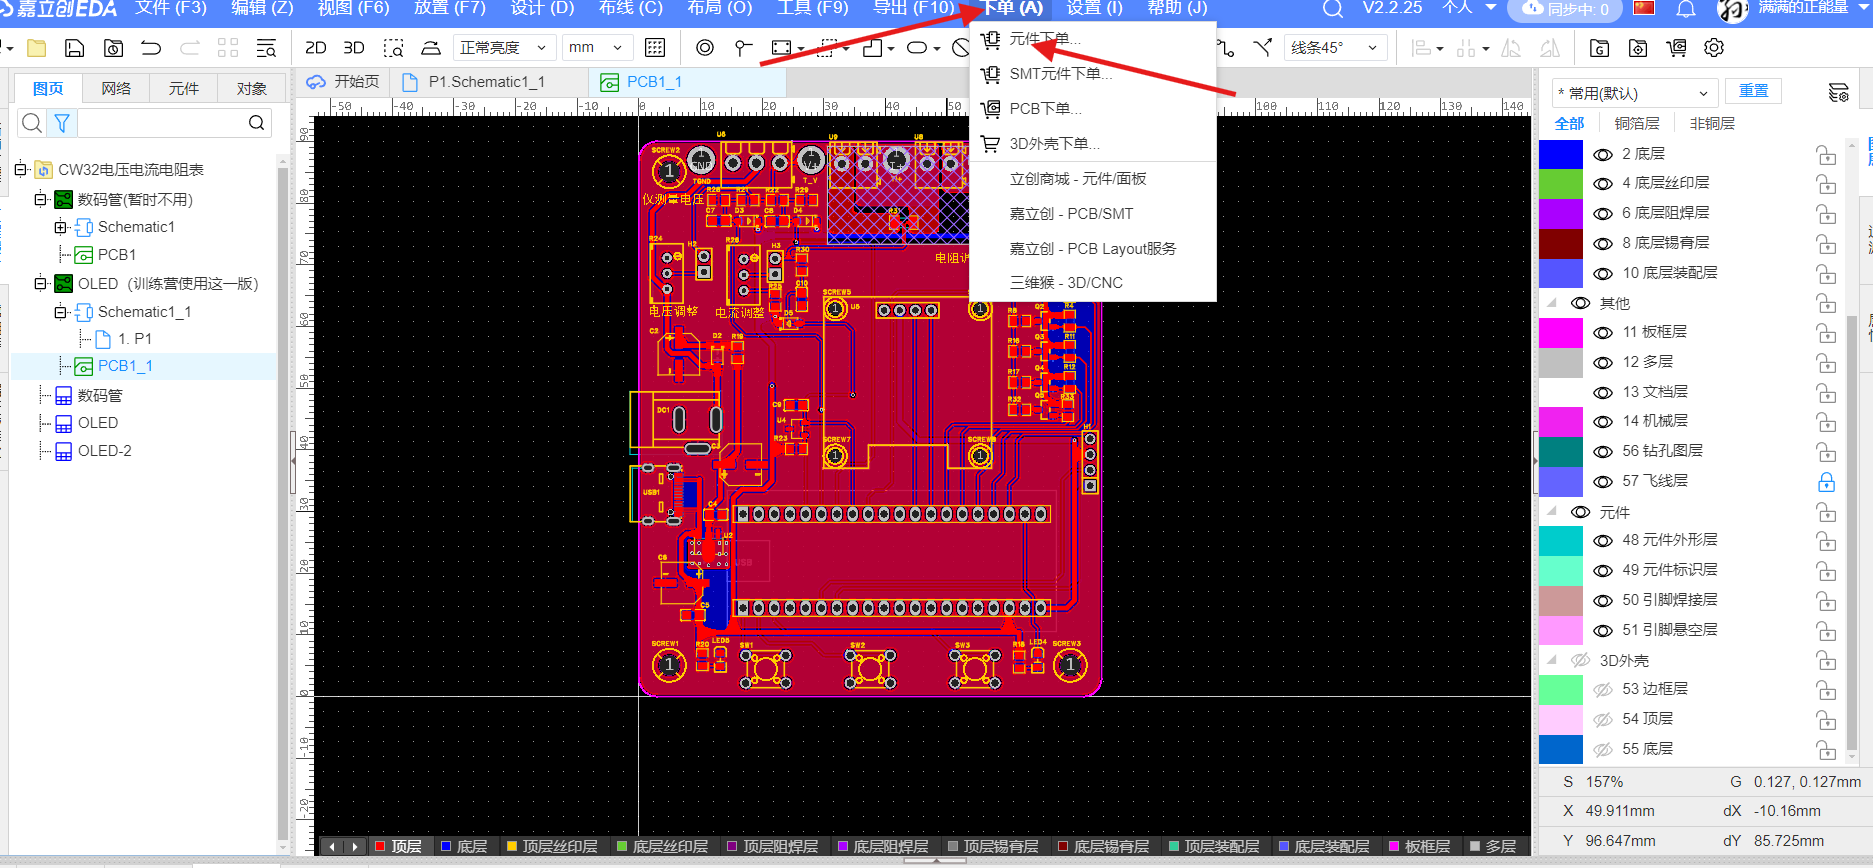
3. Component Ordering and Soldering:
This project has undergone component standardization checks.
All components can be ordered directly from the LCSC online store.

When soldering, please note:
1. After soldering power chips and components, first check for short circuits between GND and power supply, then power on to test and verify the accuracy of the step-down section. If there are no problems, proceed to the next step.
2. Solder surface-mount components, from smallest to largest and from lowest to highest voltage.
3. When soldering through-hole components, first insert them into the pin headers on the development board, ensuring proper spacing to avoid the awkward situation of not being able to insert them after soldering.
4. Use a multimeter in continuity mode to check for short circuits between GND and power supply.
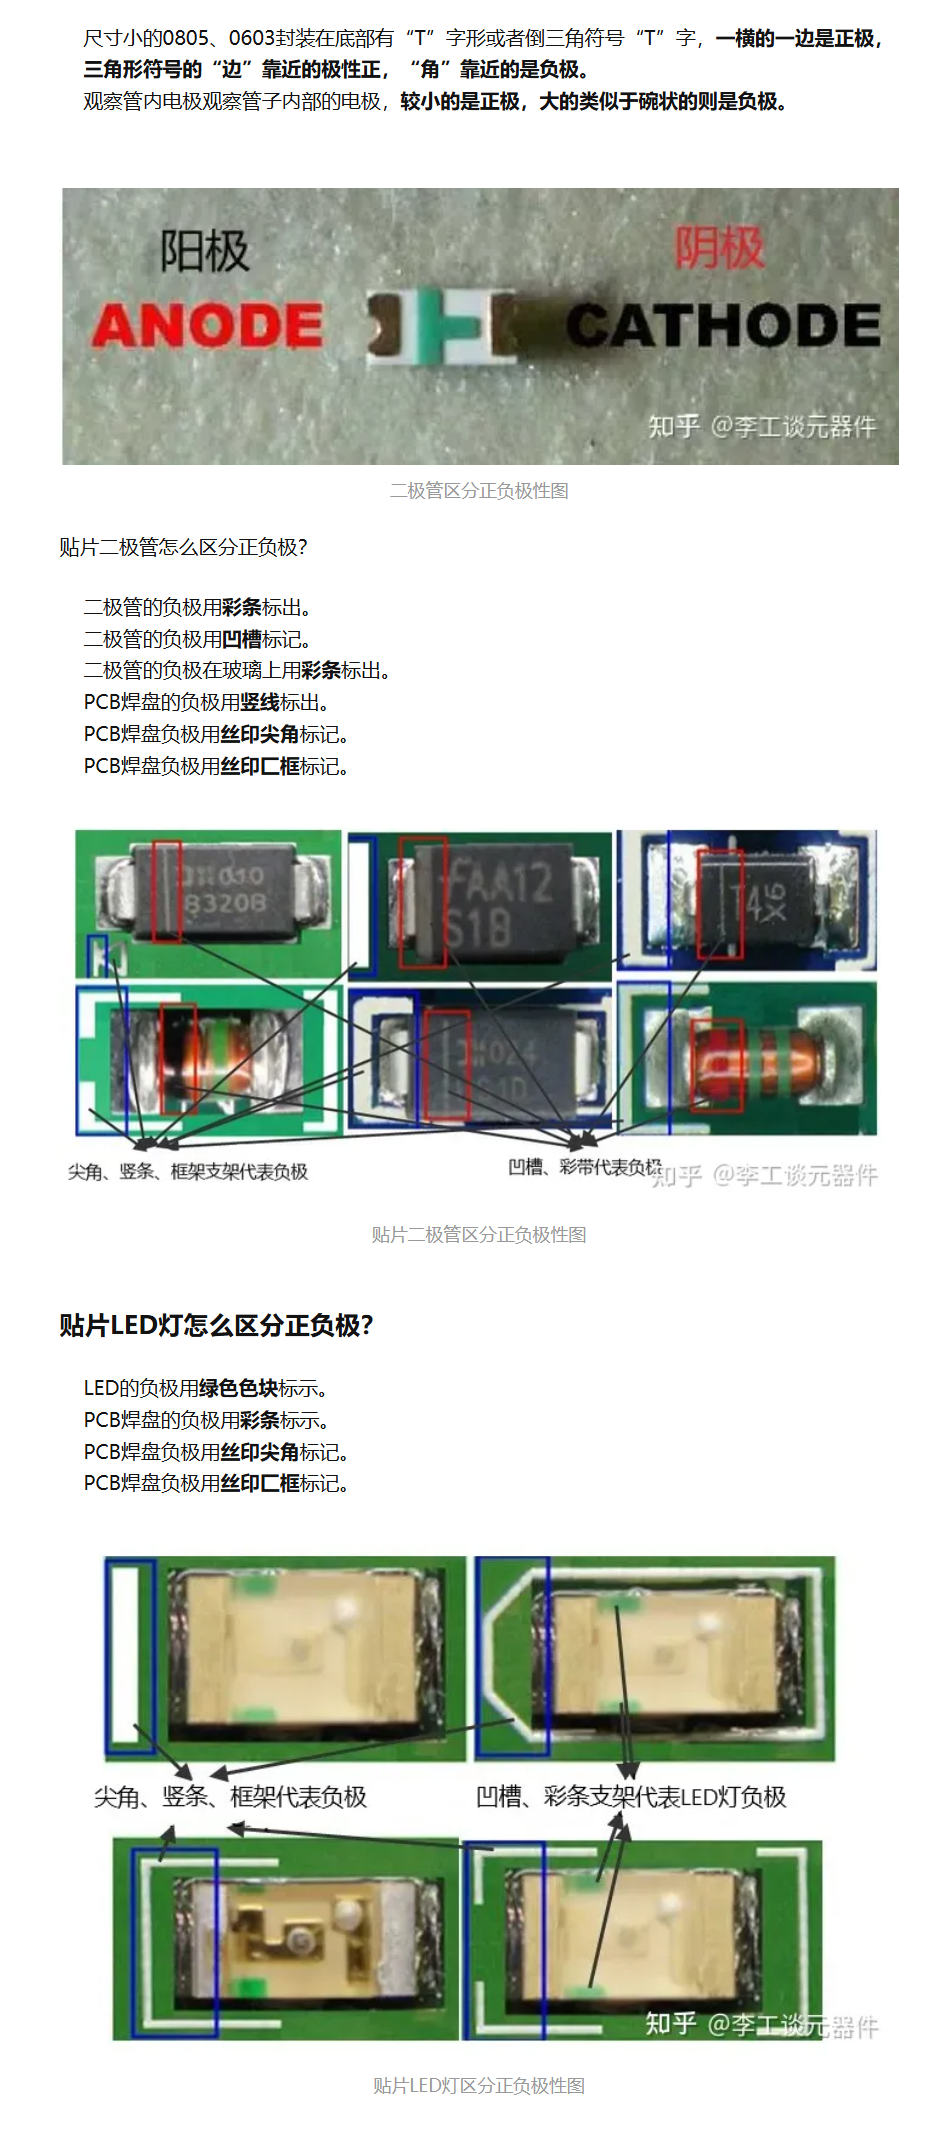
5. Pay attention to polarized components such as diodes, electrolytic capacitors, and LEDs; do not solder them backwards (I soldered one incorrectly and spent two hours troubleshooting).
Note: Do not solder the current-sensing resistor during analog measurements
!!! Note: Do not solder the current-sensing resistor during analog measurements!!!
Note: Do not solder the current-sensing resistor during analog measurements!!!
All surface mount resistors and capacitors use 0805 packages for easy soldering .
4. Program writing and debugging
code files are attached.
Detailed code explanation is below.
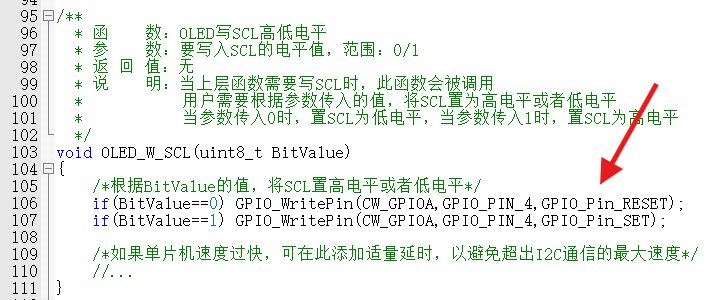
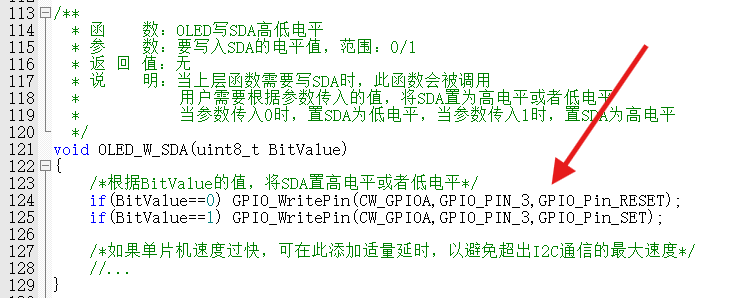
4.1 Porting the Jiangxie Technology OLED driver library:
Modify the GPIO definitions and initialization.

After modification, click on the screen
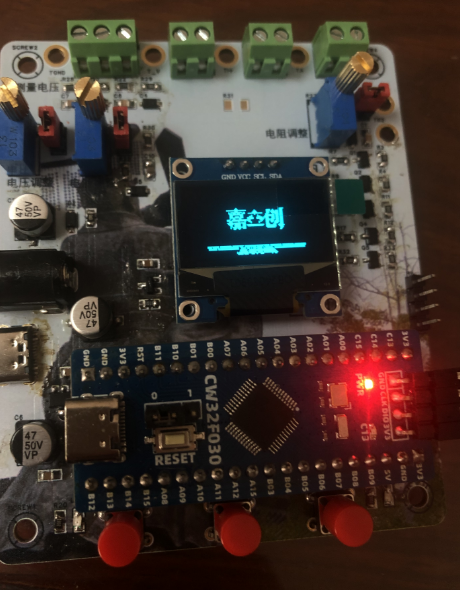
and JLCPCB to start!
4.2 Porting the Official Example Program:
It's not that I'm lazy, I just didn't want to write it from scratch. I removed
some pin adapters, changed
the digital tube driver function
to an OLED display,
and let's experience the ADC. 4.3
Unleashing My Talent: Adding Functionality. The
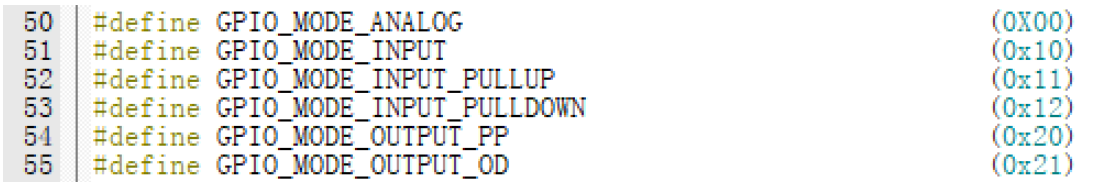
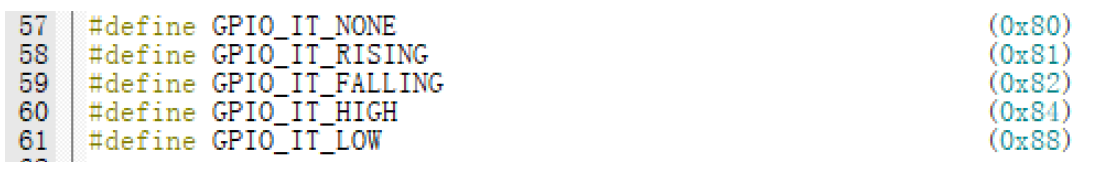
serial port part was modified based on the official example program. Resistance measurement function was added. The calibration interface was changed to a graphical interface. A function to detect when no measurement source is connected was added. A function to restore the calibration value to default was added. An anti-accidental touch function was added; the default value will only be restored after two consecutive presses. See the detailed code explanation below. 5. Code Explanation: Project files are attached. Program Flowchart: Clock Tree Configuration: In the CW32 library functions, find cw32f030_rcc.h. The header file contains functions related to clock tree configuration, as shown in the following figure: The program for configuring the clock tree is as follows: The CW32's external clock is completely disabled by default. Before using GPIO peripherals, we need to enable the corresponding clock. Find cw32f030_rcc.h in the CW32 library functions. This header file contains all clock-related function interfaces. The peripheral clock interface is shown in the following figure: The code is as follows: GPIO Initialization: GPIO initialization includes mode, interrupt enable, and I/O pin number. CW32's GPIO initialization first writes all initialization items into a structure, then passes the structure to the initialization function to complete the initialization. The GPIO-related function interfaces are all in the cw32f030_gpio.h header file. Let's first look at the GPIO modes, as shown in the following figure: GPIO modes include analog input, digital input, digital pull-up input, digital pull-down input, digital push-pull output, and digital open-drain output modes. Interrupt enable includes: no interrupt, rising edge, falling edge, low level, and high level interrupt enable. GPIO pin numbers are shown in the following figure:


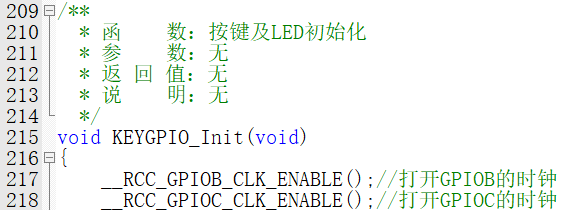

The pin outputs also require GPIO output speed configuration, with two speed settings: high and low. Setting it to high speed
or higher completes the GPIO structure initialization.
Next, we need to call the initialization function,
found in cw32f030_rcc.h: `void GPIO_Init(GPIO_TypeDef *GPIOx, GPIO_InitTypeDef *GPIO_Init);`. This
function contains two parameters: the first is the GPIO base address, and the second is the initialization configuration structure.
The LED test light pin is set to push-pull output mode,

the button input pin to pull-up input mode, and
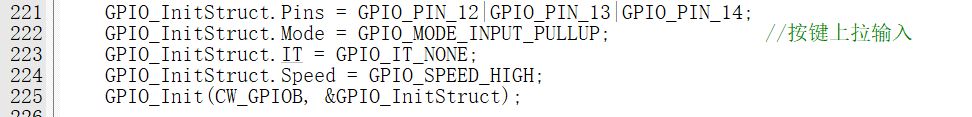
the resistance measurement range selection pin to open-drain output mode.
Open-drain output is used because the MOSFET is already connected to a pull-up resistor

. At this point, GPIO initialization is complete.
The next step is to initialize the ADC, timer, and serial port.
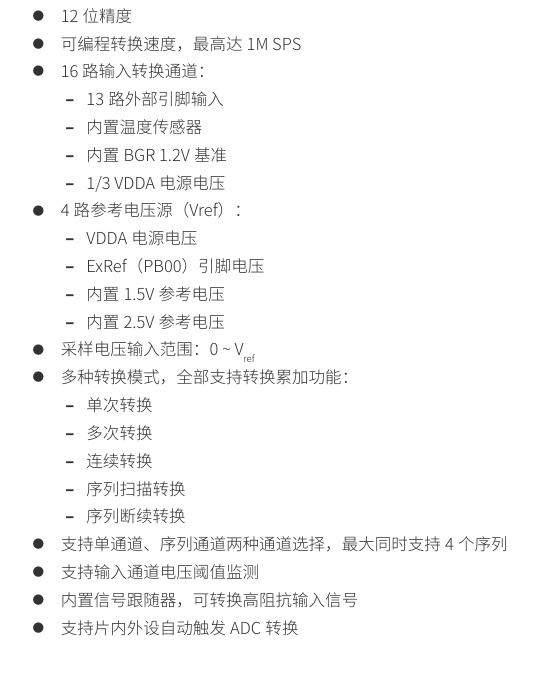
The CW32F030 integrates a 12-bit precision, 1M SPS successive approximation analog-to-digital converter (SAR ADC), capable of converting up to 16 analog signals to digital signals. Most signals in the real world are analog quantities, such as light, electricity, sound, and image signals. These must be converted into digital signals by an ADC before being processed digitally by an MCU.
The CW32F030 uses a successive approximation 12-bit ADC. Successive approximation ADCs are a common ADC operating principle. The idea is to gradually approximate the digital representation of the input signal by comparing the magnitude of the analog signal with a reference voltage. In a successive approximation ADC, the input signal and reference voltage are fed into a differential amplifier to generate a differential voltage. This differential voltage is then input to a successive approximation quantizer, which compares it to a series of reference voltages in a progressively decreasing manner. Specifically, in each approximation stage, the quantizer compares the input signal with an intermediate voltage point, using the reference voltage above or below that point as the reference voltage for the next approximation stage. This process continues until the quantizer approximates the final digital output value.
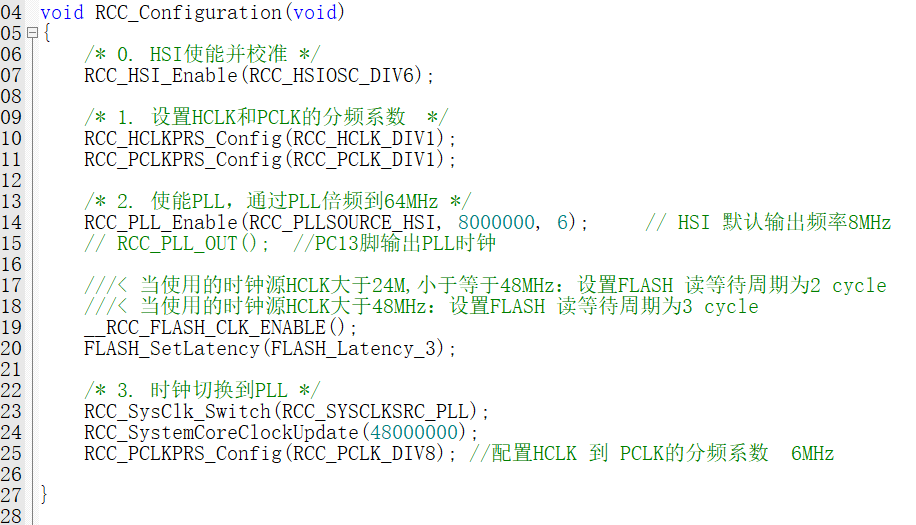
Note that this is explained in the ADC section of the user manual. The reference voltage uses an internal 1.5V, so the maximum clock frequency of the ADC is 4MHz. Therefore, when using an ADC, the clock bus frequency connected to the ADC needs to be divided to below 4MHz.

ADC clock source:
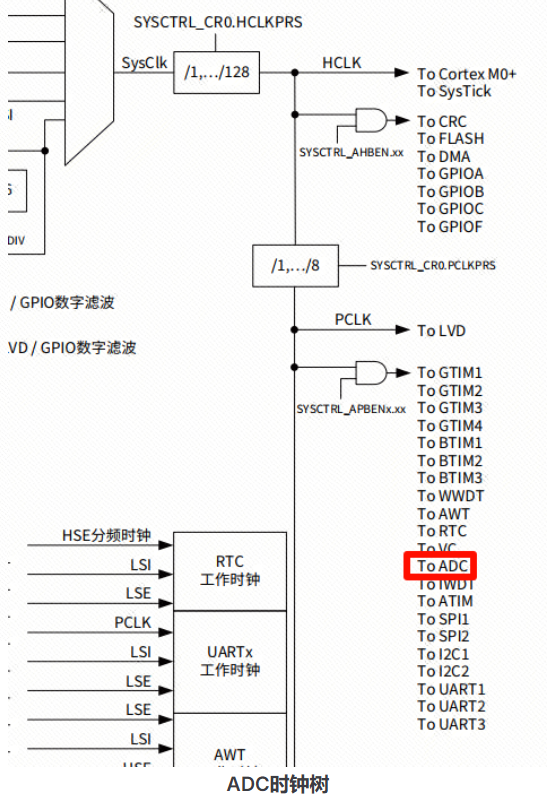
We choose a 4-division rule. The ADC clock is:

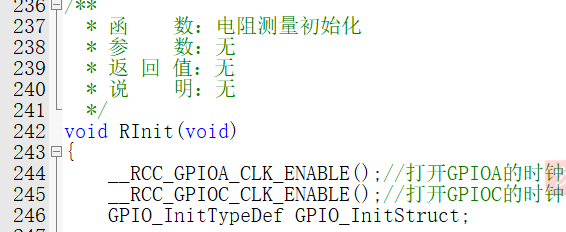
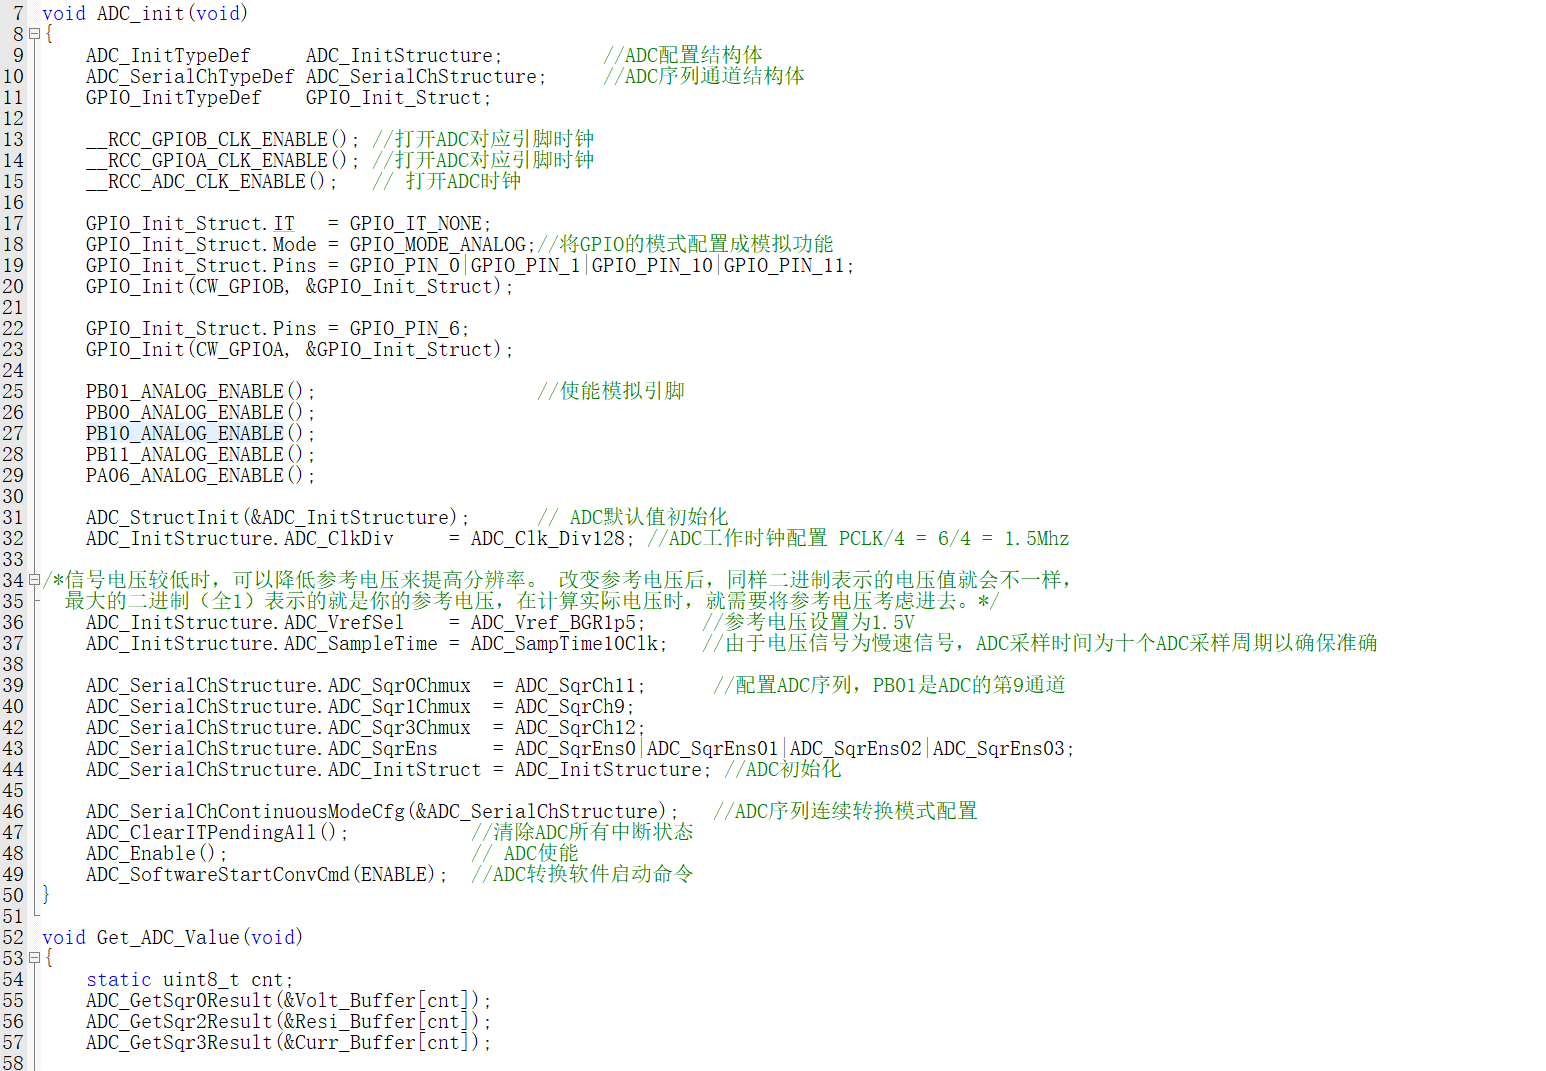
To operate the GPIO pins, it is essential to configure the GPIO, including enabling the clock, configuring the mode, configuring the output, and setting functions.
After the ADC is configured, it cannot start working; it needs to be enabled.
It is important to note that the ADC must be enabled before self-calibration can begin.
The following is the ADC initialization function:
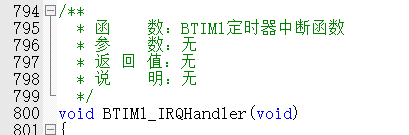
The CW32F030C8T6 has a total of 8 timers, including 1 advanced control timer, 4 general-purpose timers, and 3 basic timers.
This time, we are using the BTIM1 basic timer . Its
main features are as follows:

Using the timer function requires the following steps:
Enabling the clock (timer clock), enabling
interrupts
, configuring timer parameters,
enabling interrupt events and timers, and
writing interrupt service functions.
The configuration code is as follows:

Interrupt service function:
The specific function will be introduced later
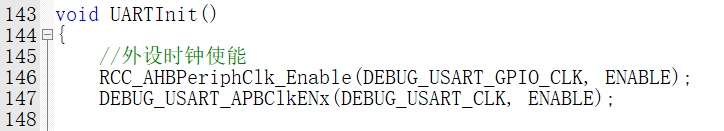
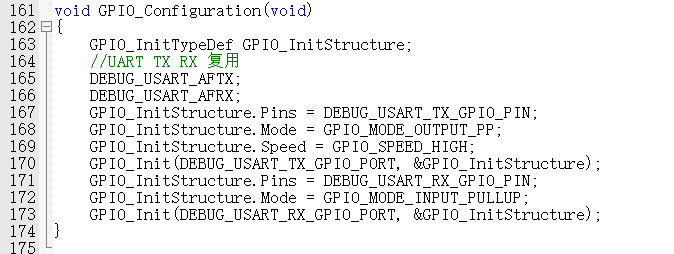
. Generally, when using a serial port, the following steps are required.
Enable clock (including serial port clock and GPIO clock)
, configure GPIO multiplexing mode
, configure GPIO mode
, configure GPIO output
, configure serial port (configure some parameters),
enable serial port (serial port enable and transmit enable).
This project uses UART3,
PA9 is multiplexed as TX ,
PA10 is multiplexed as RX.
Relevant parameters are macro-defined for easy modification.

Enable clock:

Configure GPIO and multiplexing function:
Serial port configuration:

Relevant parameters:
USART_InitStructure.USART_BaudRate: Baud rate
calculation formula:
- USART_Over = 00, BaudRate = UCLK / (16 * BRRI + BRRF) - USART_Over = 01, BaudRate = UCLK / (8 * BRRI) - USART_Over = 10, BaudRate = UCLK / (4 * BRRI) - USART_Over = 11, BaudRate = (256 * UCLK) / BRRI
USART_InitStructure.USART_Over: Sampling mode;
USART_InitStructure.USART_Source: Transmission clock source (UCLK);
USART_InitStructure.USART_UclkFreq: USART clock frequency (same as the main frequency);
USART_InitStructure.USART_StartBit: Start bit determination method;
USART_InitStructure.USART_StopBits: Stop bit length; USART_InitStructure.USART_Parity
: Parity check method;
USART_InitStructure.USART_HardwareFlowControl: Hardware flow control;
USART_InitStructure.USART_Mode : Enable send/receive.
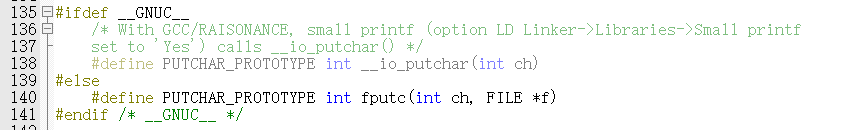
Next, redirect the serial port
. Use the `printf` function to print integers and decimals using `%d` and `%f`,
which is more convenient than sending strings.
The code is as follows:
At this point, the ADC, timer, and serial port have been initialized
. Initialization is complete. Now let's get started.
First, let's introduce calibration,
which is arguably the most troublesome part of this project. Here
's a concept (excerpted from the official documentation):

The program uses three calibration points
: voltage calibration points are 0V, 5V, and 15V;
current calibration points are 0A, 0.5A, and 1.5A;
and resistance calibration is performed using a simple linear method .
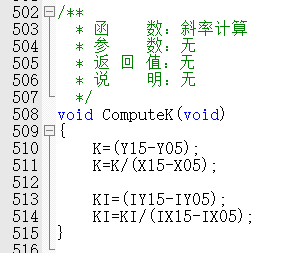
This function is used to calculate the slope K;
anyone who has studied in junior high school should understand this.
Without further ado,
the raw voltage measurement value is processed
as follows:
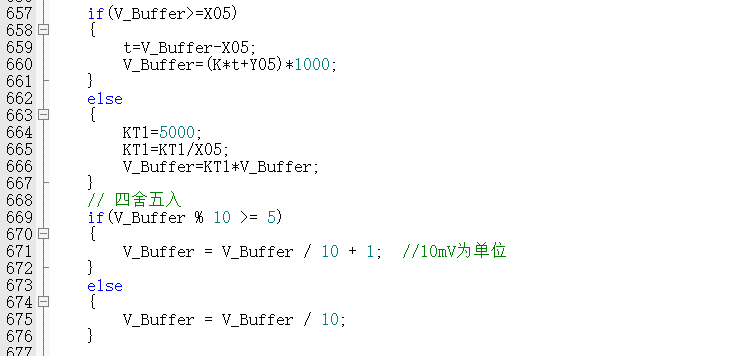
First, determine which segment of the broken line the measured value falls
on. Then, calculate the processed value based on the slope and calibration point coordinates.
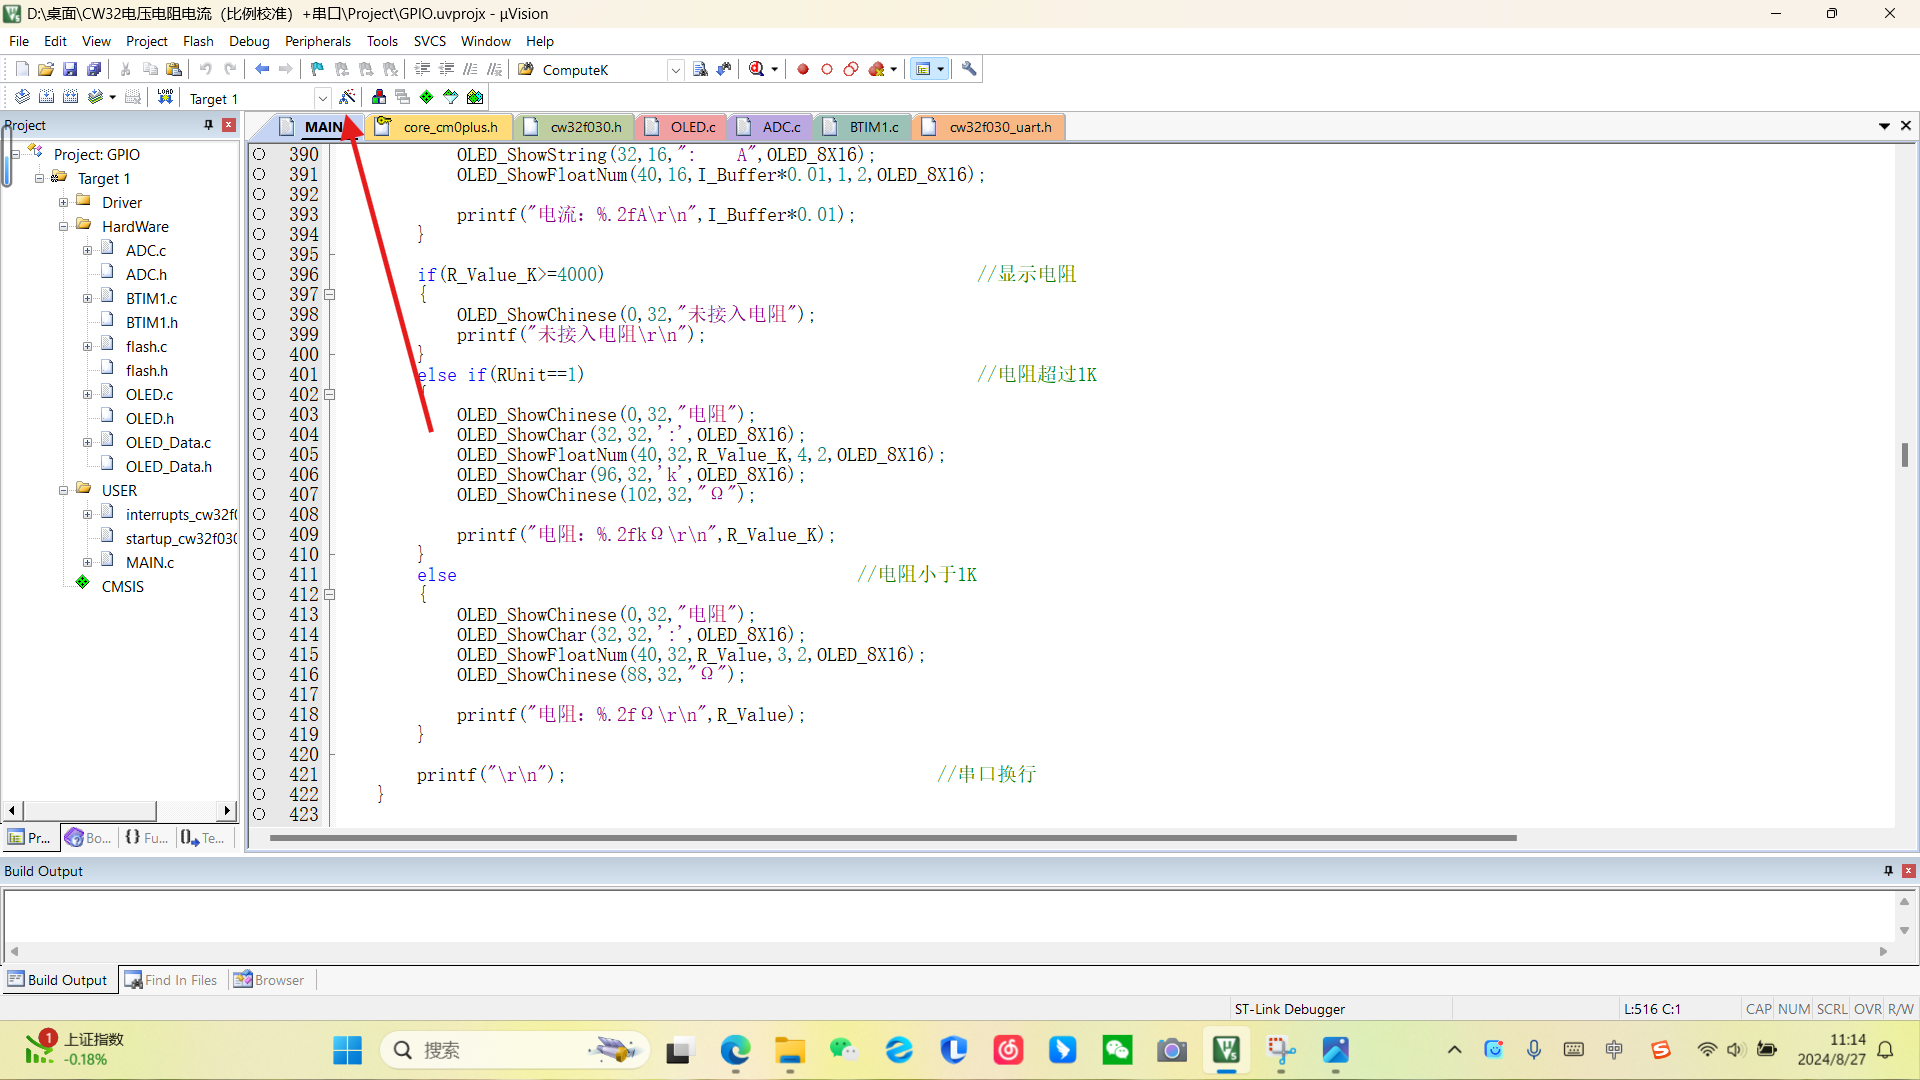
This value is stored as a multiple of 1000, rounded to 100 times the actual value, and then divided
by 100 for display.
Current calibration is similar; only the relevant variables need to be modified.
The code is as follows:

Resistance measurement and calibration are more complex
because there are multiple ranges.
Only linear calibration was performed (definitely not because I'm lazy).
Define the variable RMode
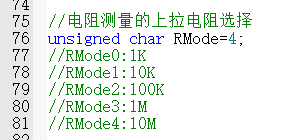
to switch between different ranges .
Then, write a function to switch the resistance measurement range:

For different measurement ranges, use different calculation formulas:
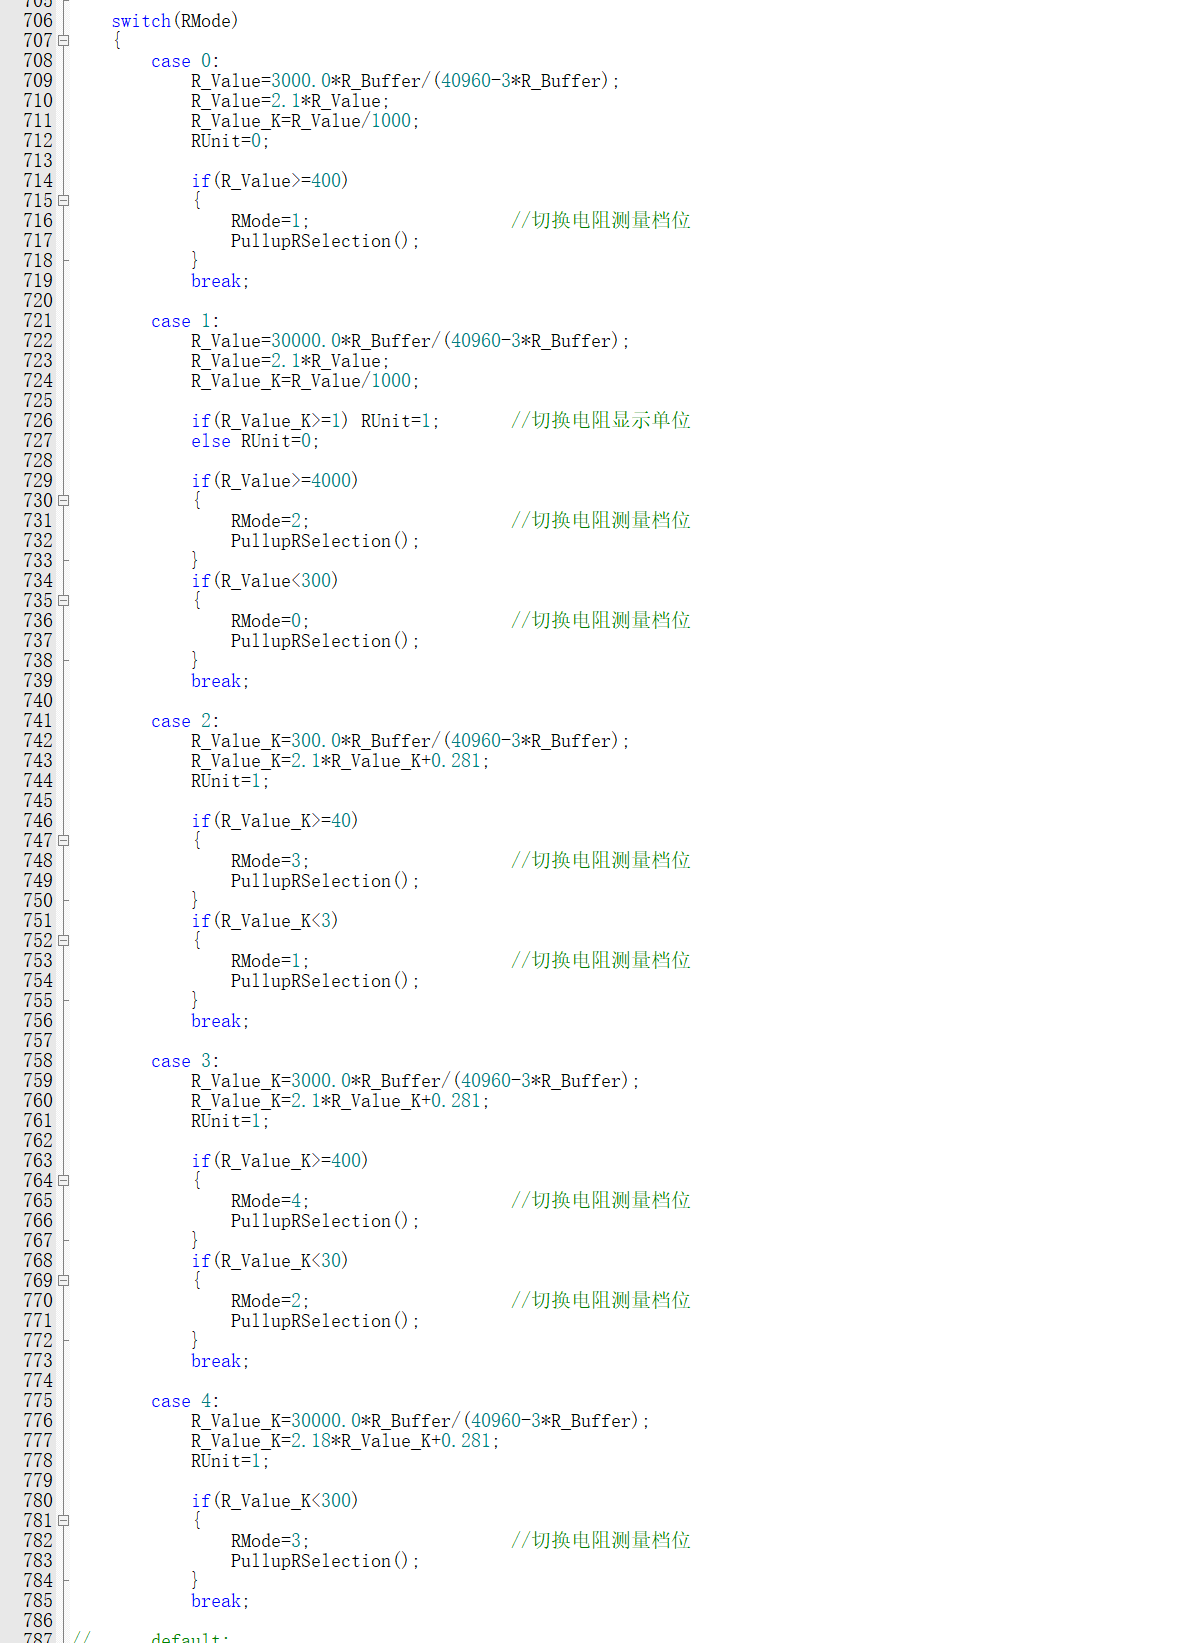
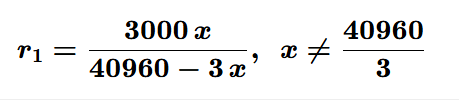
The first calculation of R_Buffer converts the measured value to the actual value.
The conversion formula is derived as follows: (x represents the ADC measured value, r represents the resistance value to be measured)
First range: Unit Ω
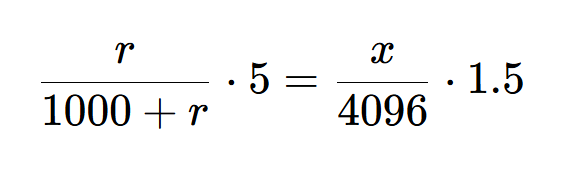
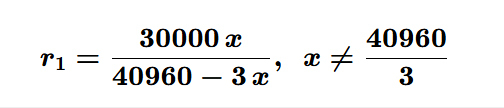
Solving

for the following ranges, the derivation formulas are similar,
only the resistance value of the high-side resistor in the voltage divider circuit needs to be modified.
Here are the results:
Second range: (Unit Ω)
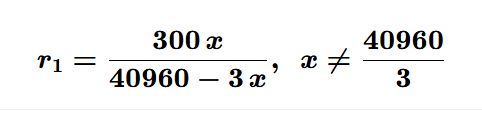
Third range: (Unit kΩ)
Fourth range: (Unit kΩ)
Fifth range: (Unit kΩ)

After calculating the initial measured value,
calibration is performed based on the calibration data
. Using mathematical plotting software, the randomly sampled measured and actual data
are input and converted into points on the coordinate system
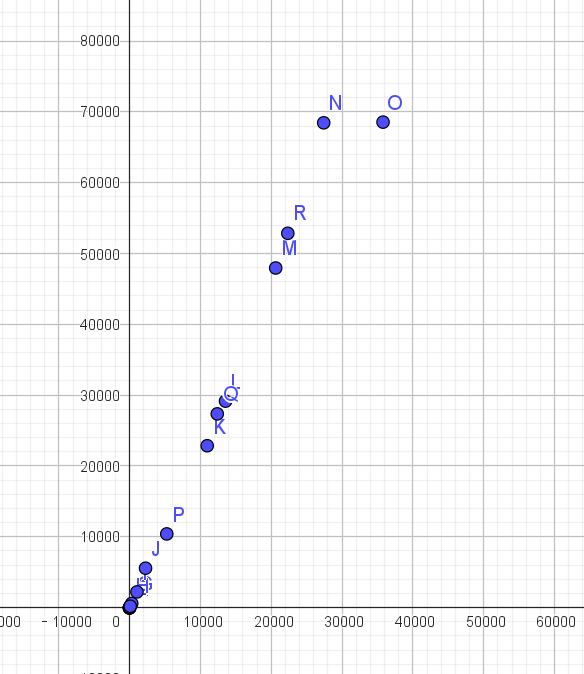
. Then, the best-fit line function is used to find the calibration function.

When the measured value is small, it does not match the calibration function very well,
so the data less than 1KΩ is fitted again.
Thus, we obtain two calibration functions

, which are written into the program.


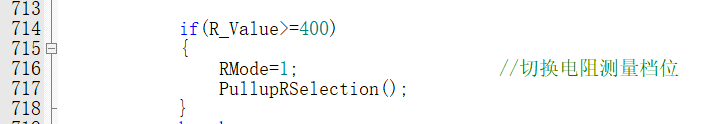
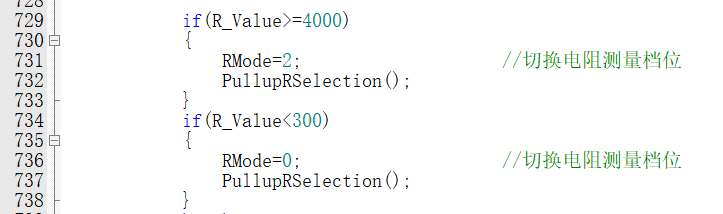
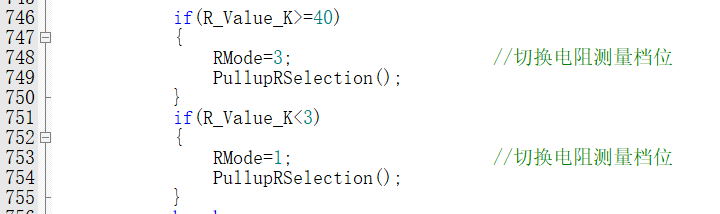
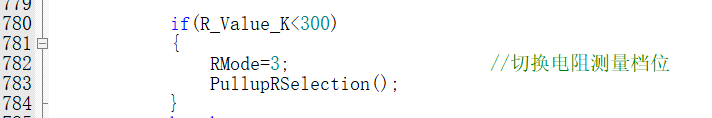
The resistance also needs to add an automatic range switching function.
The following is the relevant code:

The measurement and calibration part is completed.
Let's talk about the OLED plotting part
, especially the calibration plotting.
Does it look a bit confusing?
Let me explain in detail.

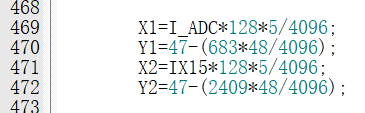
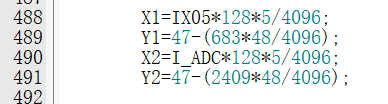
Taking the 5V voltage calibration as an example,
X1Y1 is the coordinate of the first calibration point,
X2Y2 is the coordinate of the second calibration point,

and VADC is the raw voltage data obtained by the ADC, ranging from 0 to 4096.
OLED screens have 128 pixels horizontally. Dividing
VADC by 4096 and then multiplying by 128 gives the corresponding horizontal coordinate

. Some may wonder
where the number 595 comes from.
The first voltage calibration point is 5V.
Based on the measurement accuracy calculated earlier,
the first voltage level resolution is 0.0084V ,
so

595 is the raw value measured by the ADC after a 1:22 voltage division of 5V.
Because the coordinate system has 48 pixels vertically
, it is divided by 4096 and then multiplied by 48.
The 15V calibration point follows the same logic,

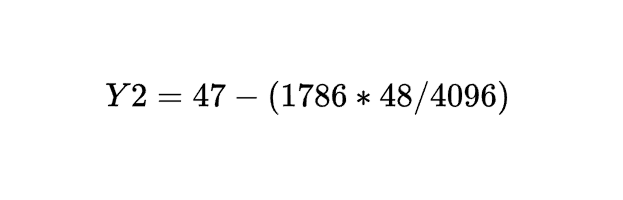
except that the ADC measurement value is replaced with the calibration value stored in flash.
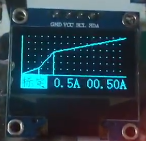
After the line graph is drawn,
a perpendicular line needs to be drawn from the calibration point to the X-axis,
and relevant text descriptions need to be displayed

. The effect is as follows:

The current calibration display is not much different.
The only thing to note is
that the maximum current range is 3A, which is converted to 0.3V
, while the ADC range is 1.5V, so each coordinate needs to be multiplied by 5.
The code is as follows:
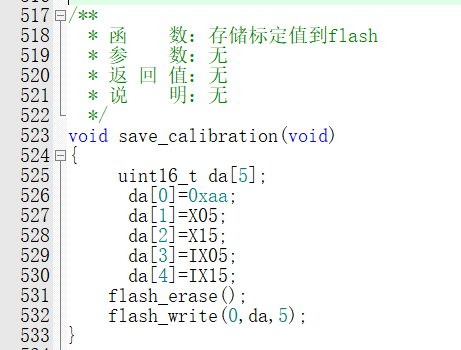
After that, the calibration data needs to be stored in flash. The
code is as follows:

At the same time, before each calibration and measurement, the calibration value in flash also needs to be read. The serial
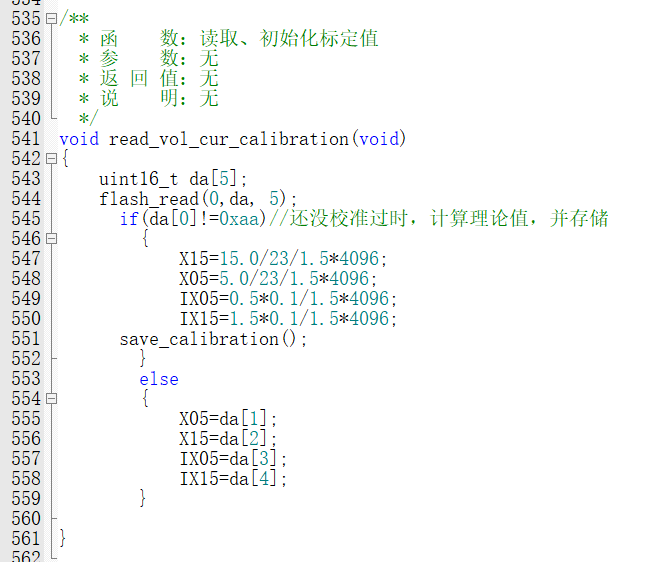
port sending
function is not difficult. Just send the content to be displayed on the screen to the serial port.
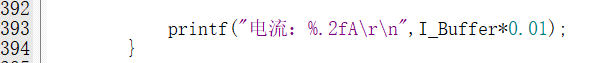
Note that the voltage and current are stored as 100, and need to be multiplied by 0.01 when displayed.


Mean filtering algorithm (excerpted from the official documentation).

Due to space limitations, more detailed parts are not mentioned
. If you have any questions, please download the program in the attachment, which has detailed comments.
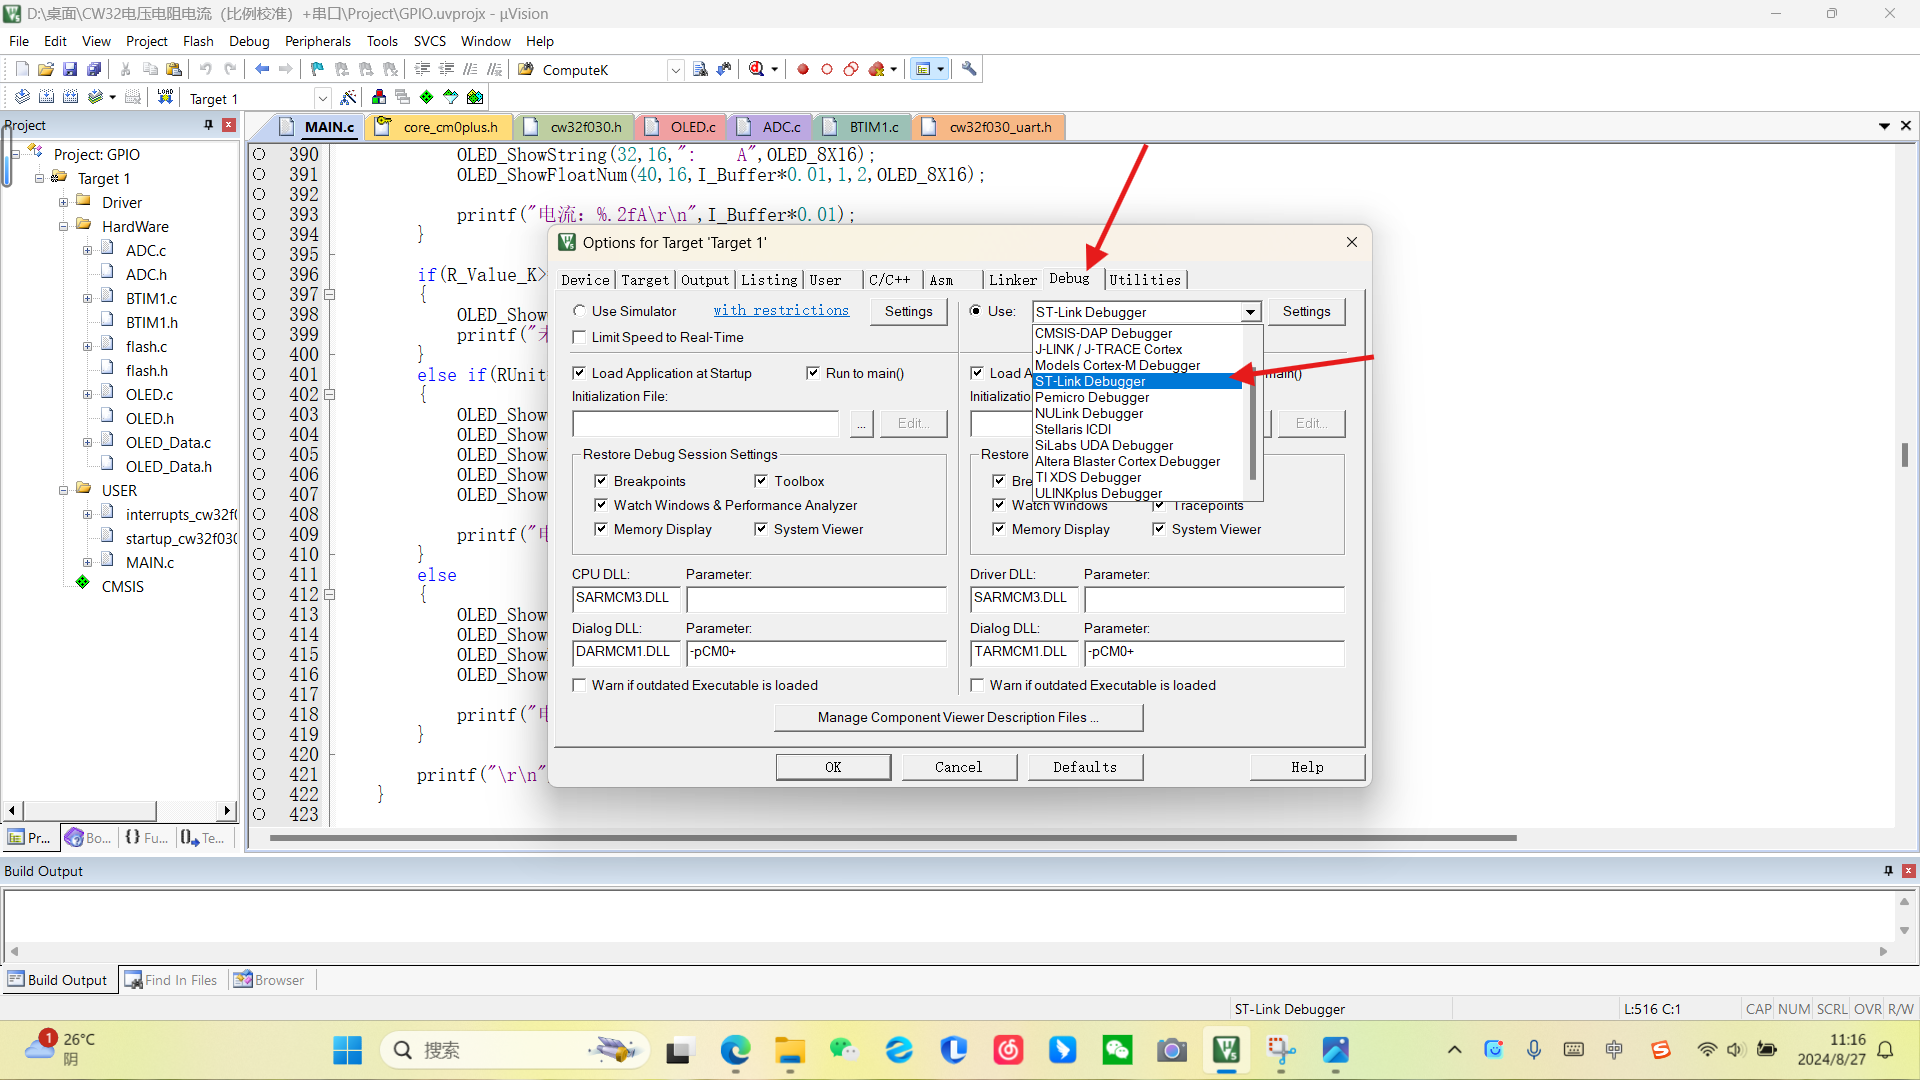
6. The programming tutorial
involves inserting a programmer (I used STLink),
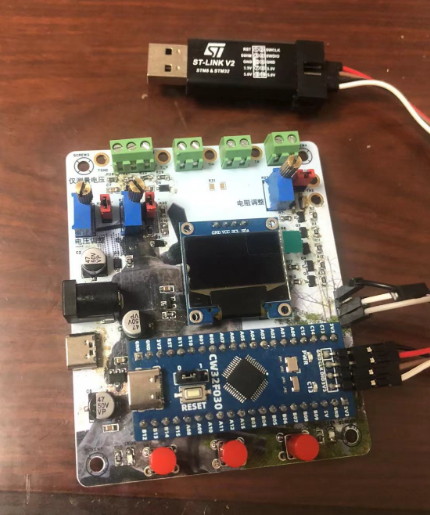
opening the project file
, clicking the magic wand icon
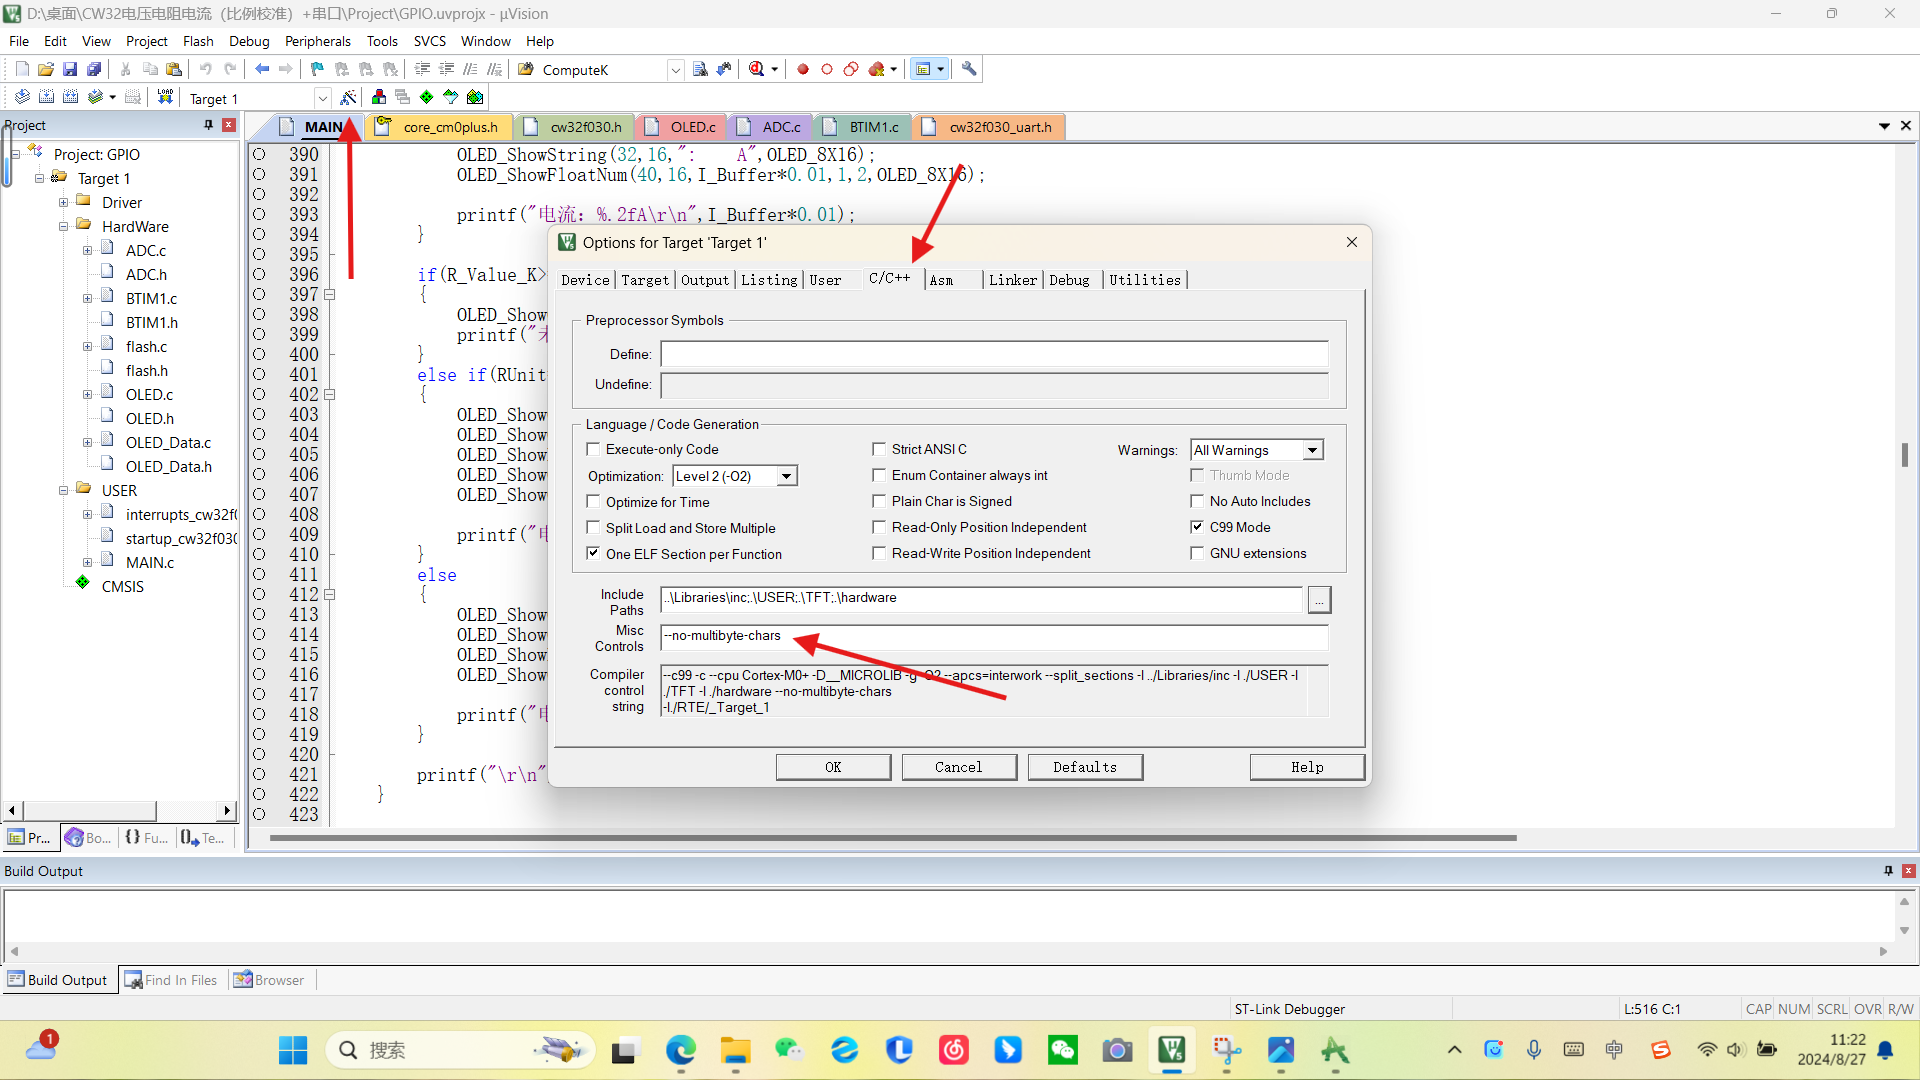
, and selecting the corresponding chip (a PACK package needs to be downloaded from the official website of Chipsource Semiconductor). After compiling, download

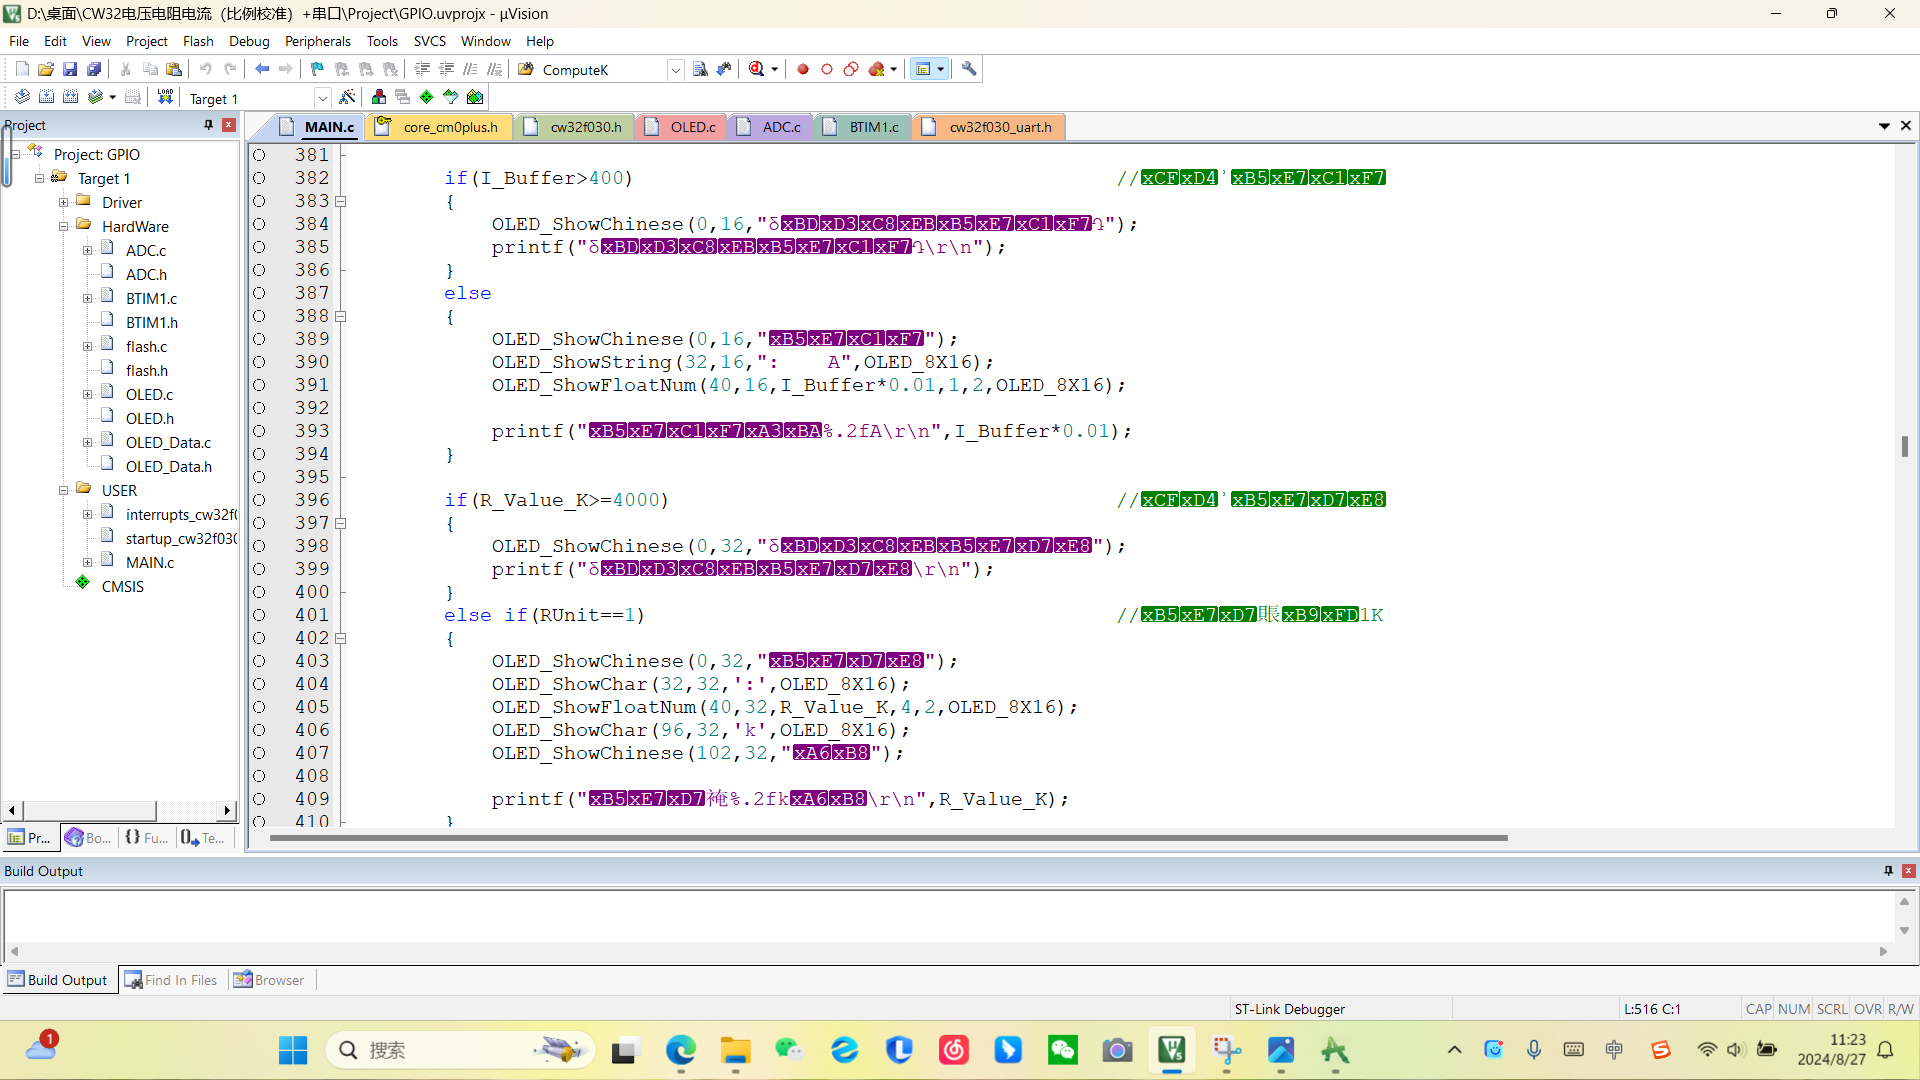
the corresponding programmer. If errors occur, it's because the compiler doesn't support Chinese characters by default. Add the following line: `--no-multibyte-chars`. This project uses GB2312 encoding. If garbled characters appear after opening (like this) , `


 京公网安备 11010802033920号

 MR0228A16PX28F111