I. Introduction
to using the LCSC CW32F030C8T6 development board to build a voltage and current meter. Measurement range (recommended): 0-30V, 0-3A.
II. Hardware Design and Circuit Composition.
Development Board Selection:
Core Board: LCSC CW32F030C8T6 development board. This board is based on the ARM Cortex-M0+ core with a main frequency of up to 64MHz, 8KB RAM, and rich peripheral interfaces, making it suitable for building voltage and current meters.
Voltage Measurement Circuit Design:
Voltage Divider Circuit: To measure voltages from 0-30V, the ADC uses an internal 1.5V reference. This project uses a voltage divider circuit to achieve high voltage acquisition. The current configuration acquires voltages from 0-30V, and the voltage divider resistors are designed to be 220K+10K, therefore the voltage divider ratio is 22:1 (ADC_IN11). Therefore, 220K (R8), which is greater than 200K and closest to the specified value, is selected.
Protection Circuit: To prevent damage to the ADC from excessively high input voltage, necessary protection circuits should be added, such as current-limiting resistors and clamping diodes. In this project, 1N4148 (D1, D2) are added as clamping diodes in the sampling circuit.

Current Measurement Circuit Design:
Sampling Resistor: By connecting a small-value sampling resistor in series in the circuit, the current is converted into a voltage signal, which is then acquired by the ADC. The sampling current designed in this project is 3A, and the selected sampling resistor (R0) is 100mΩ.
Amplifier Circuit: Depending on actual needs, an amplifier circuit may also be required to improve measurement accuracy. No operational amplifier is used in this project to build the amplifier circuit, therefore the multiplier is 1.
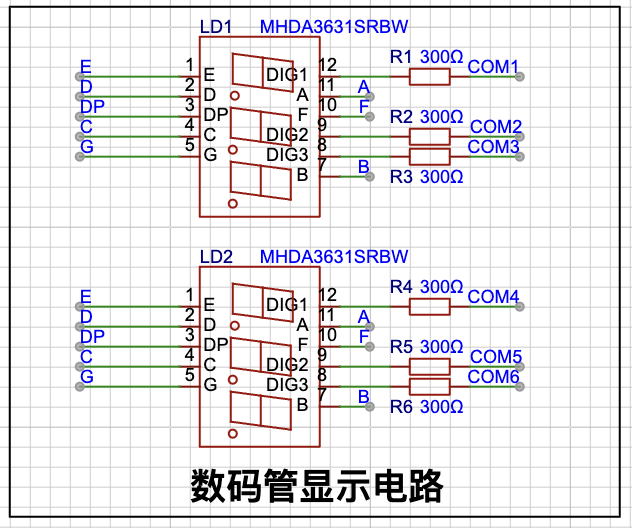
Display Module:
The display module in this project uses a common-anode digital tube to display the measured voltage and current values in real time.
Other Peripherals: None
. III. Software Programming
Environment Setup:
Install and configure a development environment suitable for the CW32F030C8T6 development board, such as Keil MDK-ARM. Follow the steps in the official documentation to create an empty project. The environment was already installed in the previous training camp.
ADC Configuration:
Configure the ADC module and set appropriate parameters such as sampling rate and resolution to meet the needs of voltage and current measurement.
void ADC_init(void)
{
ADC_InitTypeDef ADC_InitStructure; // ADC configuration structure
ADC_SerialChTypeDef ADC_SerialChStructure; // ADC serial channel structure
GPIO_InitTypeDef GPIO_Init_Struct;
__RCC_GPIOB_CLK_ENABLE(); // Enable clock for the corresponding ADC pin
__RCC_ADC_CLK_ENABLE(); // Enable ADC clock
GPIO_Init_Struct.IT = GPIO_IT_NONE;
GPIO_Init_Struct.Mode = GPIO_MODE_ANALOG;// Configure GPIO mode to analog function
GPIO_Init_Struct.Pins = GPIO_PIN_10; // PB10 is the voltage acquisition pin
GPIO_Init(CW_GPIOB, &GPIO_Init_Struct);
PB10_ANALOG_ENABLE(); // Enable analog pin
ADC_StructInit(&ADC_InitStructure); // Initialize ADC default values
ADC_InitStructure.ADC_ClkDiv = ADC_Clk_Div4; // Configure ADC operating clock PCLK/4 = 6/4 = 1.5MHz
/* When the signal voltage is low, the reference voltage can be reduced to improve resolution. After changing the reference voltage, the same binary representation of the voltage value will be different.
The largest binary value (all 1s) represents your reference voltage. When calculating the actual voltage, the reference voltage needs to be taken into account. */ /*
ADC_InitStructure.ADC_VrefSel = ADC_Vref_BGR1p5; // Set the reference voltage to 1.5V
ADC_InitStructure.ADC_SampleTime = ADC_SampTime10Clk; // Since the voltage signal is a slow signal, the ADC sampling time is ten ADC sampling cycles to ensure accuracy
ADC_SerialChStructure.ADC_SqrEns = ADC_SqrEns0; // Sqr is the sequence configuration register. Here, only the channel of sequence 0 is used, so it is configured to 0 to indicate that only the Sqr0 sequence is converted
ADC_SerialChStructure.ADC_Sqr0Chmux = ADC_SqrCh11; // Configure the ADC sequence. PB10 is the 11th channel of the ADC
ADC_SerialChStructure.ADC_InitStruct = ADC_InitStructure; // Initialize the ADC
ADC_SerialChContinuousModeCfg(&ADC_SerialChStructure); // ADC sequence continuous conversion mode configuration
ADC_ClearITPendingAll(); // Clear all ADC interrupt states
ADC_Enable(); // Enable ADC
ADC_SoftwareStartConvCmd(ENABLE); // ADC conversion software startup command
}
Data processing:
Process the data acquired by the ADC, including filtering, calibration, etc., to improve measurement accuracy.
// Mean filtering
uint32_t Mean_Value_Filter(uint16_t *value, uint32_t size)
{
uint32_t sum = 0;
uint16_t max = 0;
uint16_t min = 0xffff;
int i;
for(i = 0; i < size; i++)
{
sum += value[i];
if(value[i] > max)
{
max = value[i];
}
if(value[i] < min)
{
min = value[i];
}
}
sum -= max + min;
sum = sum / (size - 2);
return sum;
}
After calibration, the slope is calculated as follows:
void ComputeK(void)
{
K=(Y15-Y05);
K=K/(X15-X05);
KI=(IY15-IY05);
KI=KI/(IX15-IX05);
}
Display control:
Write code to control the display module and display the processed voltage and current values on the screen in real time. This project uses a common anode digital tube, so the official sample code digital tube display processing file Seg_Dis.c needs to be modified.
// According to the official code, modify the initial display array of the common anode digital tube, and invert other level settings
uint8_t Seg_Table[21] = {0xc0, 0xf9, 0xa4, 0xb0, 0x99, 0x92, 0x82, 0xf8, 0x80, 0x90, 0x40, 0x79, 0x24, 0x30, 0x19, 0x12, 0x02, 0x78, 0x00, 0x10, 0x08};
Function implementation:
realize data storage
// Calibration storage function
void save_calibration(void)
{
uint16_t da[5];
da[0]=0xaa;
da[1]=X05;
da[2]=X15;
da[3]=IX05;
da[4]=IX15;
flash_erase();
flash_write(0,da,5);
}
IV. Open Source Description
Project Open Source:
This project is open source. The project code adopts the official example code (understand and apply). The code modification shows that the display module is a common anode digital tube. The hardware design is open source.
V. Overall Design Block Diagram
Hardware Part
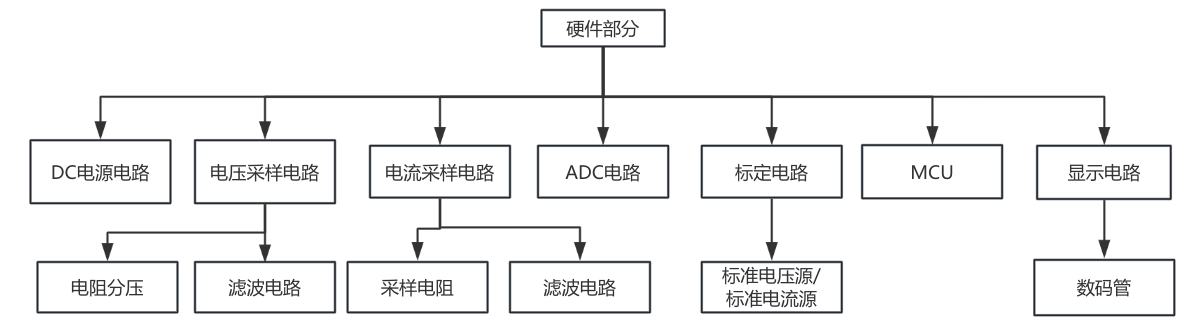
Software Part

VI. Physical Display
After soldering ,
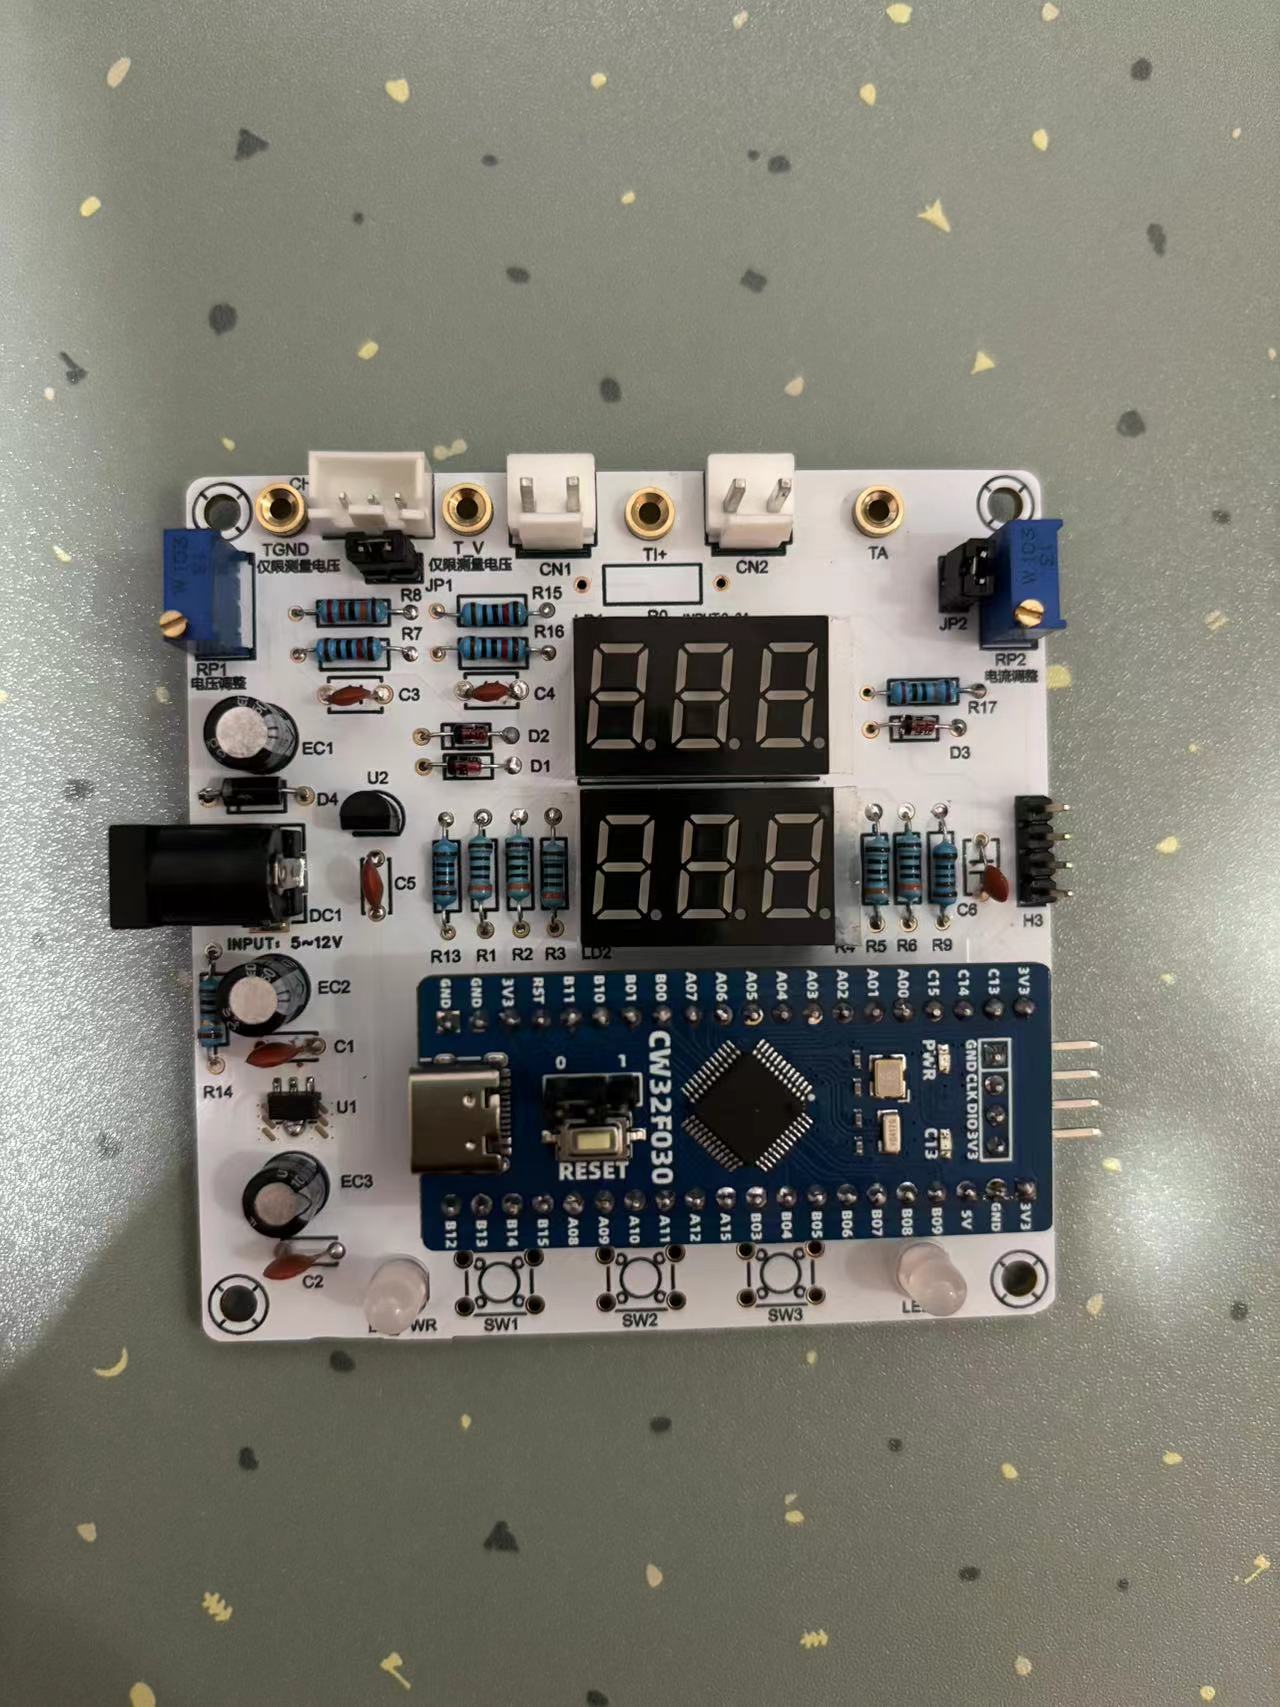
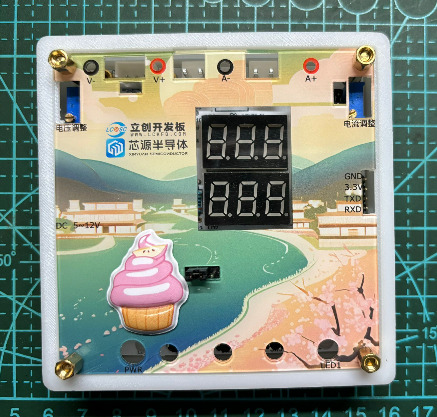
the color silk screen verification
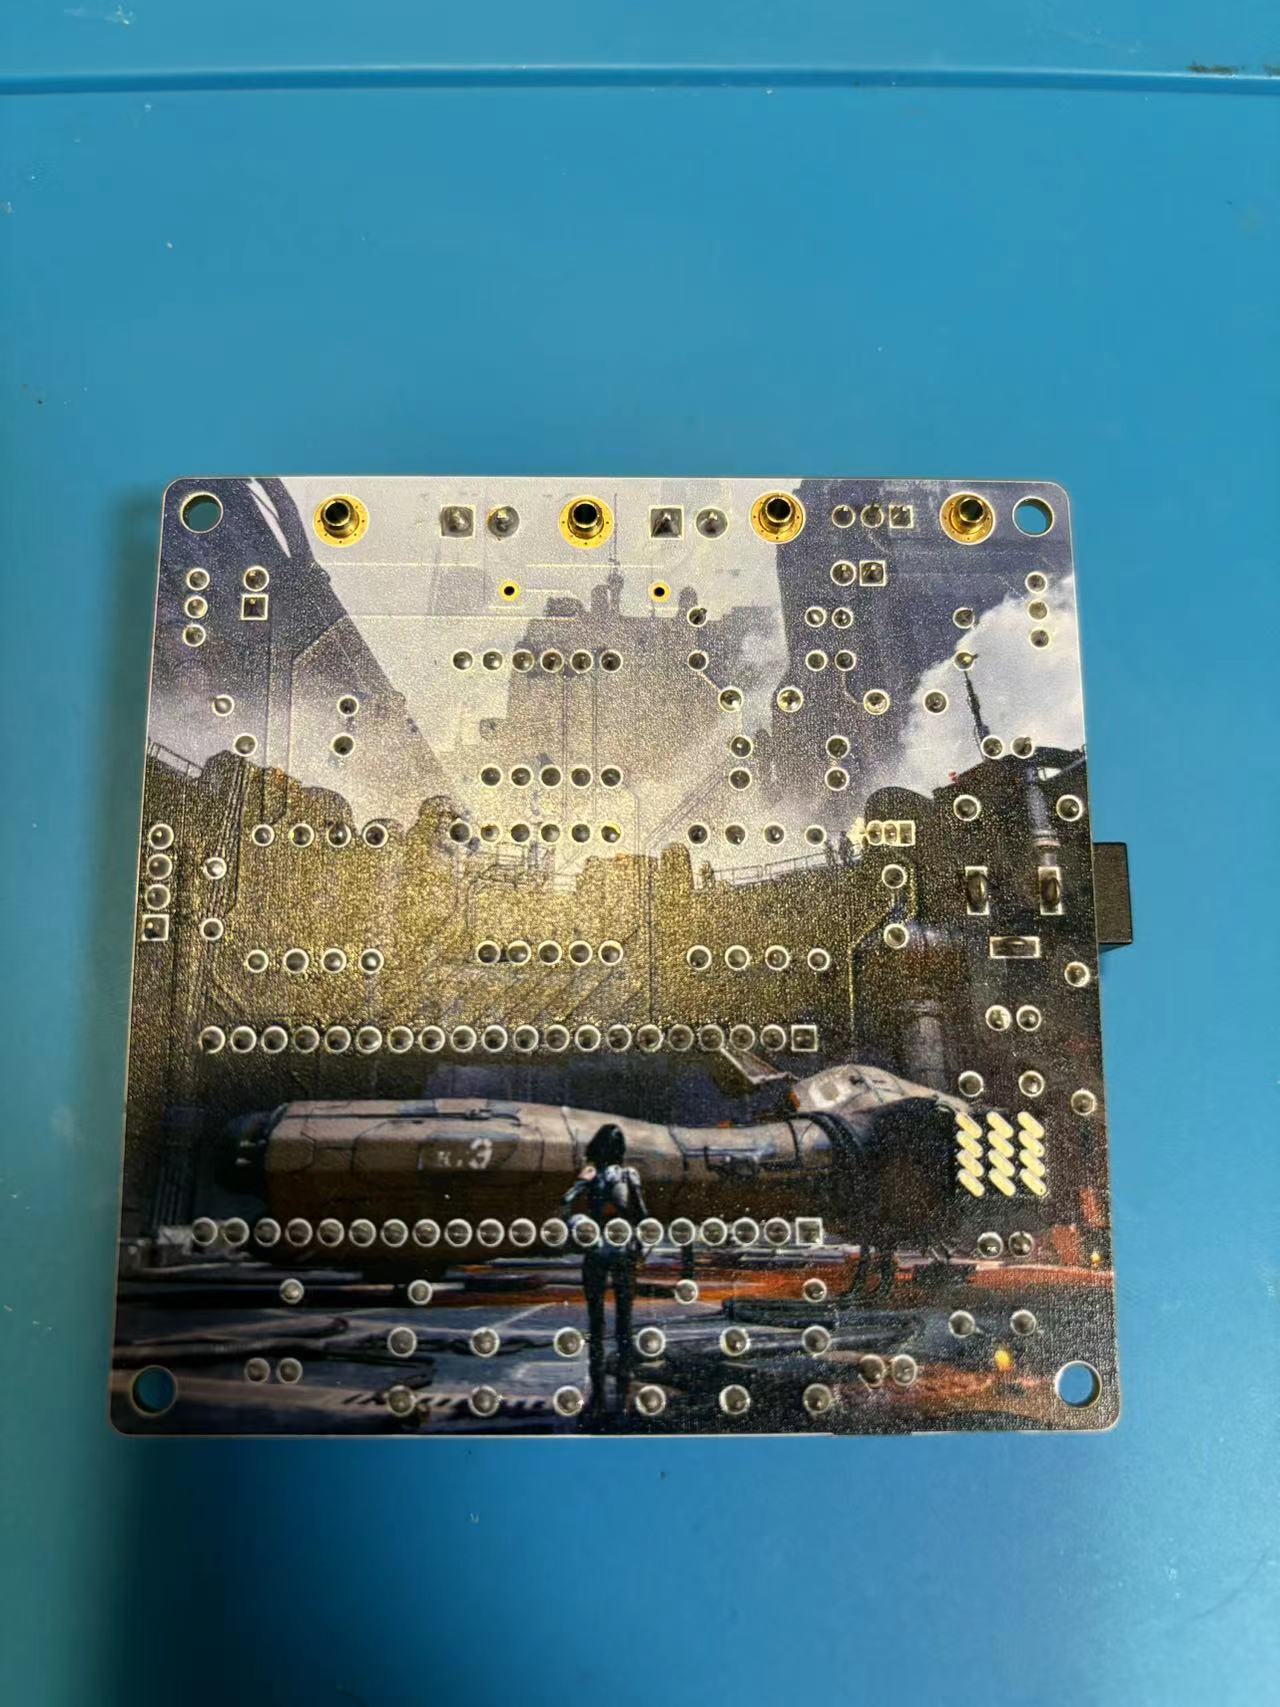
panel verifies
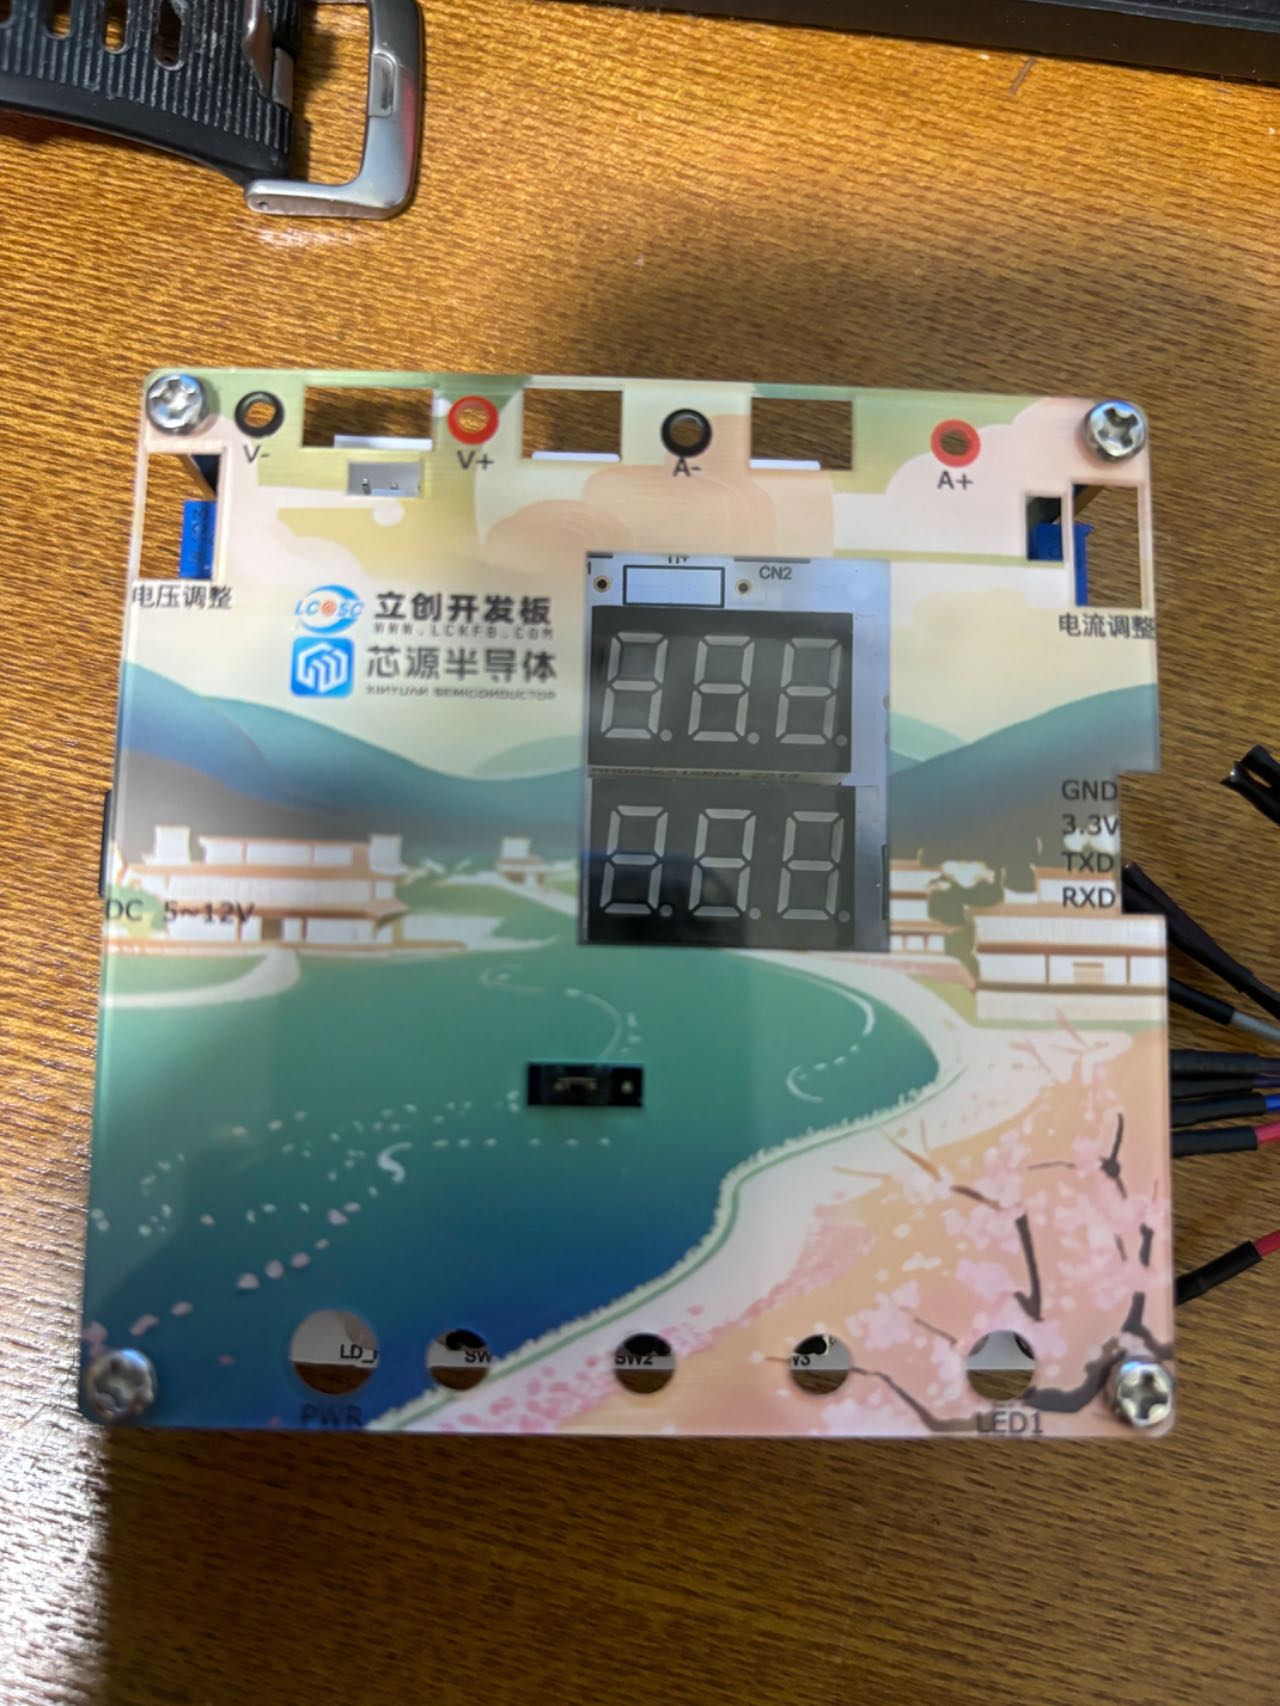
the 3D shell
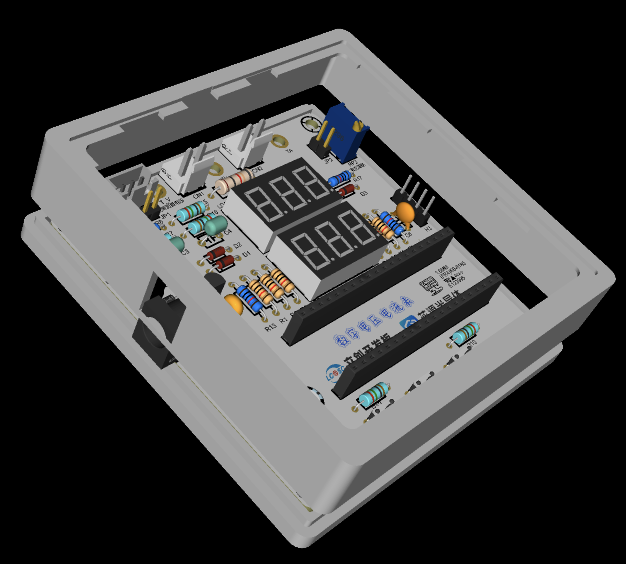
(after installing the panel, it was found that the type-c of the development board protruded. The hole was manually opened and a sticker was applied).
VII. Experimental Process and Verification Diagram
Experiment 1: Lighting up the LED
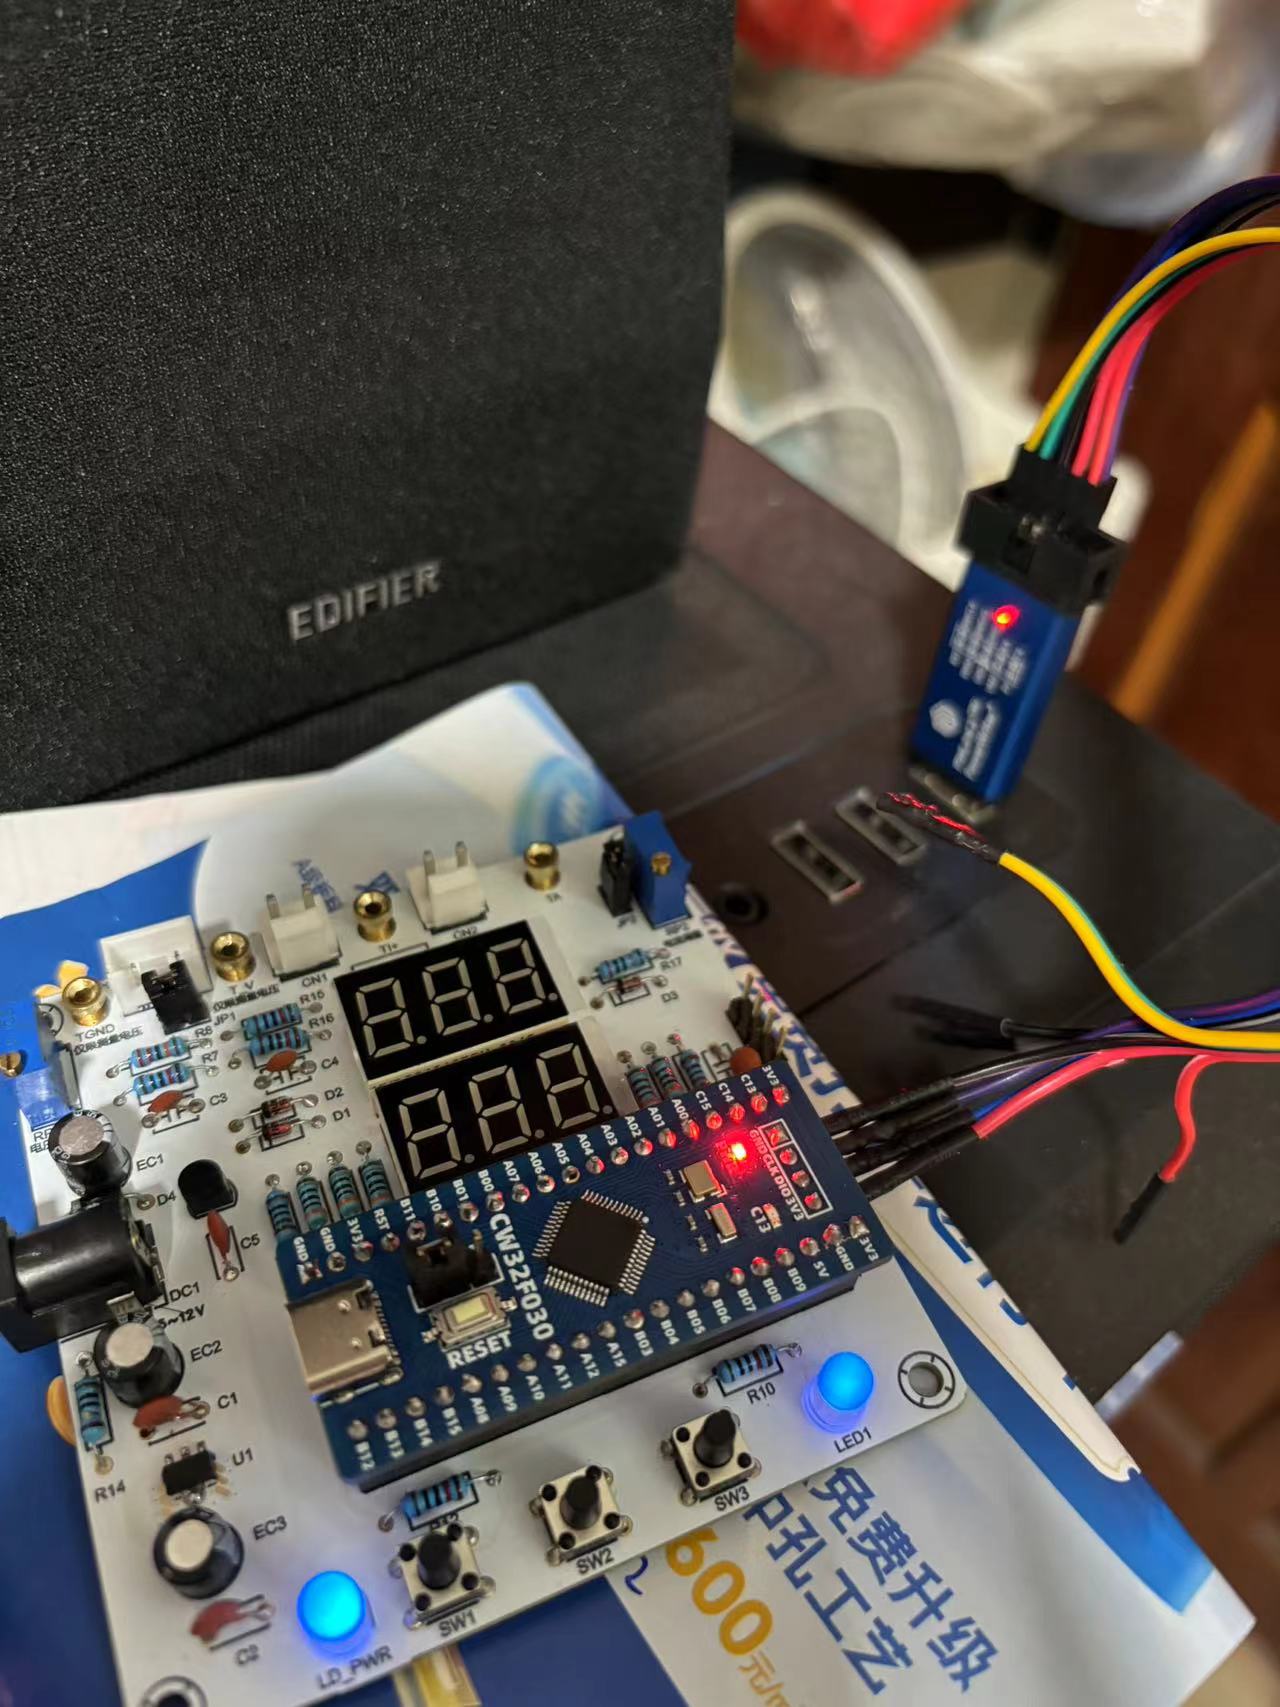
Experiment 2: Button Detection
Lighting up/turning off the LED by pressing the button

Experiment 3: Digital tube displaying numbers / Experiment 4: Digital tube dynamic display
Experiment 5: ADC sampling display / Experiment 6: Mean filtering
The voltage sampled by the ADC is used to simulate voltage measurement by shorting JP2 and adjusting the 10K multi-turn adjustable resistor.
After mean filtering, the value displayed on the digital tube is more stable with less fluctuation.
Experiment 7: Six-digit display of current channel for voltage acquisition
. This experiment uses two digital tubes to display the voltage received through the current acquisition channel.
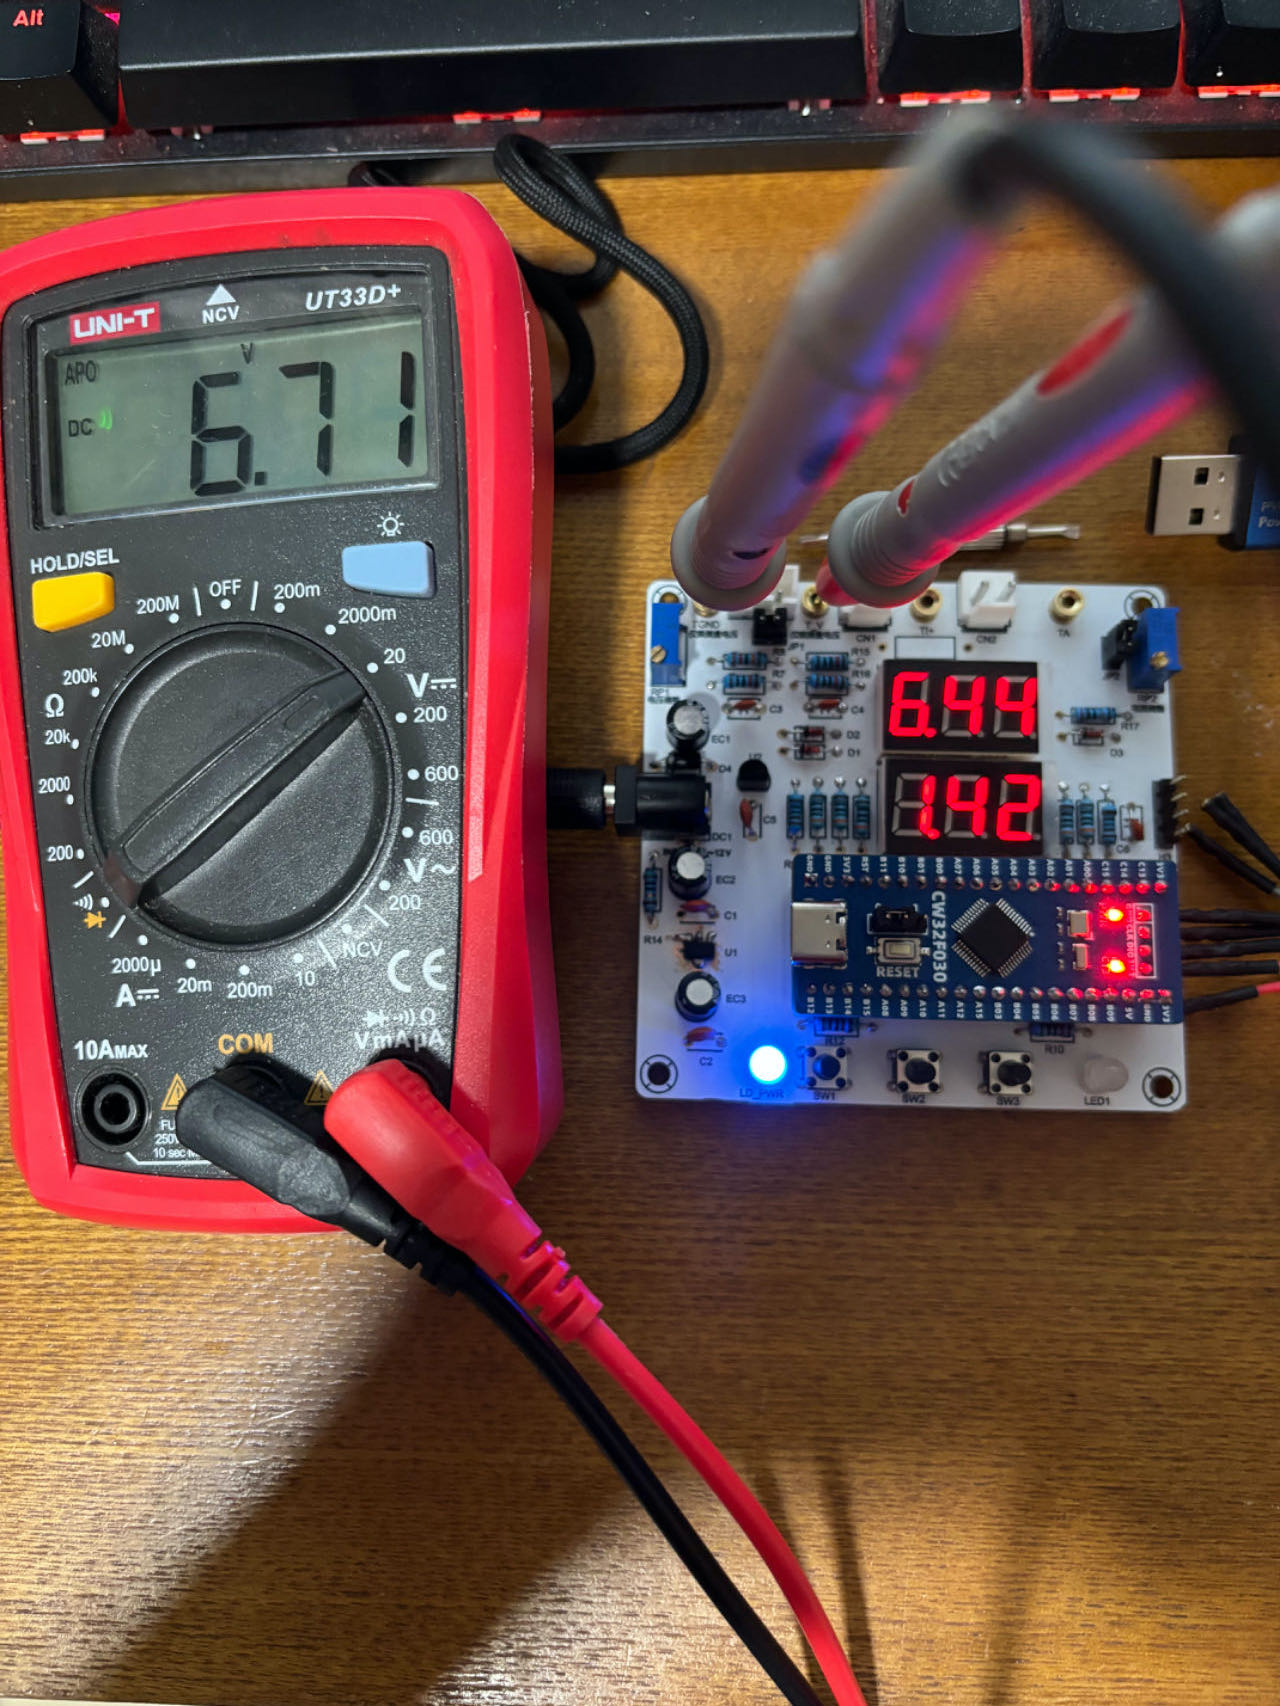
Experiment 8: Simultaneous voltage and current acquisition and display .
Shorting JP2 displays the simulated test voltage and current simultaneously on two digital tubes (it can be seen that the voltage value has a deviation at this time, as it has not yet been calibrated).
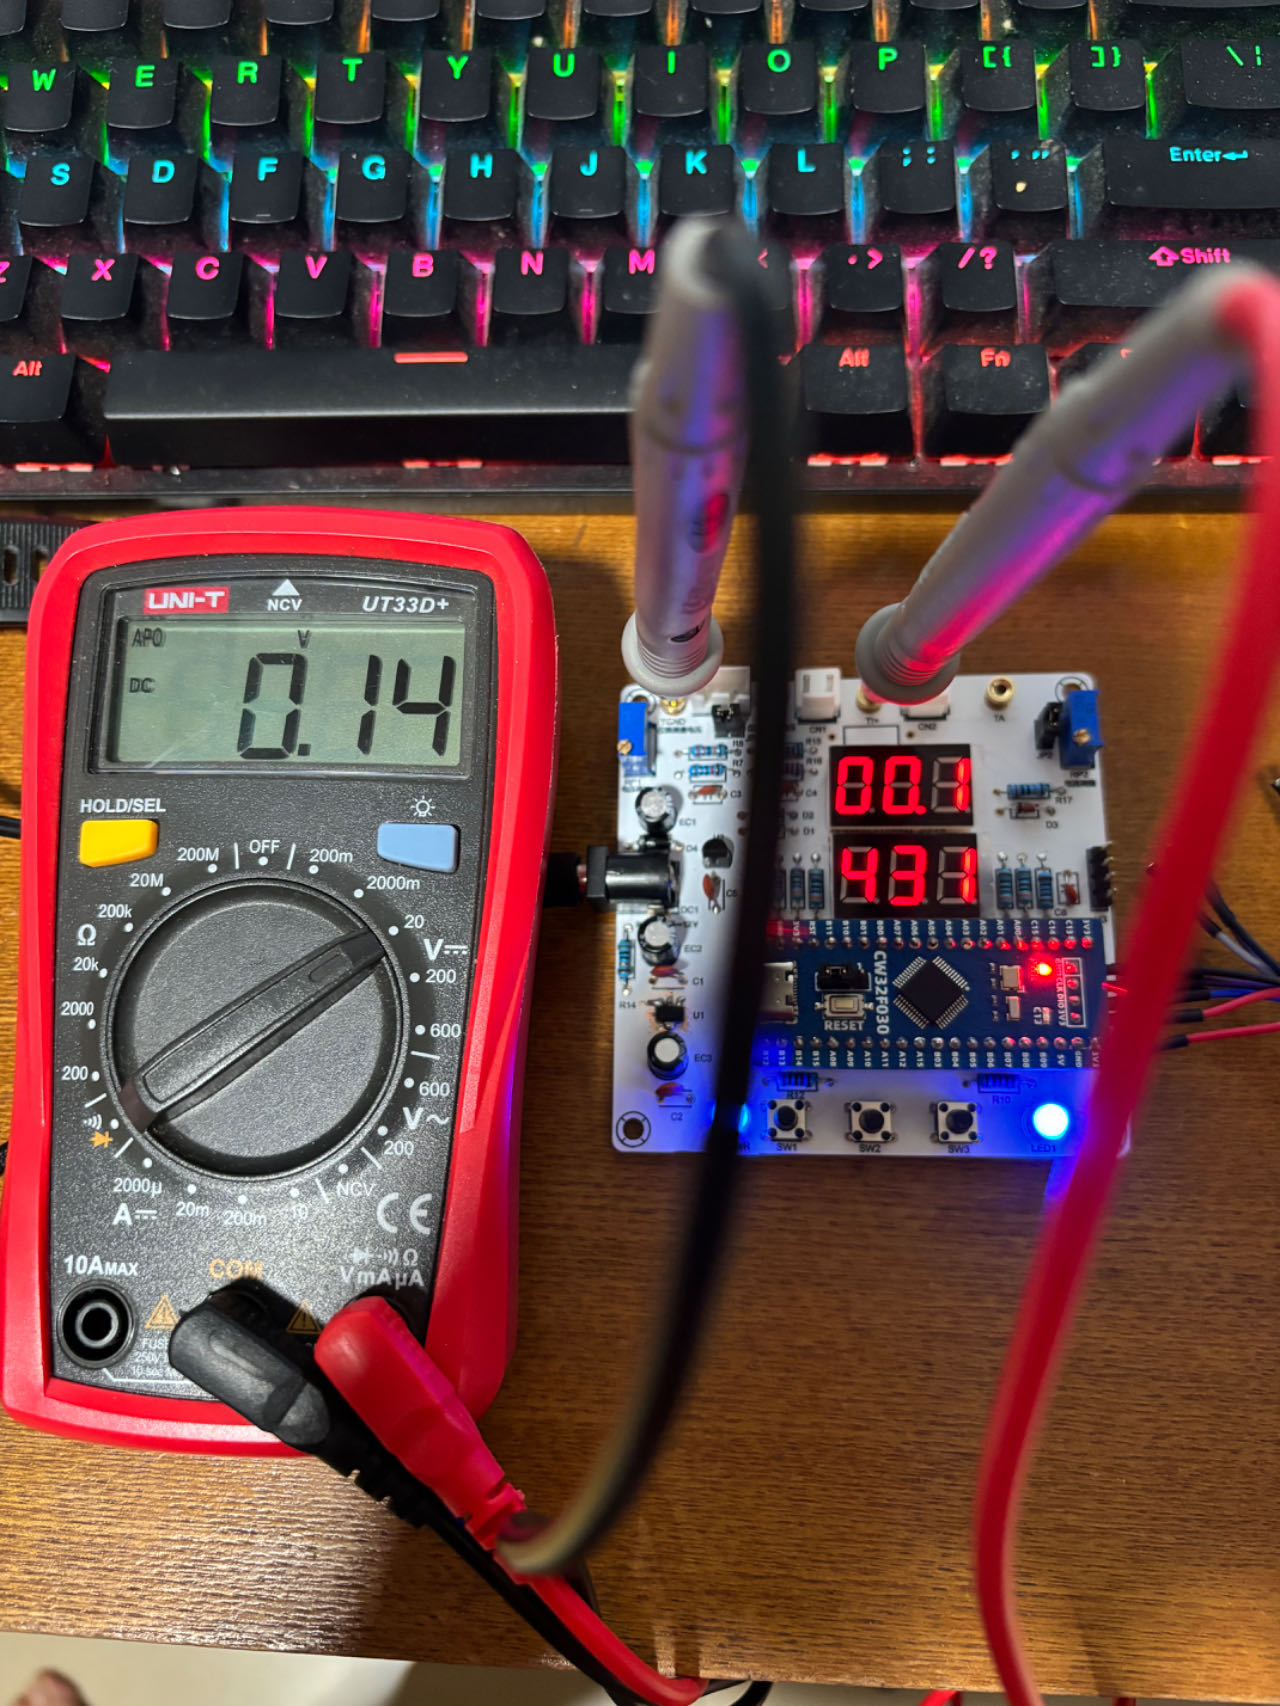
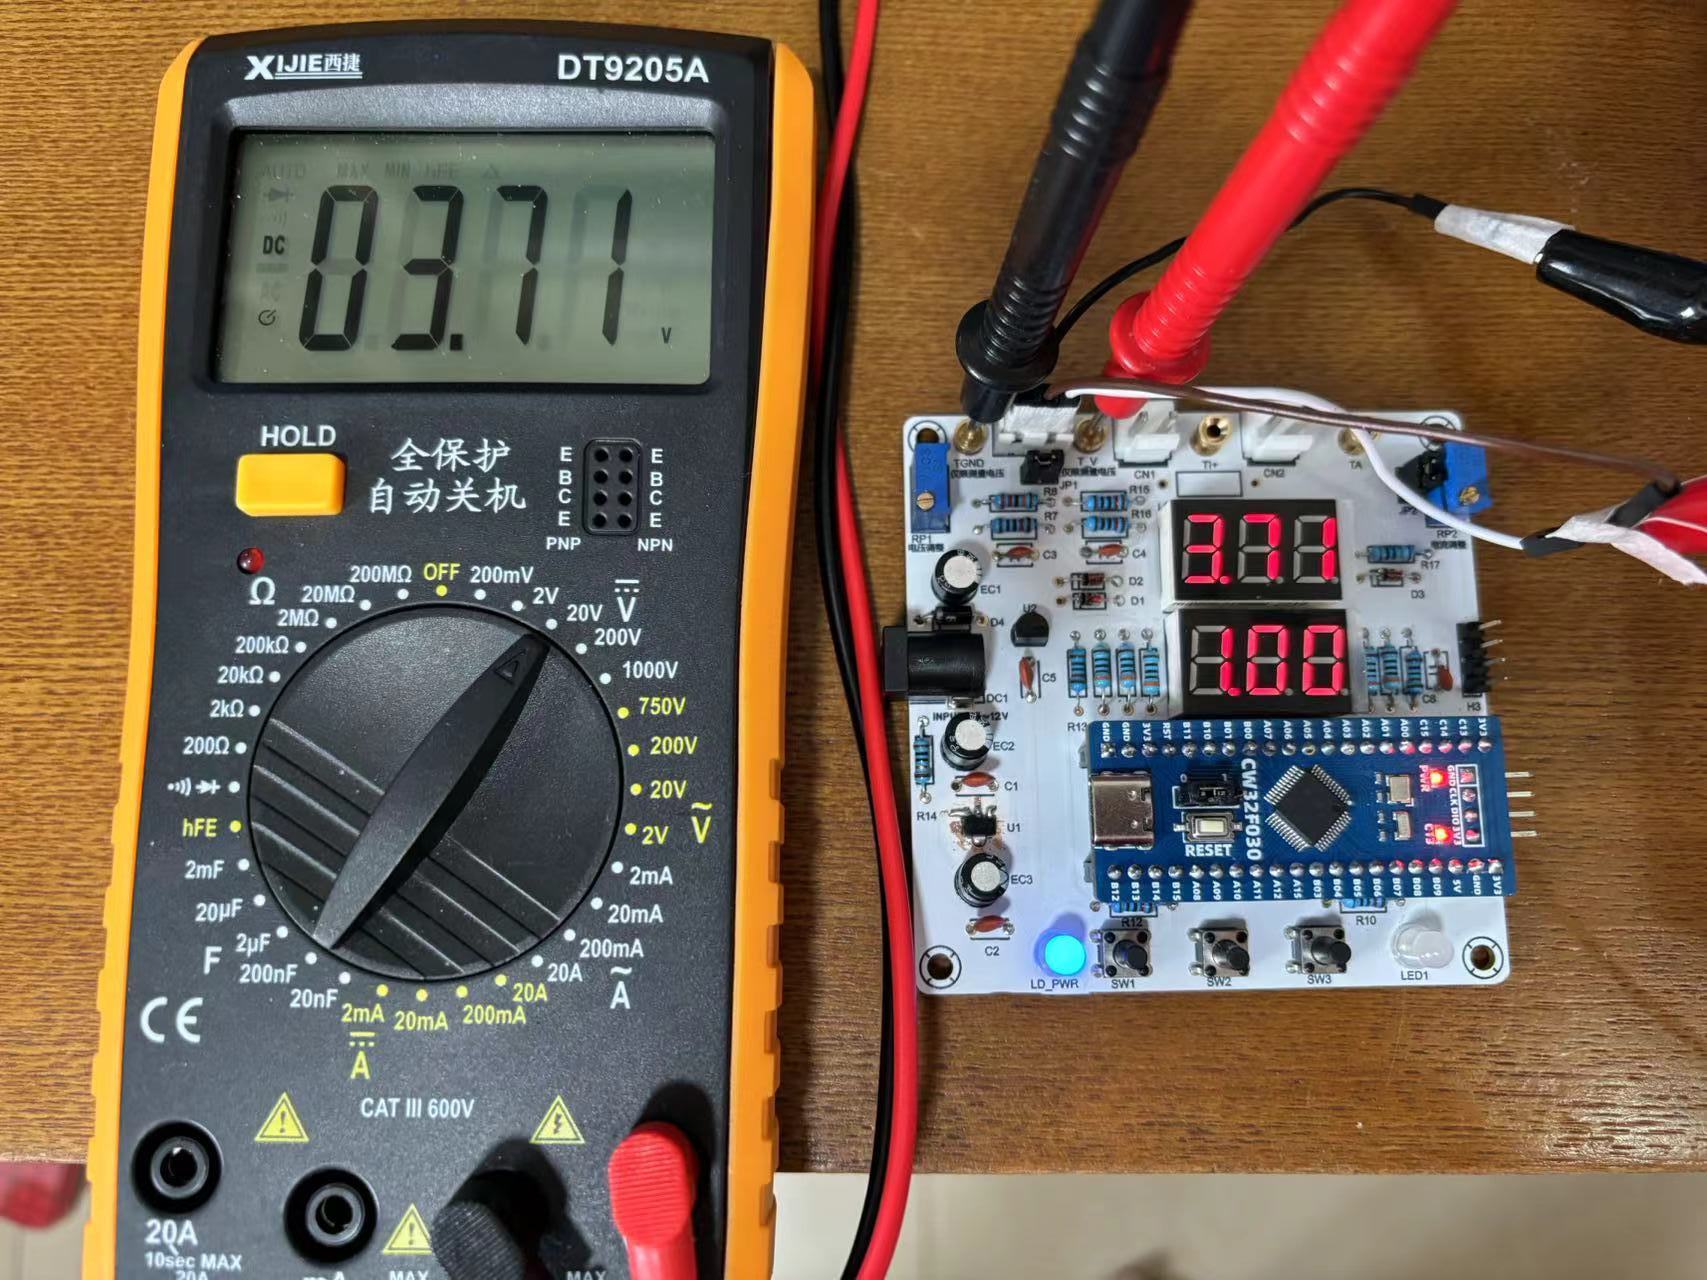
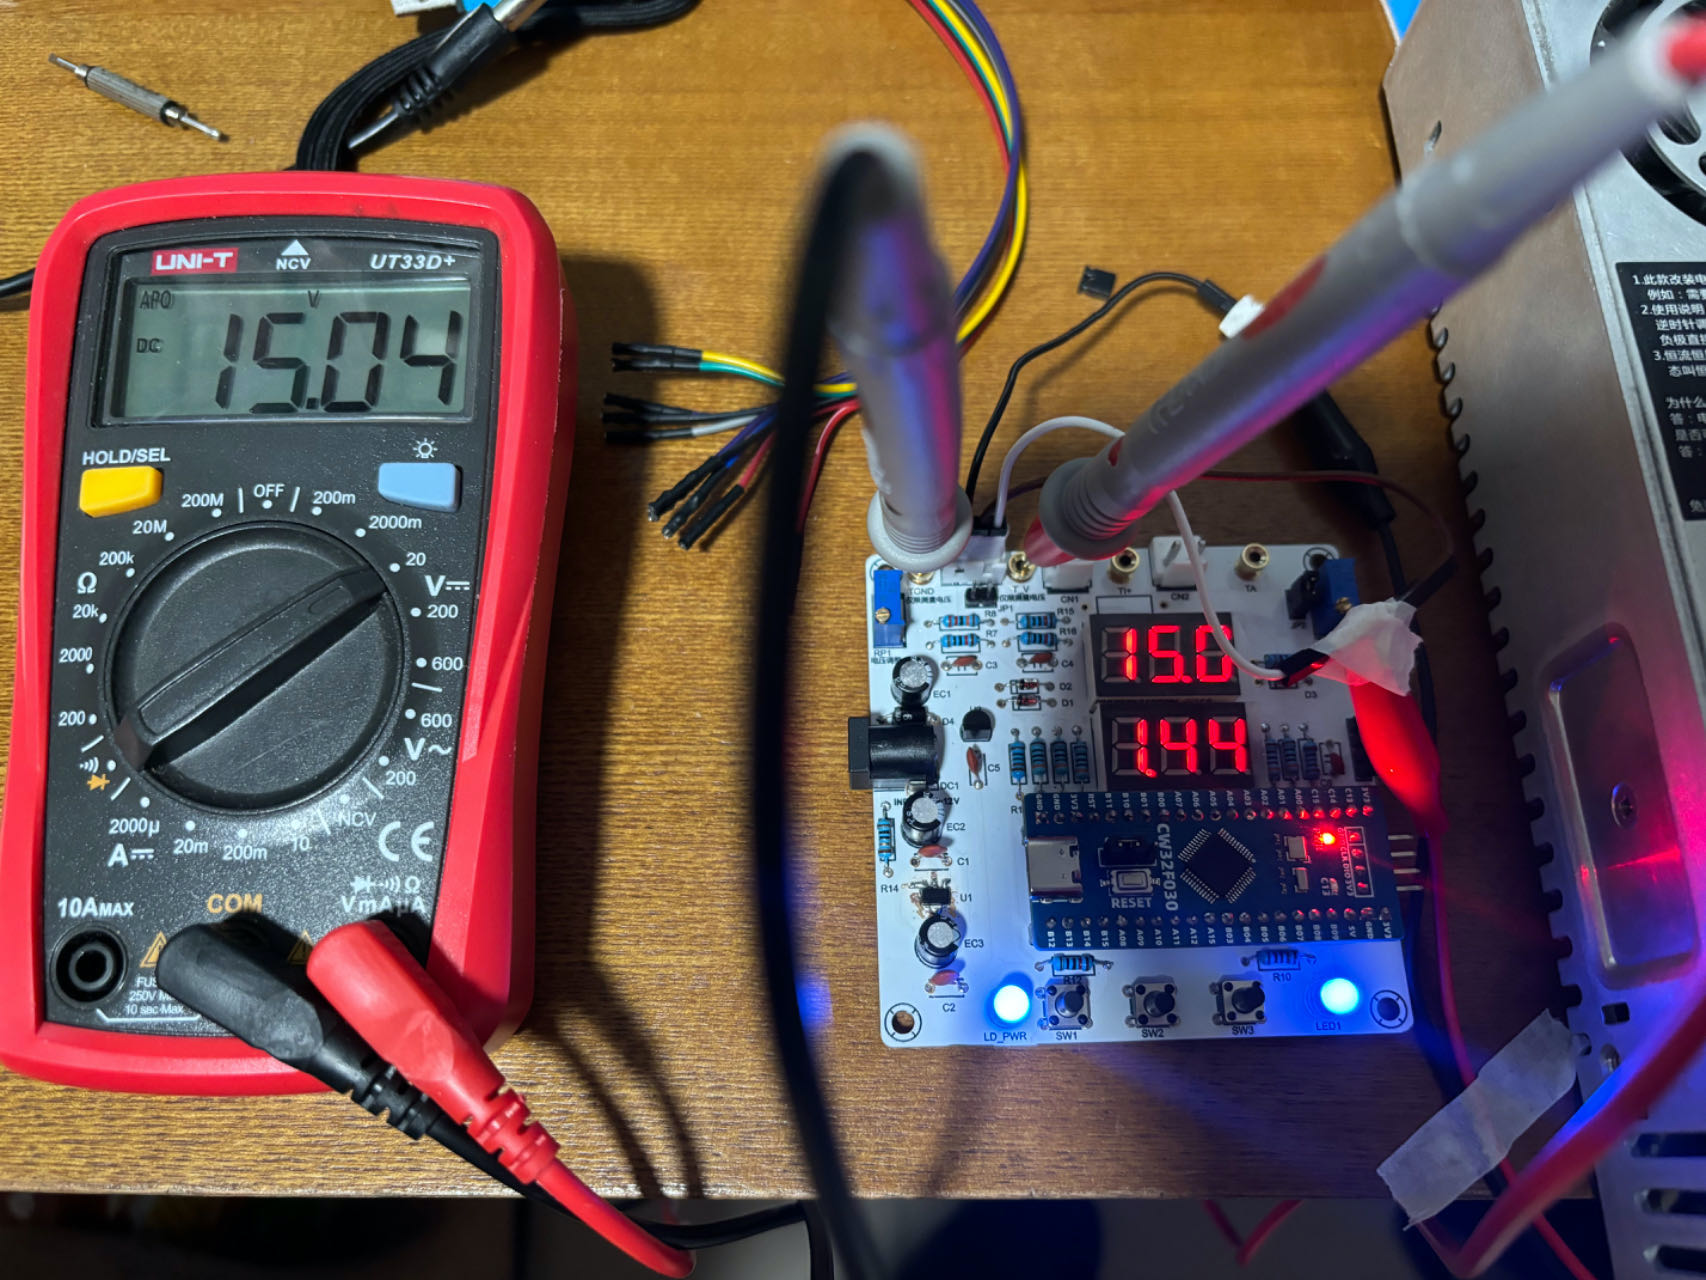
Experiment 9: Digital voltage and current meter with calibration function.
After calibration at 0V (default 0), 5V, and 15V, the deviation is within 0.01-0.02V, which is more accurate than the result of Experiment 8.
VIII. Precautions .
Before powering on, be sure to test for cold solder joints, solder bridges, etc. You can use the buzzer function to test each pin one by one.
IX. Attachments:
Schematic diagram, BOM, PCB design (generated).
Attachment 1: Physical verification video (calibration experiment demonstration.mp4).
Attachment 2: 3D shell file (3DShell_PCB1.zip).
Attachment 3: Project code [Reference Official] (Experiment 9 with calibration digital voltmeter and ammeter code.zip).
PS: Sincere thanks to LCSC Development Board and Sinyuan Semiconductor for providing this training camp learning opportunity.


 京公网安备 11010802033920号

 Y163793R1000F9R