Point Crystal – Portable Multifunctional Test Pen Design Based on CW32F030
Point Crystal: The pen
name refers to the test pen's operation method; simply tap a node on the circuit board to perform a test. Crystal: Transistor, referring to all electronic circuits.

I. Initial Idea
In daily hardware debugging work, the most frequently used instrument is probably the multimeter. Although the multimeter is called "all-purpose," most of the time, the functions we need to use are nothing more than voltage measurement and continuity measurement.
As a "powerful tool" for debugging, the multimeter sometimes has some shortcomings and limitations, such as: its large size makes it inconvenient to carry, it cannot directly reflect the logic level and requires manual judgment, different models of multimeters have different threshold resistances for continuity settings, etc. The most troublesome issue is that the COM probe of the multimeter usually needs to be grounded, but there may not be a direct-plug hole on the PCB to easily fix the probe tip, so it is necessary to manually assist the "black probe," affecting operational flexibility.
Therefore, in 2022 I designed a "logic level test pen" to quickly measure the commonly used 3.3V and 5V TTL levels. At that time, I decided to make an "upgraded version". Time flies and it is now 2023. My idea for this test pen has gradually improved in my mind. With the support of the "CW32 Ecosystem Community", I decided to turn this design into a physical product.
II. Initial Conception
My expectations for this test pen are as follows:
1. Voltage measurement + threshold judgment: The threshold level can be set to meet different logic level scenarios, while retaining the useful traffic light indicator function of the "simple logic level test pen";
2. Continuity measurement: The threshold resistance can be adjusted as needed (this is a feature only found in multimeters costing thousands of yuan, and I want to add it to my test pen);
3. Diode measurement: Measure the conduction voltage and light up a diode (Note! Not a transistor!!!);
4. PWM output: Convenient for providing a known quantity to test the system in some scenarios, and can also be used to test passive buzzers, etc.;
5. PWM input: Can measure frequency (and even perform simple decoding and display of serial port data, although this is not yet implemented due to current technical limitations);
6. DC output: Simulate a required DC level for testing (Thanks to Professor Li for proposing this requirement; I have found it very useful in use).
7. It can be connected to an expansion board for measurement (ideas for expansion modules are also welcome).
I also plan to open-source this project so more people can use it or modify and redesign it according to their needs. Therefore, I have paid extra attention to the following points:
1. Limiting the PCB length to within 10cm, so that everyone can "get" the PCB from JLCPCB for free.
2. All resistors and capacitors use 0603 packages, and LEDs use 0805 packages, making it easier to solder during your own construction (on the one hand, many people find 0402 components difficult to solder, and on the other hand, 0402 components generally do not have silkscreen markings, making it difficult to check if you solder incorrectly).
3. The project will strive to control costs (often, when making things for oneself, one might increase costs for precision or appearance; to facilitate replication of this project, a balance between functionality and cost will be sought as much as possible).
III. Circuit Module Design :
When designing the test pen, I divided the overall design into five parts:
analog front-end
power supply and battery management
, microcontroller and peripheral
display screen , and
human-computer interaction (excluding other interactions on the display screen).
Based on a modular design approach, we can be more organized when drawing circuit diagrams and can roughly distinguish the layout according to modules during PCB layout, facilitating routing and other operations.
The circuit module design in this project is a very common mixed-signal circuit design, applicable to many similar projects.
In the battery management, power supply, and microcontroller circuit modules, this project will strive to adopt standardized designs to improve the readability and replicability of the project's circuit diagrams.
If you are interested in this project, you are welcome to join He Diangong's exchange group 1016193632 (the author's personal group)
to participate in test pen related activities. You are also welcome to join the CW32 Ecosystem Community exchange group: Group 2: 652777214; Group 3: 657586457.
In the following section, I will explain the circuit principle in detail. The information on the replica production required will be at the end of the project.
IV. Circuit Design
We will refine the design of each part according to the requirements to achieve the established goals.
Below, I will explain my design and design ideas in detail with circuit diagrams and PCB.
1. Power and Battery Management
1.1 Charge and Discharge Management
In the charging IC section, I chose the commonly used TP4057 as the main controller. The power input uses the most common Type-C interface. Although a 6-pin interface would be sufficient for this project, a 16-pin interface was chosen for scalability. The SBU1 and SBU2 pins of the Type-C interface were used for expansion board connections. D+ and D- were not used as expansion lines because the device's output signal might cause the charger to misinterpret the signal, resulting in an incorrect voltage and potential danger. This needs to be considered in the design. In

the circuit diagram, you can see that CC1 and CC2 of the Type-C interface are connected to 5.1K pull-down resistors to ground. This is to ensure that the charger accurately identifies the device when using the CC line. If the AC line is used, resistors R2 and R3 do not need to be soldered.
The main parameters of the TP4057 charge and discharge chip can be found in the figure below. In my design, the setting resistor for the PROG programmable constant current charging current setting terminal is 2K, indicating a relatively aggressive charging strategy.

1.2 System Power-On and Power-Off Control Logic
The system power-on logic is relatively complex, but timing information can help in understanding it.

In the diagram above, the left side is the power control section, the middle button is the power acquisition section, and the right side is a five-way joystick switch, with the middle button being the power button.
Note: In an earlier version, I made a mistake; I placed the power detection circuit before the power-on control circuit (before Q1). This caused battery power to be wasted in standby mode. Initially, I thought this leakage current was small and insignificant, as the theoretical calculated value for a fully charged lithium battery at 4.2V is only 210μA. However, I discovered that because this circuit is connected to the subsequent microcontroller circuit, leakage current occurs through the microcontroller, resulting in the subsequent system always having a low voltage of 0.7V.
Below, we analyze the power-on sequence based on the circuit diagram:

① The middle button of the five-way switch is pressed and remains pressed.
② The PW_ON network, pulled high by the battery voltage (BAT+), discharges to ground through D1.
③ The gate of the MOSFET AO3401 (PMOS) is pulled low, Ug.
④ MOSFET Q1 turns on, and the battery output voltage reaches the LDO chip XC6206.
⑤ The XC6206 outputs 3.3V, the microcontroller is powered on, and the KEY1 network is pulled high.
⑥ Since the button remains pressed, the KEY1 network is pulled low, and the microcontroller receives the button press signal.
⑦ The microcontroller calculates the delay; after the threshold time is reached, it controls PW_CT (PF7) to output a high level.
(If the button is released before the delay time expires, the system will power off and will not proceed with the subsequent timing sequence.)
⑧ Transistor S8050 conducts, keeping the gate of AO3401 pulled low.
⑨ PW_CT continuously outputs a high level, the transistor remains on, the system remains powered on, and the power-on sequence is complete
. Once the power-on sequence and logic are understood, the power-off logic becomes simple: when the power-off condition is met (whether by button operation or software control), the program controls the PW_CT pin (PF7) to output a low level, Q1 no longer conducts, the gate of AO3401 is pulled high by R7, the MOSFET also no longer conducts, and the system completes the power-off.
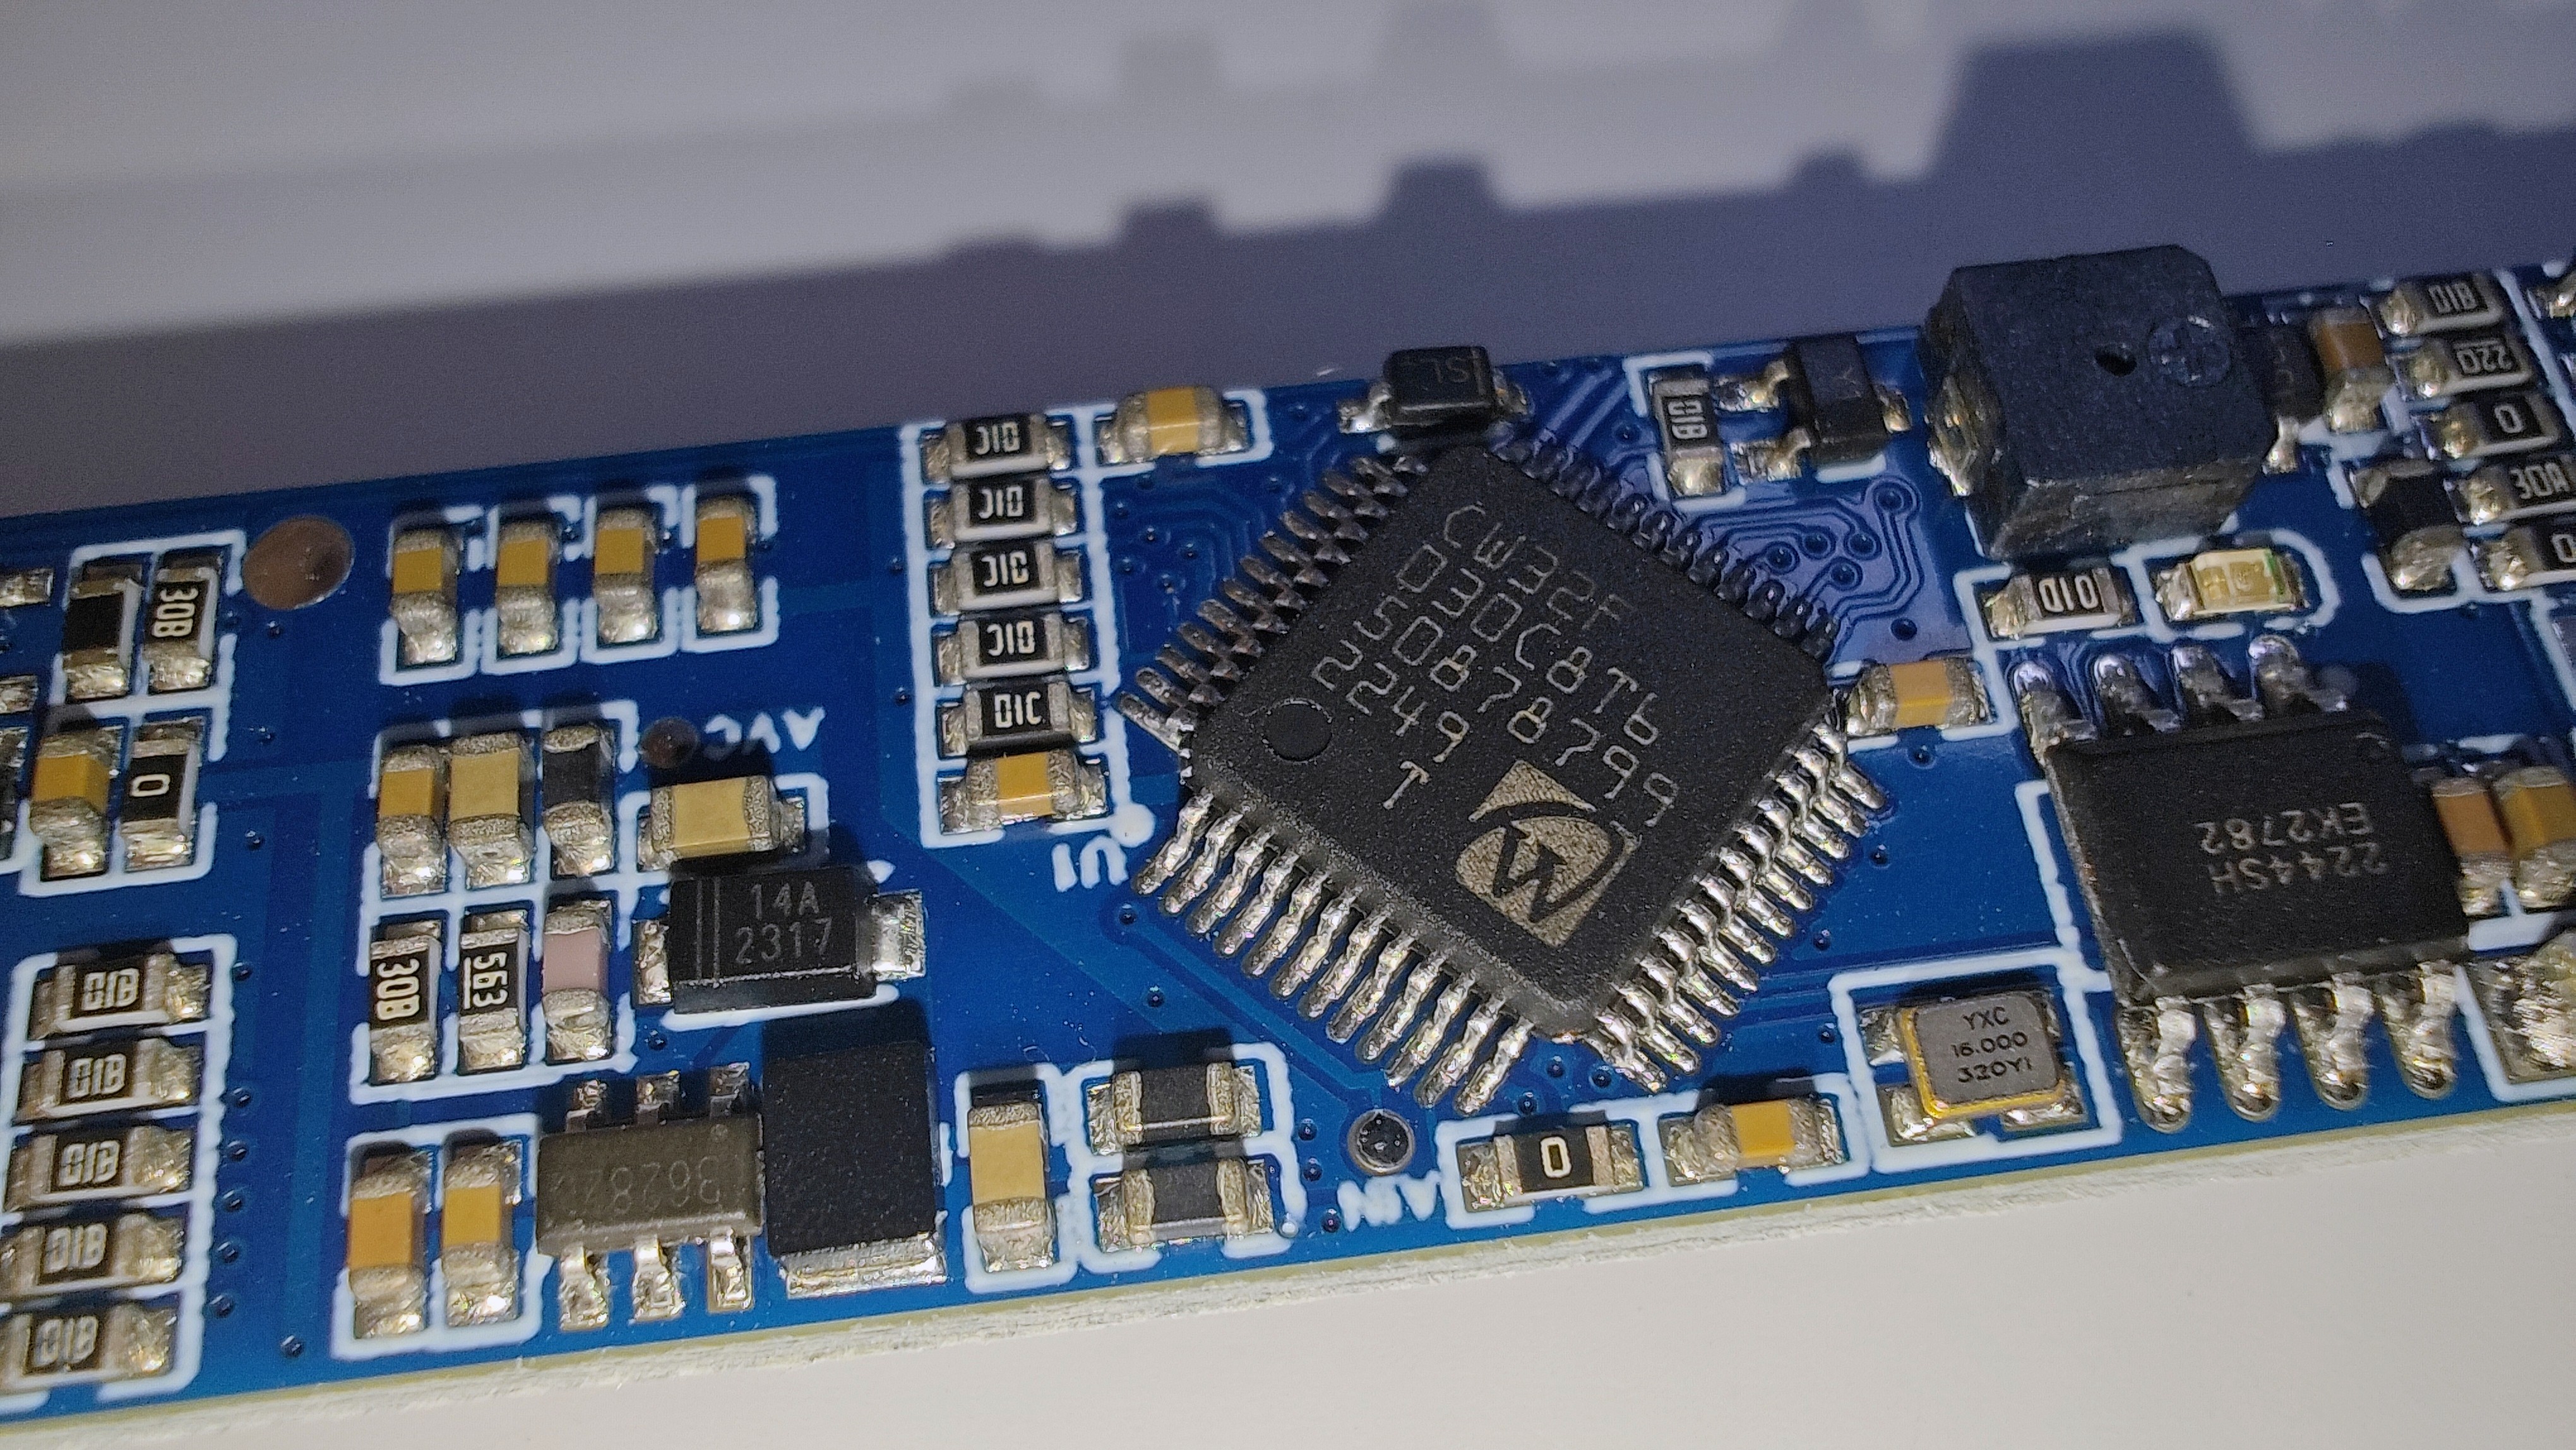
2. Microcontroller and Peripherals, etc.
2.1 The CW32 microcontroller core system
is a standard microcontroller core system configuration. Since this project does not require a high-precision clock and low-speed crystal oscillator for long-term timing, this part of the circuitry is omitted (it is drawn here, but set not to be transferred to the PCB or imported into the BOM, mainly so that it can be directly copied and used in other projects, primarily for a CV engineer).
This project does not use a bootloader for programming, so the BOOT pin is directly pulled low (the standard drawing method can be found in the commented-out section; due to limited PCB space in this project, it is directly grounded). SWD The interfaces are PA13 and PA14, which are brought out through 1.0 pitch headers in this project. However, in actual use, it is not necessary to solder the headers; simply use a probe (an adapter board for probes is provided in the project) to press against the interface for downloading. The header interfaces include SWD, RST, and MCUVCC, facilitating debugging. (The reset button on the PCB cannot be SMT soldered because the surface mount pads and the header through-hole pads are reused, and reflow soldering will cause solder leakage, resulting in cold solder joints or even short circuits! The reset button is designed to be soldered after programming is complete, only when it is certain that no further programming will be performed; it can block the header...) The pin hole (yes, I have OCD) can also be used as a reset button (which seems obvious). Even without soldering, you can use tweezers or other metal objects to short-circuit the RST and GND holes to perform a reset operation.

Regarding I/O configuration, first allocate I/O based on requirements and the microcontroller's pin functions, prioritizing pins that require dedicated functions, such as ADC, SPI, TIMER, and serial ports. Then optimize and adjust based on the layout and routing.
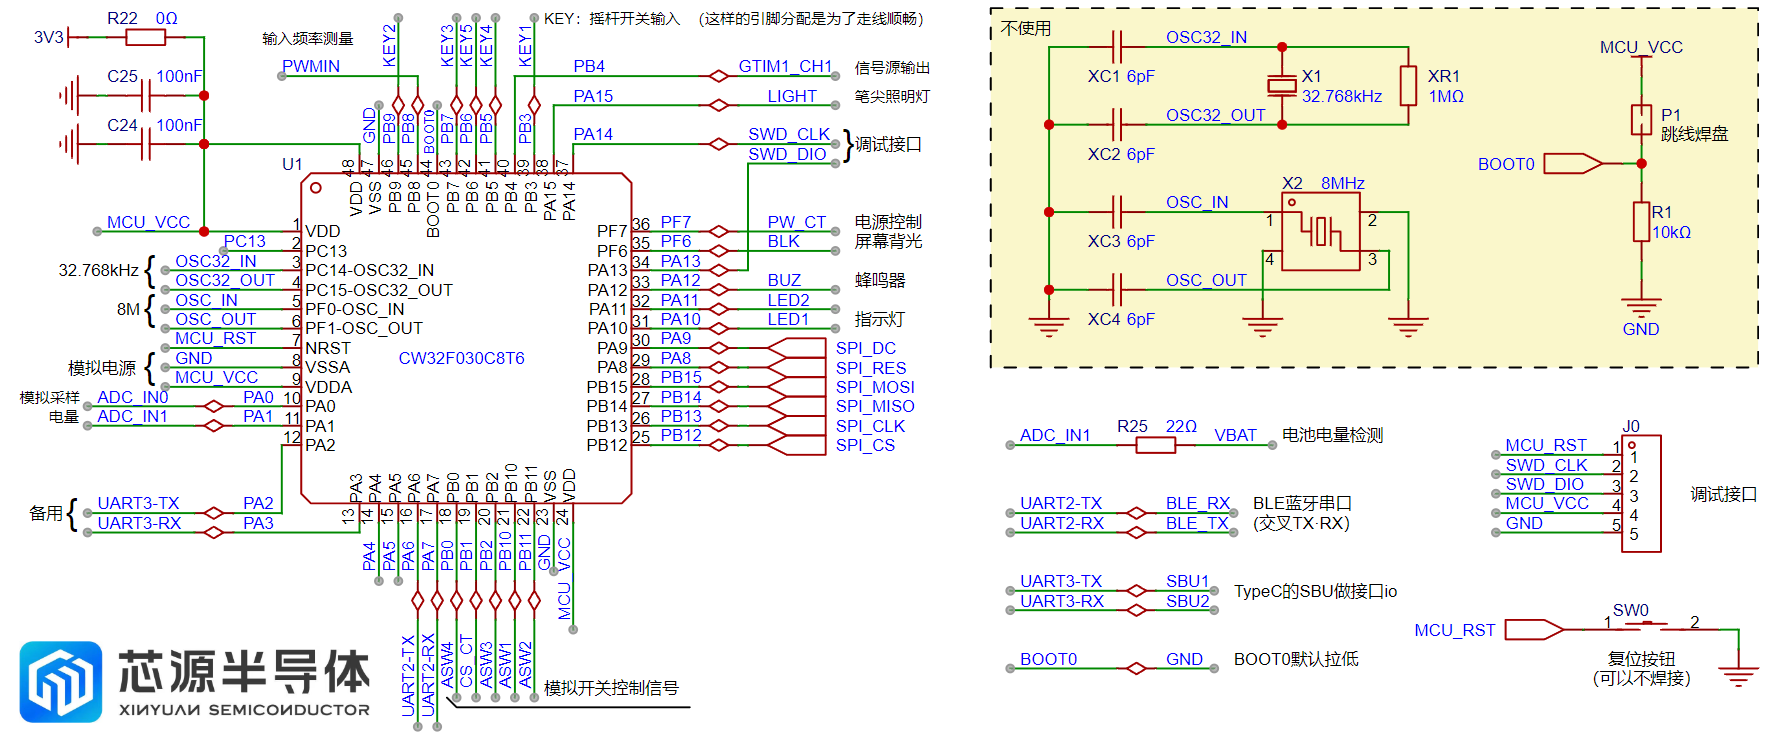
When drawing the schematic, my habit is to directly label the functions used by the I/O next to the MCU pins (placing the network identifiers to be connected), while using Chinese for auxiliary explanations. This prevents conflicts during allocation and allows for quick adjustment of pin assignments, as well as quick identification of the required pins during programming.
Of course, some people prefer to place the assigned pins next to the corresponding blocks, in which case the microcontroller only exposes the network corresponding to the I/O. I personally think this allocation method is more suitable for microcontrollers with a large number of pins (for example, when using RGB or EXMC, their pin positions are often not continuous; labeling the I/O next to the corresponding blocks allows for better pin management).
Both labeling methods have their advantages and disadvantages; choose whichever suits your needs.
2.2 User Input
The user input section of this project uses a five-way joystick switch, which can be understood as equivalent to five ordinary button switches. Programming it is also done as a regular button.
The functions of the joystick switch in different directions will be explained in the program section and will not be repeated here.

Like traditional buttons, a 0.1μF debounce capacitor is used (for peace of mind).
2.3 Display Screen
This project uses a 0.96-inch TFT display screen with a resolution of 80*160. It uses an ST7735 display driver chip and is connected to the PCB via FPC soldering, communicating through an SPI interface.
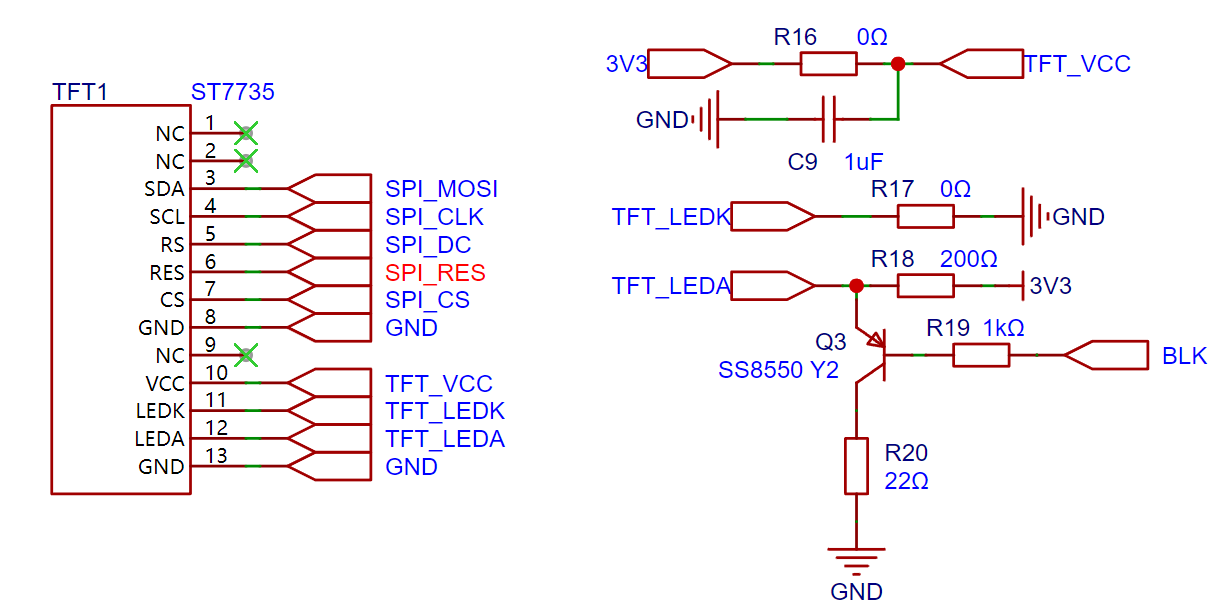
In the circuit diagram above, R18 is the backlight current-limiting resistor. The backlight of the display screen can be controlled by the microcontroller through the BLK network, or it can be dimmed by PWM through program control.

The display screen's performance is shown in the figure above.
2.4 Other human-computer interaction features
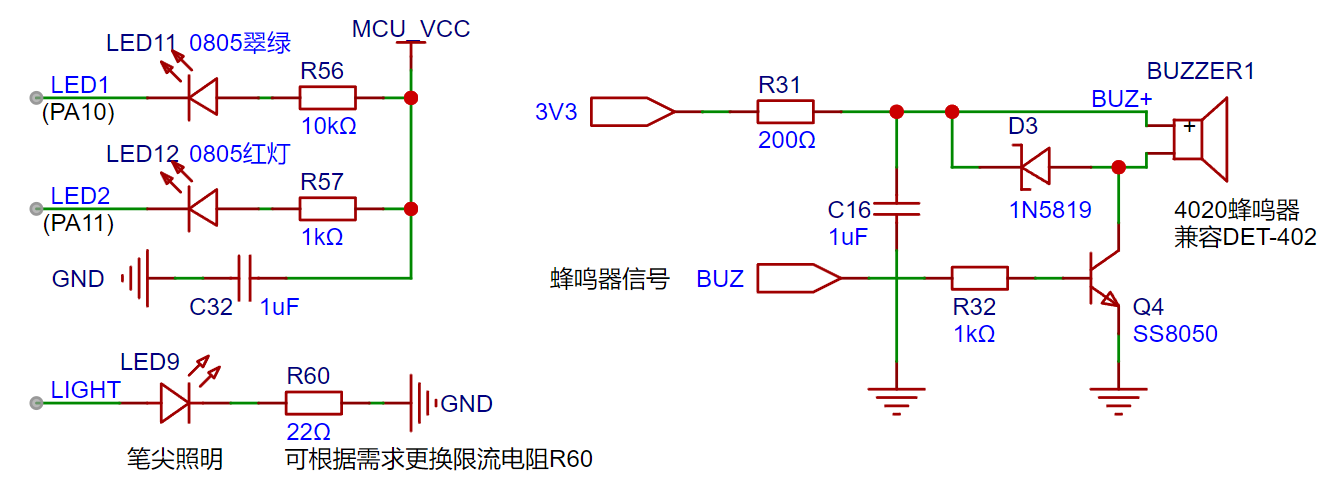
are shown in the image above. The multi-functional test pen has two LEDs, one red and one green, for level indication. Green indicates a low level, and red indicates a high level (pay attention to the LED color during soldering). Both LEDs are connected to the MCU in current-sinking mode (note: the LEDs and the display screen work simultaneously; the LEDs act as quick indicator lights, allowing users to quickly determine the current status using peripheral vision).
A passive buzzer is used for additional indication (such as continuity testing) to enhance user perception. It's important to note that a passive buzzer is used here; an active buzzer cannot be used (given the small size, conventional active buzzers are not available).
Note that a 200Ω resistor is connected in series in the buzzer power supply to limit the current. If you find the buzzer too soft or too loud in actual use, you can replace this resistor, but the resistance value should not be too small, otherwise excessive current will pull down the system voltage, causing malfunctions!
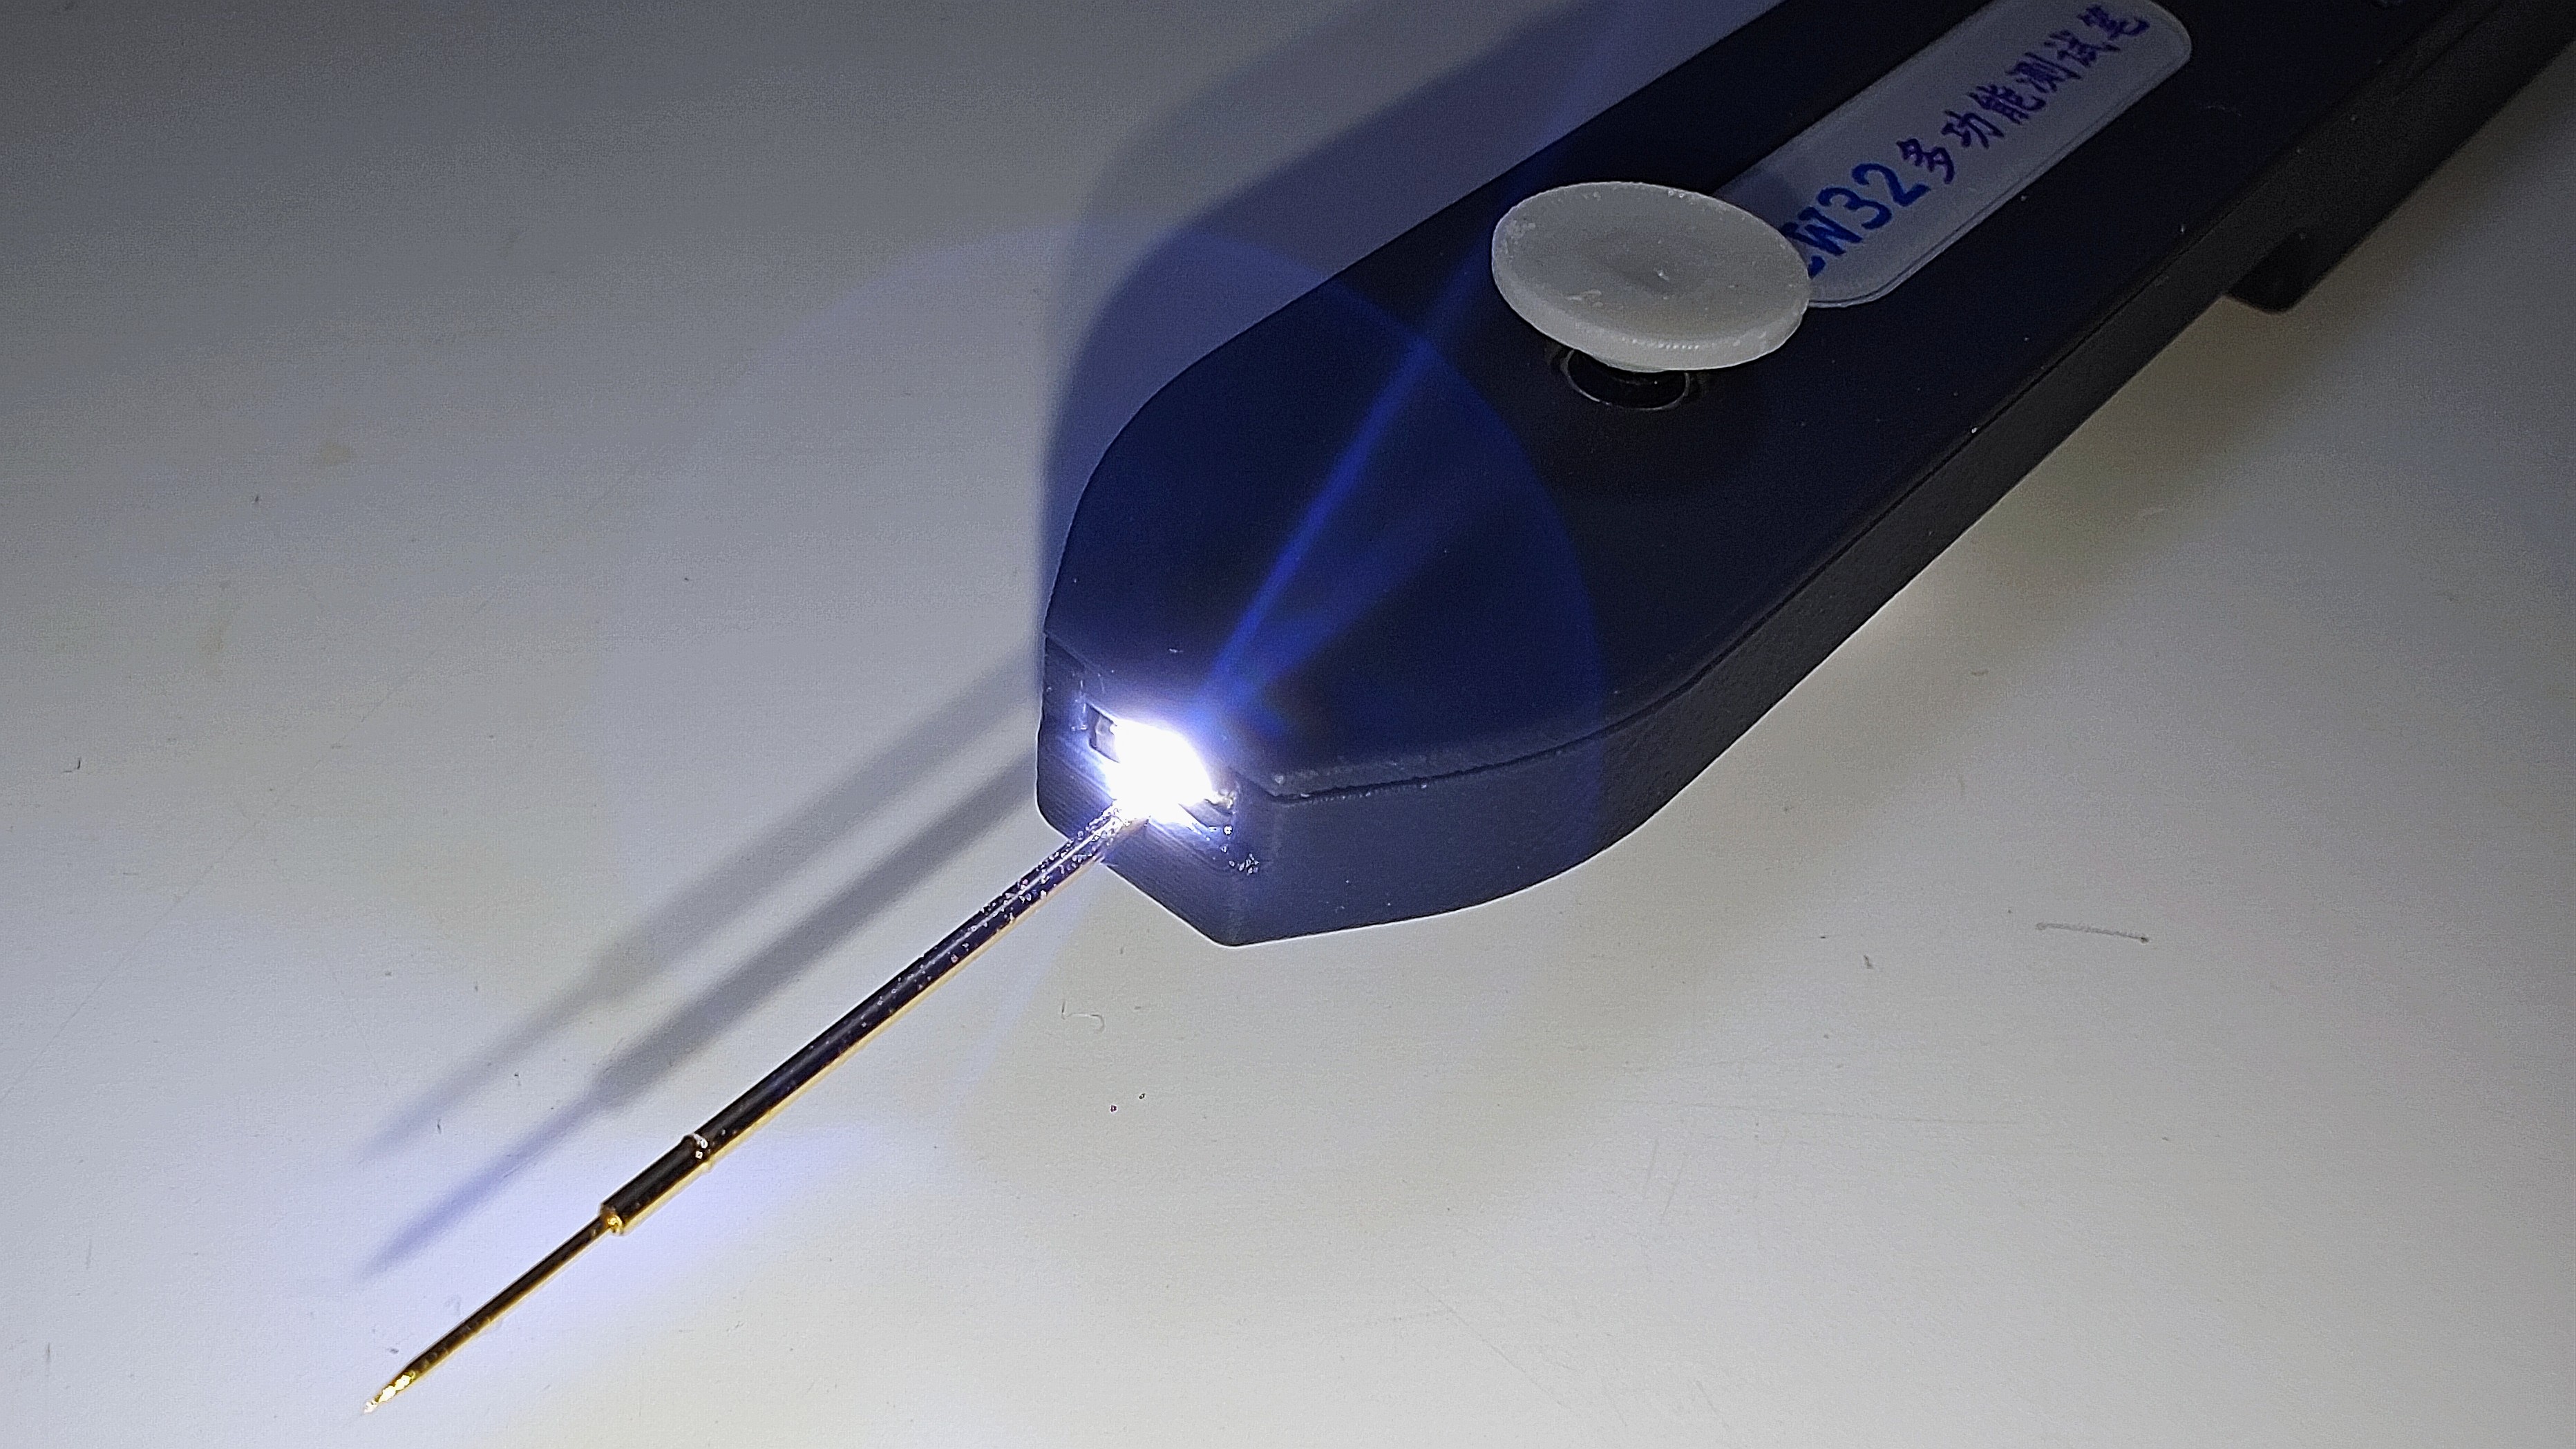
There is also a side-mounted LED as a pen tip light, convenient for testing in dimly lit environments such as inside the casing. The current-limiting resistor can be replaced to adjust the brightness as needed.
2.5
To facilitate connection between the test pen and a computer or mobile phone, I chose to use Bluetooth BLE technology for wireless data transmission. The
main reasons for not using the more common CH340 serial-to-USB adapter for direct connection are as follows:
① The data cable has a certain weight and rigidity, making it less flexible to operate while wireless;
② It is not recommended to use the device with the data cable plugged in, as this will cause the test pen's floating ground to become grounded, potentially causing a short circuit during testing (the specific reasons will be analyzed in the analog circuit section);
③ Most importantly: safety! If an operational error causes the test probe to input a high voltage, and the protection circuit fails, causing the microcontroller to burn out, this high voltage could potentially travel along the data cable directly to the phone or computer, causing serious damage!

When selecting a chip, I chose the KT6368A, a BLE/SPP dual-mode chip based on the JL AC6368A. This chip supports Bluetooth 5.1, and more importantly, it doesn't require a start-up capacitor when using a crystal oscillator. Other peripheral circuits are also extremely simple, helping to save valuable space on a crowded PCB.
In my design, I equipped this chip with indicator lights and an external antenna. Not mandatory. If you want to reduce material costs, Bluetooth can still guarantee a stable signal connection within a range of about 2 meters without soldering an antenna (this data is for reference only because everyone's environment and equipment are different).
This Bluetooth chip can connect to a computer and generate a Bluetooth serial port. According to the test pen's design, after entering level detection mode, it uses the serial port to transmit the acquired level data via Bluetooth. The data format uses the FireWater data format from the VOFA+ software, so curve plotting can be performed using the VOFA+ serial port monitoring software.
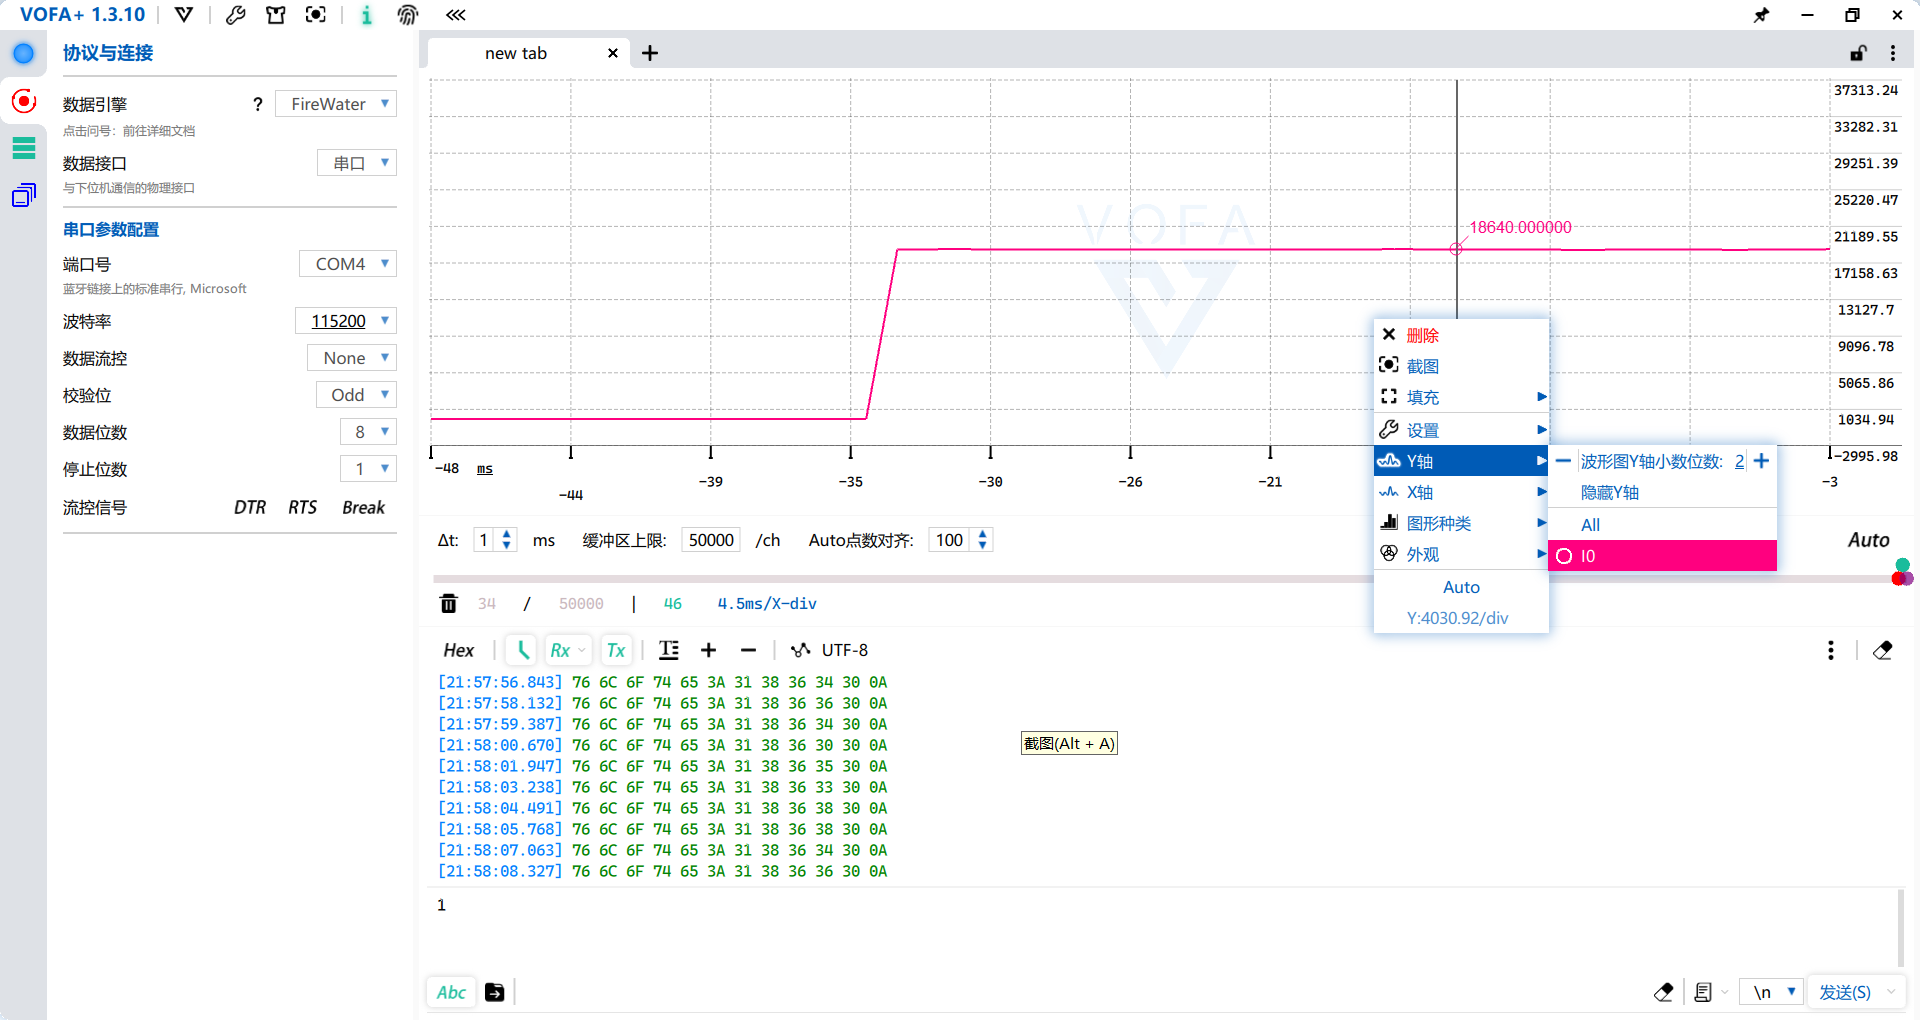
Note: For detailed data format instructions, please refer to: FireWater | VOFA-Plus Host Computer

. This function allows for long-term monitoring and acquisition of the target voltage, and analysis using the curves generated by the host computer. Users can also write software according to their needs to suit more scenarios, giving the test pen more functions.
3. Analog Front End
As we all know, the analog front-end is the analog circuit that precedes the digital circuit (something seems off, but it makes some sense). Okay, enough joking. By definition: AFE (Analog Front End) processes the analog signal from the signal source and digitizes it. Its main functions include: signal amplification, frequency conversion, modulation, demodulation, adjacent channel processing, level adjustment and control, and mixing.
Now that you know what the analog front-end is, let's build a 10G oscilloscope (
3.1) . While this project isn't about building a 10G oscilloscope (and I can't build one right now), the basic
design principles for analog front-ends are similar: what kind of signals will I be acquiring, and what kind of signals will my device be acquiring? To illustrate, imagine I can hear English, but I only understand Chinese. Therefore, I need a translator, which is what we call an "analog front-end."
Returning to the test pen project, my system design goal is to acquire signals from 0 to +15V and output signals from 0 to +5V. That's the most basic goal, quite simple, isn't it?
However, this project has a special case: I want to achieve all input and output functions on a single probe (I'm clearly a demanding client), which requires consideration of input, output, and other factors. Switching is then necessary. At this point, some clever developers might immediately think of a relay. Yes, relays are indeed very useful in this scenario, but they bring another problem: size. Since this project is a portable test pen, I naturally don't want to make the device too large (it's inconvenient to use). Therefore, relays are not suitable in this situation. Thus, we need to introduce another switch: an analog switch.

Analog switches have existed since the early 74 circuits. They have relatively high internal resistance (this description might not be entirely accurate; more precisely, they are on-resistance). However, with increasingly sophisticated devices, low-resistance analog switches have emerged, with internal resistances as low as mΩ. In this project, because the input voltage is relatively high, and the through voltage of low-resistance analog switches is relatively low, the relatively "old" 4053 chip was chosen. It is an SPDT, 3 The channel analog switch, with an operating voltage of up to 20V, perfectly meets the requirements of this project. At this point, some observant students may notice its relatively high internal resistance, reaching 200-240Ω. Will this affect the system accuracy? The answer is yes, but as this project is a simple portable testing tool, the impact of the analog switch's internal resistance is negligible. Furthermore, the DC bias introduced by the analog switch itself can be corrected through calibration (this project does not include advanced functions such as multi-point calibration, but it does include short-circuit calibration, emphasizing simplicity and ease of use).
3.2 The analog power supply
we selected, the HT4053A, has a maximum operating voltage of 18V. To allow for some margin, I designed the system voltage at 17.5V. Since the front-end voltage is directly powered by the battery (approximately 4.2V~3.5V), we need a boost converter to power the analog front-end.
For chip selection, I chose the commonly used MT3608 chip. Its 2A output current is sufficient, and its relatively high switching frequency of 1.2MHz also helps with subsequent filtering. The boost inductor is a 4.7μH inductor in a mini SMD252010P package (2.5*2.0*1.0mm), which helps save PCB area (and looks better). Despite its small size, it has a rated current of 1.6A and a saturation current of 2A, which is sufficient for the system. While the voltage divider resistor configuration may seem arbitrary, there are certain considerations. An inappropriate configuration will affect the power supply's output voltage ripple and load regulation performance, but due to space limitations, this will not be discussed further here. Further details are omitted; interested students can consult relevant materials for further study.
It's important to note that this project does not use dual power supplies; there is only a positive power supply and no negative power supply. Therefore, the test pen can only input/output positive voltage signals. If a negative signal input is required, the subsequent circuitry will need modification. Due to size considerations, a single power supply solution was ultimately chosen for this project.
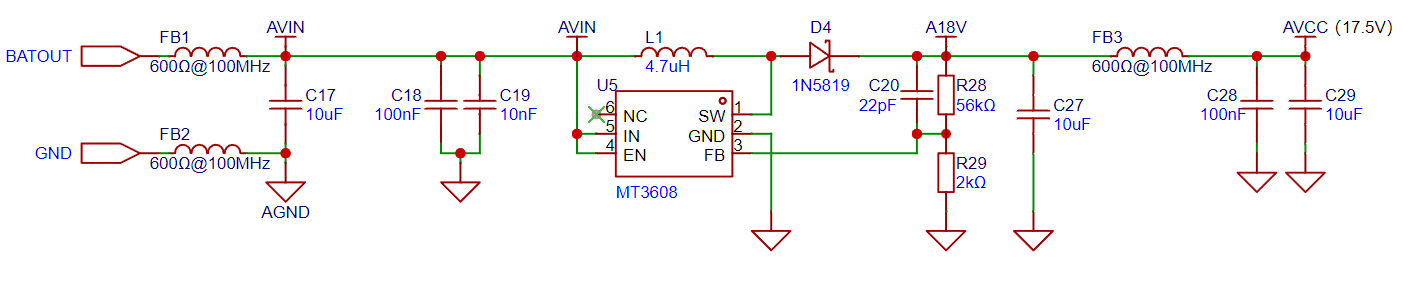
Since switching power supplies introduce interference, and analog circuits are also subject to various types of interference, a ferrite bead was used for isolation between the digital and analog power supplies. This also facilitates single-point grounding.

The red box shows the analog front-end power supply circuit, providing an AVC test point for quick voltage measurement. The left side of the diagram above shows the analog front-end; above the middle button is the power circuit; below the middle button is the button debounce capacitor; and the right side shows the digital circuitry. The copper foil on the ground plane is slotted for isolation, and the current return path has been optimized.

The ground plane and return path design can be seen in the diagram above (front of the PCB).
3.3
Are you feeling sleepy after reading so much about the signal input circuit ? Don't worry, the main course is just beginning: Signal Input Conditioning Circuit:

The diagram above shows the most basic signal input circuit. First, a bidirectional TVS diode protects the subsequent circuitry. Then, the signal can be selected as either input or output mode via analog switch 3 (COM3 and NC3, NO3) (default output mode). Analog switch 2 allows selection of whether the input signal is attenuated. The analog front-end design is inspired by an oscilloscope, with an input impedance of 1MΩ. Like an oscilloscope, it allows selection of X1 and X10 ranges, with X10 selected by default. This design maximizes the safety of the subsequent circuitry, acting as if there were an independent... When storing a multimeter with a power button, the range should be set to "AC voltage, maximum range," similar to how

the TVS diode (highlighted in red in the image above) should be placed closest to the input during PCB layout (if other protection devices are present, the PCB layout needs to be carefully considered) to better protect subsequent circuits. The

signal then passes through a voltage follower for impedance matching, a low-pass filter to filter high-frequency noise, and finally a clamping diode (OUTA_0 network) for voltage limiting protection before being input to the microcontroller's on-chip ADC.
It's important to note that it's not recommended to directly connect capacitors to the operational amplifier output, as this can easily cause... Due to oscillations and other factors, a small resistor is needed. Although the resistor and capacitor together form an RC low-pass filter, based on my RC selection, its single-stage cutoff frequency at a 6dB descent rate is calculated to be 723.7985kHz, therefore it will not affect the normal measurement of the test leads.

The diagram above shows the clamping protection circuit. The designed clamping voltage is obtained through power supply voltage division, and then a voltage follower is used to give it the ability to absorb voltage. It should be noted that because the diode has a forward voltage (typically 0.35V for this protection diode), the voltage of the voltage follower should be appropriately lower than the protection threshold voltage. In this design, a voltage of 3V is used, plus the 0.35V of the diode, to reduce the protection threshold voltage. The protection threshold is set at the maximum input voltage of the microcontroller's ADC, 3.3V (in fact, the CW32 microcontroller generally won't be damaged even with a 4V input ADC when operating at 3.3V).
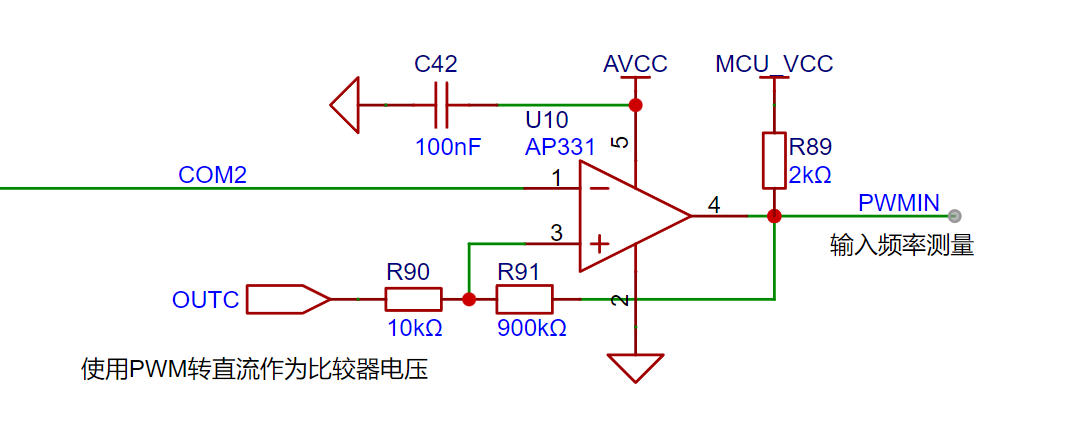
The analog input voltage, after attenuation, is split and fed into this comparator. The comparator's threshold voltage is obtained by converting PWM to DC (see the "Signal Output Circuit" section for detailed circuit analysis). To prevent oscillations, a large resistor is essential to construct the hysteresis comparator. Through this circuit, we can perform simple frequency measurement and digital analysis on the input signal.
This completes the signal input processing chain. The remaining step is to input the processed signal to the microcontroller's ADC for measurement and processing.
3.4 Signal Output Circuit

The signal output circuit can be used to output DC signals or directly output PWM signals (of course, if you are willing to program it, you can also make it output signals of other protocols, such as analog serial port output of test signals like A5 and A0, you just need to program it yourself).
Direct output is straightforward; it directly outputs the microcontroller's signal (a word of advice is invaluable). The DC output level is achieved by adjusting the duty cycle of the PWM (the set signal frequency is 20kHz; if it's a different frequency, you'll need to modify the DC calibration value), and then converting it into a "DC" signal through two stages of low-pass filtering.
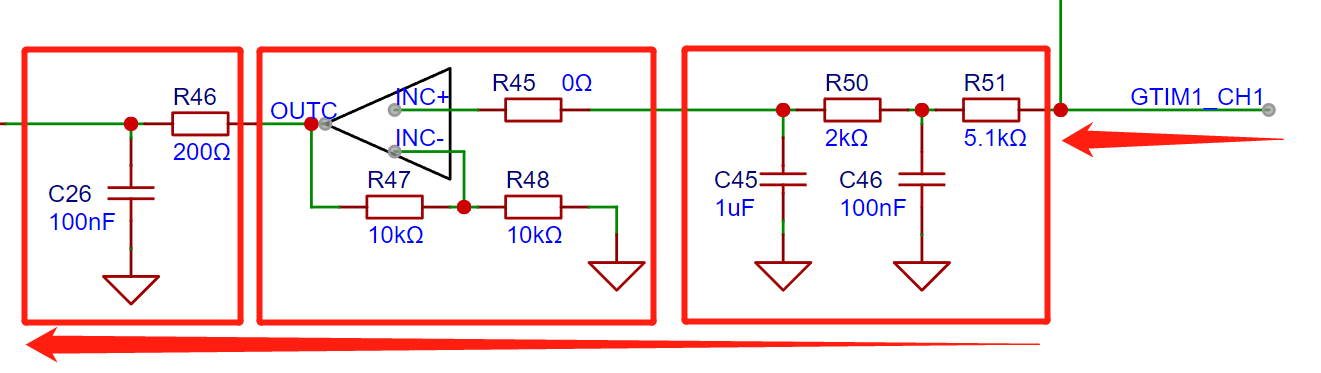
However, since the output voltage of the PWM-to-DC converter is lower than the high level of the PWM signal, it can only output a voltage of 0~(+3.3VX), which does not meet the 0~5V target I proposed in the design goals. Therefore, an operational amplifier was added to double the voltage output, ultimately allowing an output voltage of 0~6V, meeting the target requirements (if you don't understand this design logic, you can review the story of the "translator").
The amplified output voltage is then passed through another low-pass filter to obtain a more ideal DC signal.

The layout of the PWM-to-DC low-pass filter also requires careful consideration. Besides ensuring a smooth signal flow path (as indicated by the arrows in the diagram above) and that the PWM signal avoids sensitive signals susceptible to interference, it's also crucial to ensure proper grounding of the filter. In this project, vias were placed nearby to connect the GND pin to the ground plane on the front of the PCB.
Additionally, the PWM-to-DC signal (OUTC) is also input to a comparator (mentioned in the analog input section), and its usage is no different from direct output, so it will not be elaborated further.

We can control analog switch 1 to switch between direct output and DC signal. The final signal is then unidirectionally isolated and its driving capability is enhanced by a buffer.
This completes the signal output processing chain. To optimize the output circuit, we can introduce negative feedback from the DC output back to one of the microcontroller's ADC channels, thereby achieving more accurate DC output. (Currently, there is no negative feedback; instead, curve fitting is used to correct the nonlinearity caused by the PWM-to-DC conversion, but this results in point-to-point errors).
3.5 Current Source Circuit
In this project, to achieve short-circuit measurement, and since only a small resistance (designed to be within 200Ω) needs to be measured, a fixed current source was used. I built a simple current source using an LDO to simplify the circuit complexity (I actually wanted to use a better, more precise current source, but the board space didn't allow it; I will optimize it in future upgrades).

The above diagram shows the rearranged circuit layout (the electrical connections were not adjusted). The leftmost line connects to the tip of the multi-functional test pen. Based on the diagram, we can analyze and understand the current source from right to left.
The rightmost part is a simple circuit that uses low voltage (3.3V TTL level of the MCU) to control a high-voltage MOS (17.5V analog power supply). After the MOS, we use an LDO to convert the 17.5V to 5V current source power supply for the subsequent current source.
There are three design considerations here:
① First, the LDO is placed after the MOS switch. This avoids wasting energy by having the LDO continuously operate when the current source is not in use. This is especially important in this project where a large voltage difference of 17.5V to 5V is required, as the LDO's efficiency is relatively low. Therefore, this design reduces unnecessary energy consumption.
② Second, although the LM1117 stage after the LDO has a 20V input withstand voltage, "on/off detection" is required, which involves significant instantaneous current changes. Directly connecting the power supply to the current source would cause fluctuations in the operating voltage of the analog front-end, which is detrimental to test accuracy. Therefore, an LDO is added for buffering. ③ If the
output voltage of the current source is too high, the measurement of the diode's forward voltage will be inaccurate. To ensure test accuracy, the floating output voltage of the current source needs to be appropriately reduced.
Now let's analyze the current source section. This current source is a simple current source built using the negative feedback of the LDO. Some people might not understand this: Isn't an LDO a step-down chip? How can it perform constant current operation? Let's take a look at the chip's datasheet: (Note that not all LDOs can be used as current sources; specific analysis is required based on the LDO's operating principle.)

This is a screenshot of the "APPLICATION CIRCUIT" section in the datasheet. This section is a design reference provided by the manufacturer to engineers, which includes this design reference diagram for a "300mA current source." We only need to add a current-limiting resistor between the chip's OUT and ADJ pins to use it as a simple current source. When the maximum output current of the current source does not exceed the maximum output current of the LDO, it can be calculated using Vref/R1. In my design, a 2mA current source is needed. By checking the LDO's datasheet, we can find that Vref is 1.25V. Therefore, we can calculate that the current-limiting resistor we need is 625Ω.
Note: Since the 625Ω resistor is not a standard value, the closest value to 625Ω is the 626Ω resistor from the E192 series. However, the E192 series resistors are not only expensive but also produced in limited quantities, leading to unstable supply. Considering this project only uses a simple testing tool and does not involve high-precision testing, the more commonly used 620Ω resistor from the E24 series was chosen. Although the theoretical current will be 2.016mA, this error is perfectly acceptable. If higher accuracy is required, the current-limiting resistor can be replaced with two resistors in series. However, due to the lack of negative feedback, Vref will fluctuate, so even using a more precise current-limiting resistor will only result in limited accuracy improvement. In conclusion, during circuit design, we should find a balance between specifications and project cost.
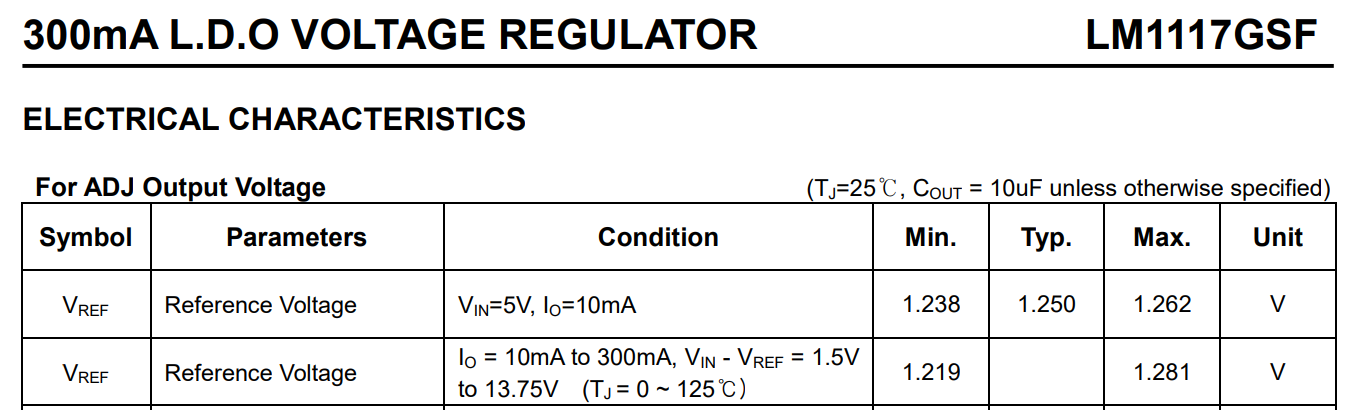
The LDO's adj pin voltage, also known as Vref, can be found in the datasheet (see the table above - datasheet screenshot). It can be seen that this voltage fluctuates in actual operation, but the resulting current fluctuation is within an acceptable range.
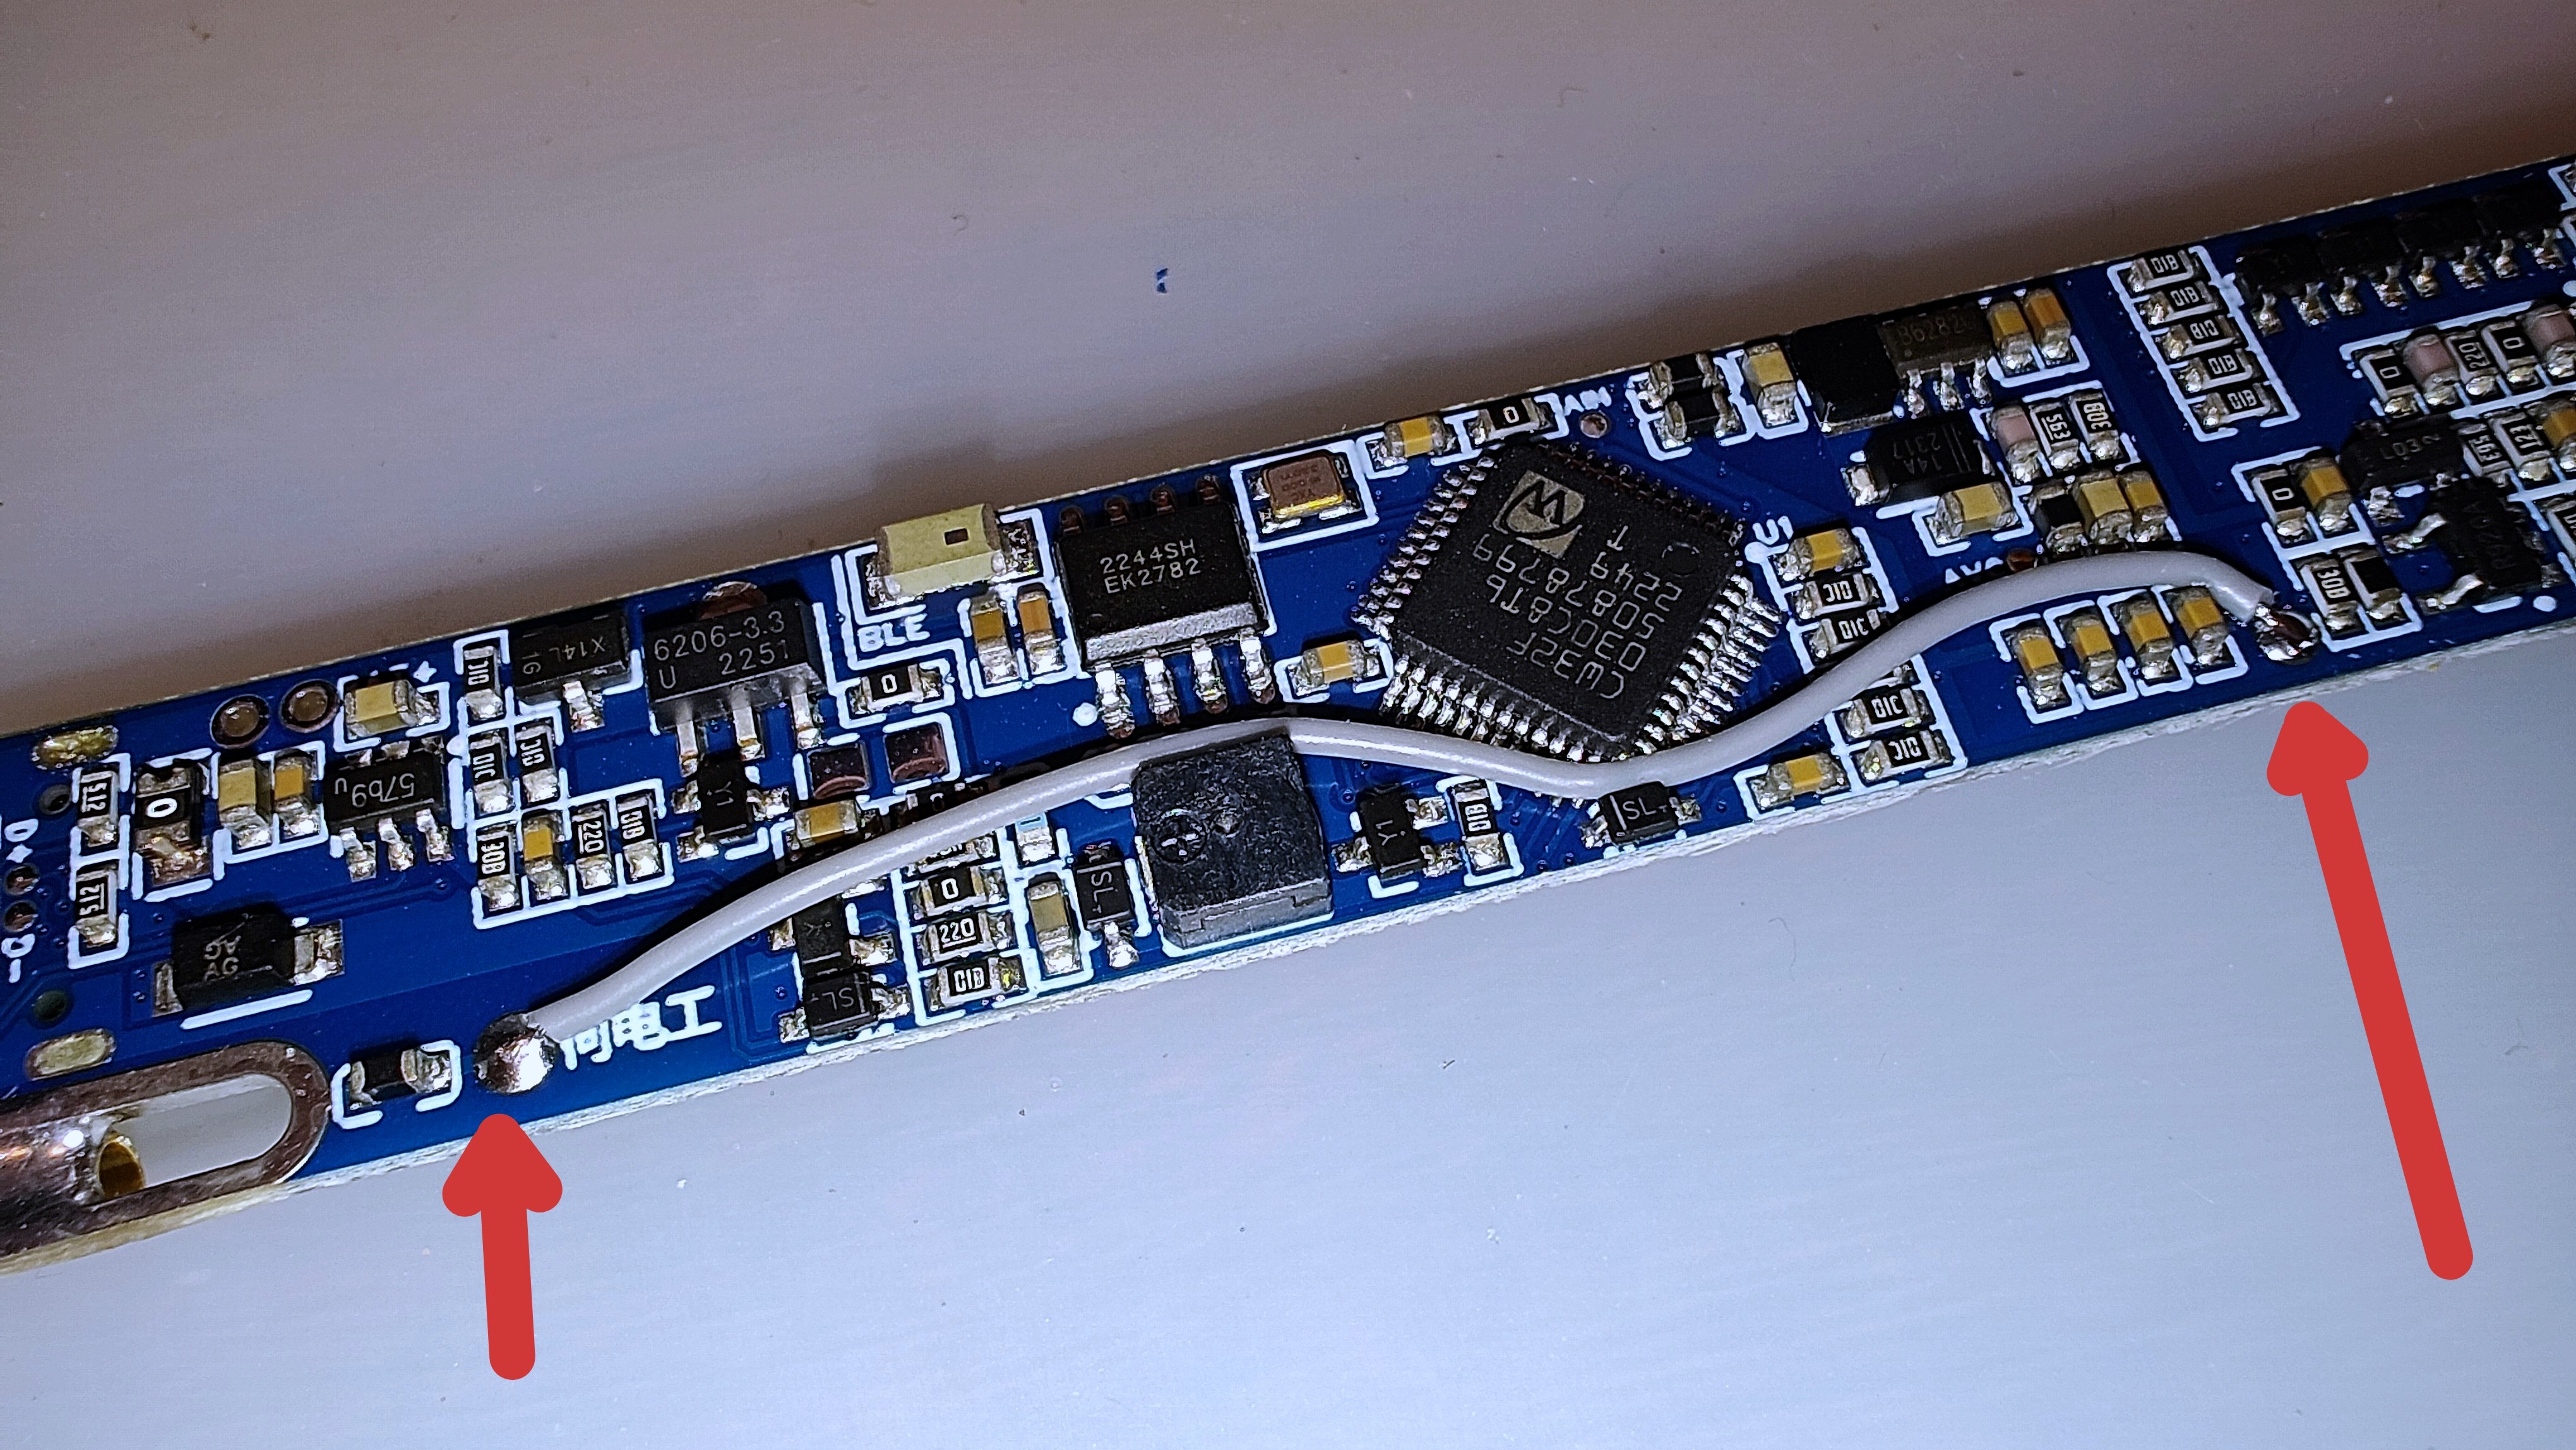
Between the current source and the output, there is an opto-solid-state relay (PM1, indicated by the red arrow in the diagram below). Its usage is basically similar to a traditional single-pole single-throw relay, and its driving method is the same as a regular LED; it can be driven directly using an I/O port with a current-limiting resistor. Compared to traditional relays, opto-solid-state relays have many advantages such as fast response time and small size, making them very suitable for projects like this one with strict size requirements.
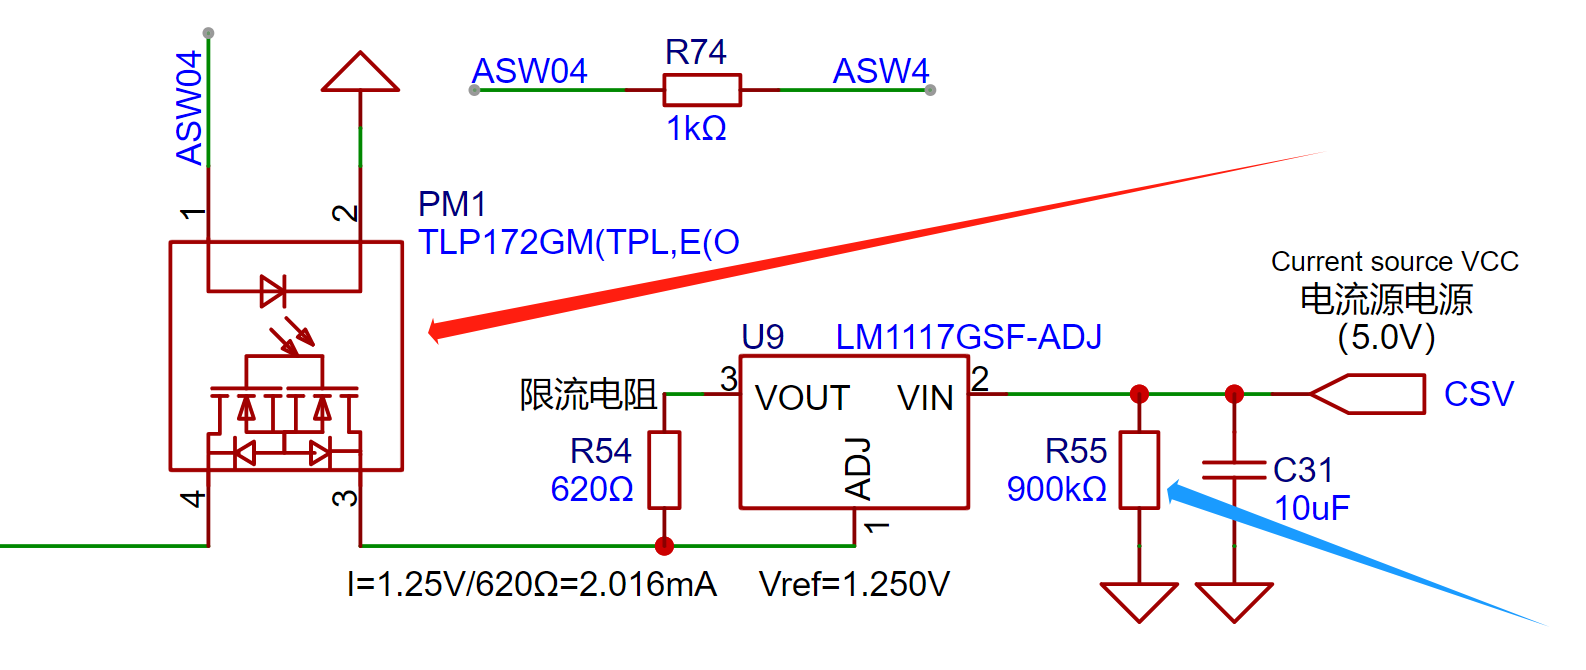
There is also a high-resistance resistor in the diagram above (indicated by the blue arrow). This is because there is a large 10μF capacitor next to it. If the opto-solid-state relay is turned off, the current source output is floating, and the internal charge cannot be released. Therefore, a resistor is added for discharge. Additionally, a larger resistance value was chosen for this resistor to avoid increasing circuit power consumption. (The choice of 900K resistors here is not particularly significant; it's simply because 900K resistors are also used elsewhere in this circuit. To avoid introducing new materials and increasing production complexity and costs, existing material models are prioritized, which is a common design technique.)
In addition, during the design process of this project, basic library materials from JLCPCB were used as much as possible:

apart from special components such as chips, 21 out of 25 types of components such as resistors, capacitors, diodes, and transistors were selected from the basic library to minimize the cost of sample SMT. (As shown in the figure above)
3.6 Analog Switch Control Circuit
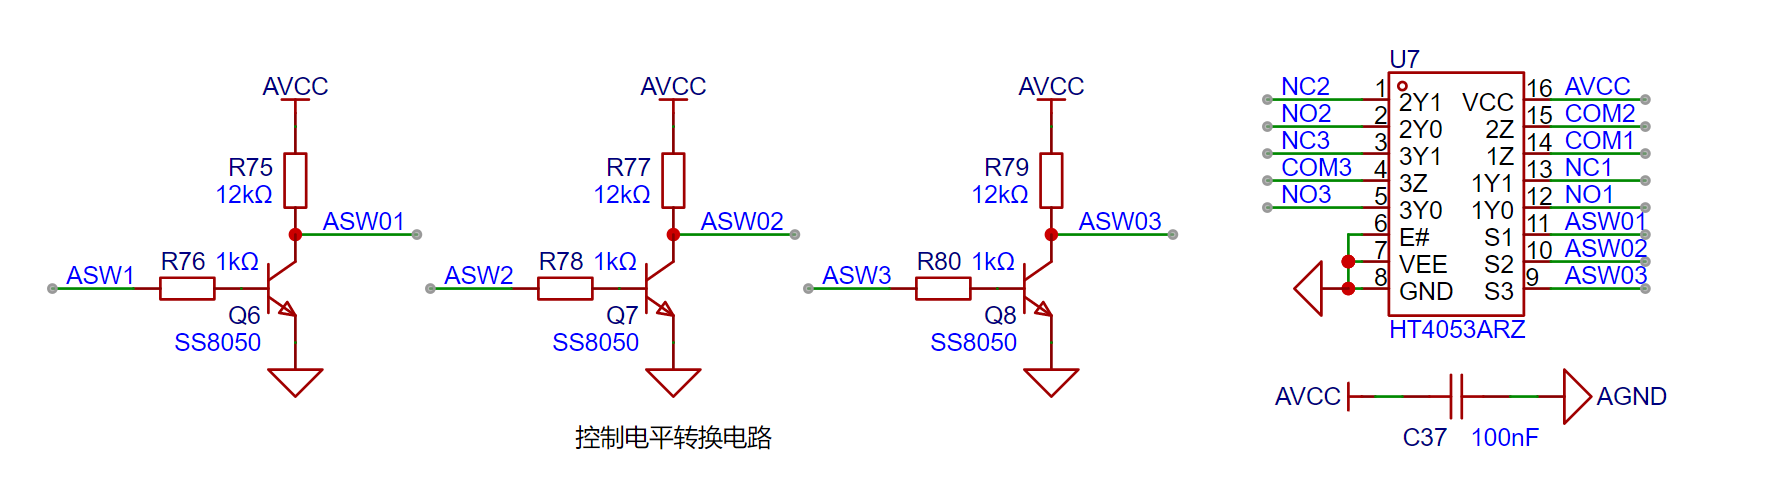
This project uses the HT4053 analog switch, operating at 17.5V. When reviewing the datasheet, it was found that the logic high level of this chip differs depending on the operating voltage. For example, at a 15V operating voltage, 11V is required to be recognized as a logic high level. Since the operating voltage in this design is higher, the logic high level will also be higher, making direct microcontroller control of the 4053 analog switch impossible.

Therefore, I designed a logic level conversion circuit. The principle is quite simple, but it's important to note that when the microcontroller outputs a low level, the state switching pins of the analog switch chip are at a default high level. To facilitate design and subsequent programming, I used the opposite network for the normally open and normally closed pins of the analog switch chip compared to the chip's default state. This is because in this design, the normally open and normally closed pins of the analog switch have already switched upon device power-on.
It's crucial to note that due to differences in design and manufacturing processes, if you need to replace with a different model of analog switch, please first consult the corresponding chip's datasheet to determine its logic level threshold and I/O port withstand voltage.
3.7 Floating Ground and Grounding
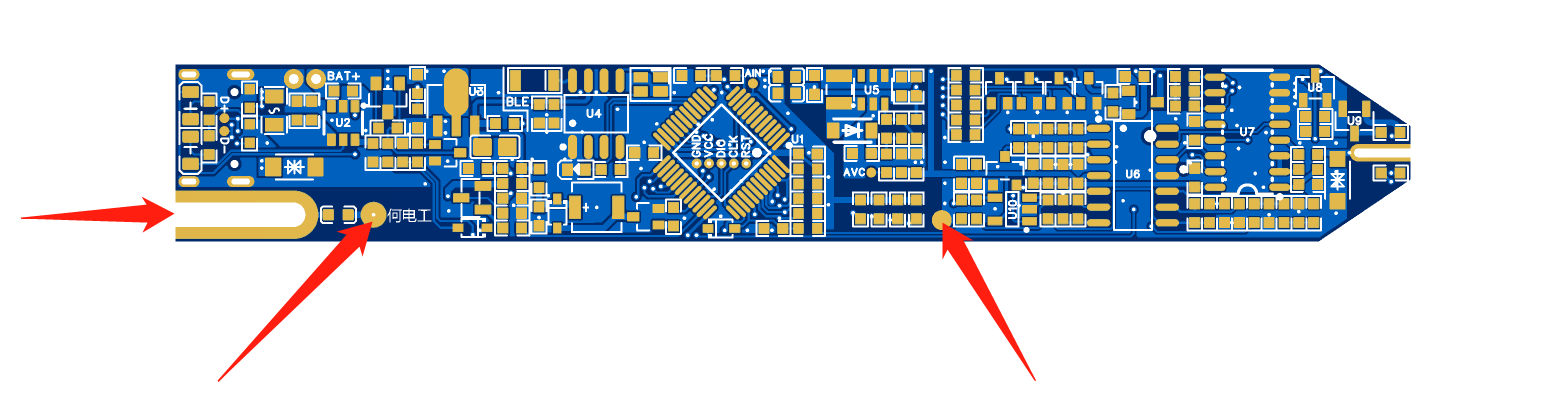
Diagram : The half-hole on the left is the soldering position for the tail plug, and the other two pads are flying wire points. The tail plug corresponds to the COM network, which is a floating ground, just like the COM port of the multimeter. Due to the use of a double-layer board in this design, the PCB trace space is very tight. To achieve better performance and avoid introducing interference into the digital circuit section, an external flying wire solution was ultimately chosen. Therefore, during assembly, the two pads marked with arrows need to be connected to flying wires. The specific operation will be explained in detail in the assembly instructions.
It should be noted that the test probe uses a floating ground, just like the multimeter, instead of a real GND. Therefore, it should be avoided when the charging cable is connected, because at this time the floating ground of the test probe is connected to the GND of the charger, becoming a real GND. It is easy to cause a short circuit and thus a danger during operation due to carelessness.
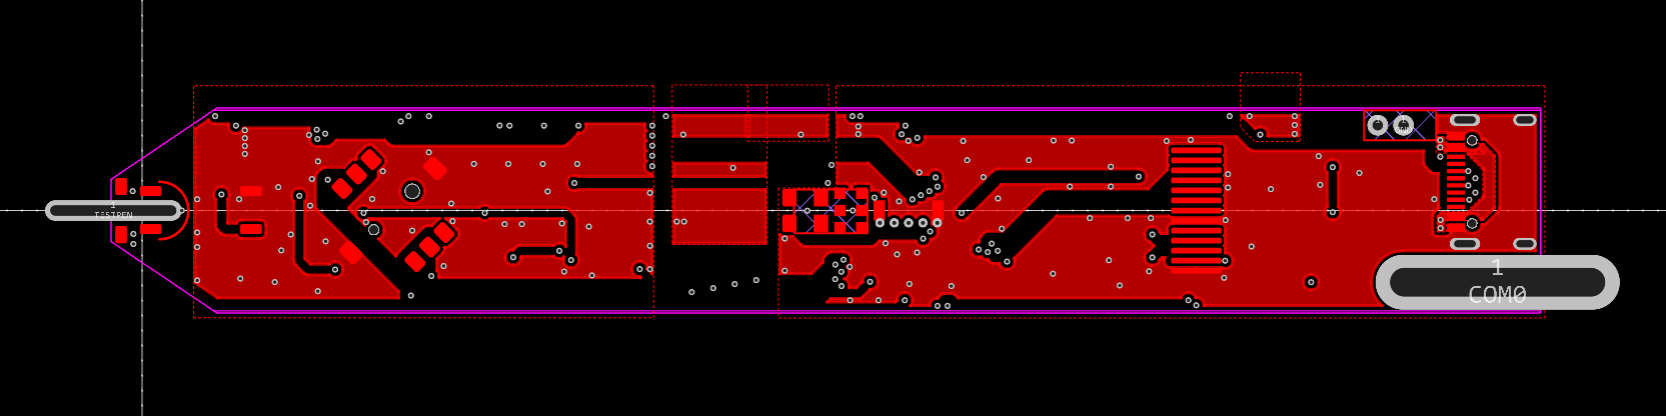
We can see the ground plane separation of the test probe intuitively after hiding the wires.
3.8 Analog Front-End Summary:
Although the analog front-end of this project has many functions and the circuit diagram seems complicated at first glance, it is still easy to understand as long as the circuit diagram is broken down according to function and analyzed one by one.

In short, the analog front-end can be divided into three parts: signal input, signal output, and current source output. Different operating modes are achieved by switching analog switches to allow these three parts to work individually or simultaneously.
V. Hardware Soldering and Assembly
Hardware assembly has many sequences. Mastering good soldering and debugging habits will help you save time and quickly locate problems. It also facilitates recording complete and detailed test reports, making it easier for software engineers to conduct independent testing and later software-hardware integration debugging (and preventing software engineers from blaming hardware problems).
5.1 PCB Soldering
PCB soldering also has a sequence. It's not acceptable to solder everything all at once. Soldering everything at once makes it difficult to locate problems if they arise, and if the power supply section has a problem, it may damage a large area of the circuit. Below, I will introduce the recommended soldering and testing sequence for this project:
① Solder the Type-C interface and charge/discharge management circuit. Solder the battery to test the charge/discharge management circuit, and remove the battery after completion.
② Solder the power-on/off circuit and the five-way switch. Press the long button to test if the power supply outputs normally.
③ Solder the analog power supply and test if it is normal. If possible, test the output ripple.
(★Remember to solder the power supply first and complete the test before soldering the subsequent circuits to prevent power supply problems from affecting the entire circuit.)
④ Solder the analog switch and the analog switch control signal level conversion circuit. Manually apply a signal to test the level conversion.
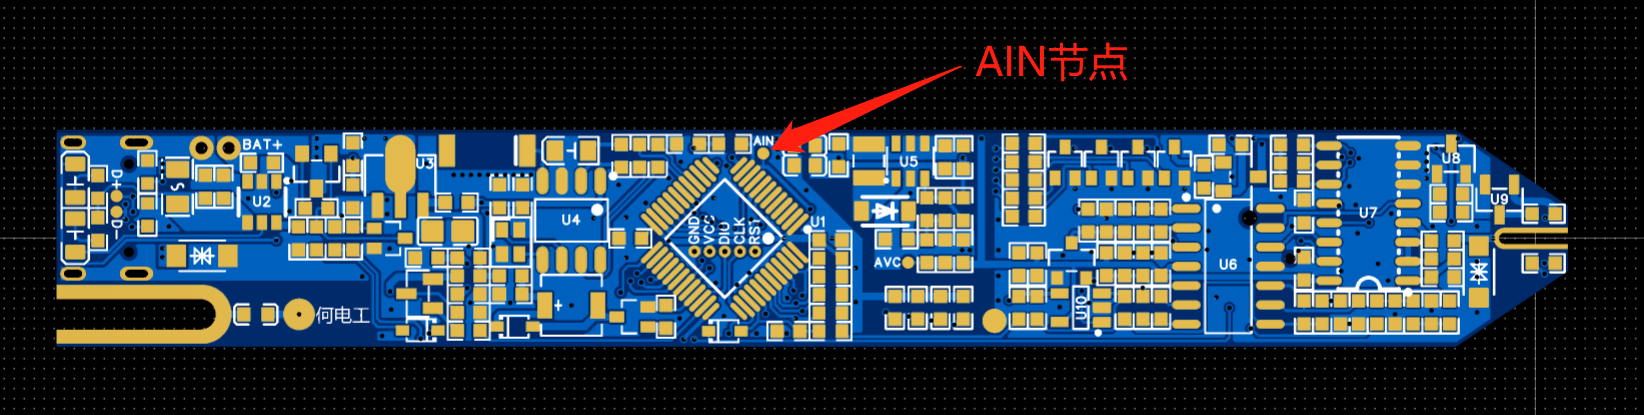
⑤ Solder all analog front-end circuits and apply an analog signal to test the AIN test point voltage
. ⑥ Solder the microcontroller and red/green indicator lights. Then, you can burn the program and observe if the power-on is normal.
⑦ Solder other peripherals, pen tip, and tail plug (the soldering method can be found in the "Hardware Assembly Instructions" section).
⑧ Solder the display screen.
It is recommended to follow the above order for step-by-step soldering and testing. Even if you encounter component failures or other problems, you can quickly locate the problem.
Of course, if you don't want it to be that complicated, I'll summarize the soldering order as follows: power supply (AVC test point), analog front end (AIN test point), microcontroller and peripherals. If you're used to using a hot air gun for soldering like me, you'll need to use a soldering iron last to solder components that are easily damaged by the hot air gun: buzzer, display screen, etc.
5.2 Hardware Assembly Instructions
This project involves the assembly and soldering of some special structures, so this section will explain them in detail:
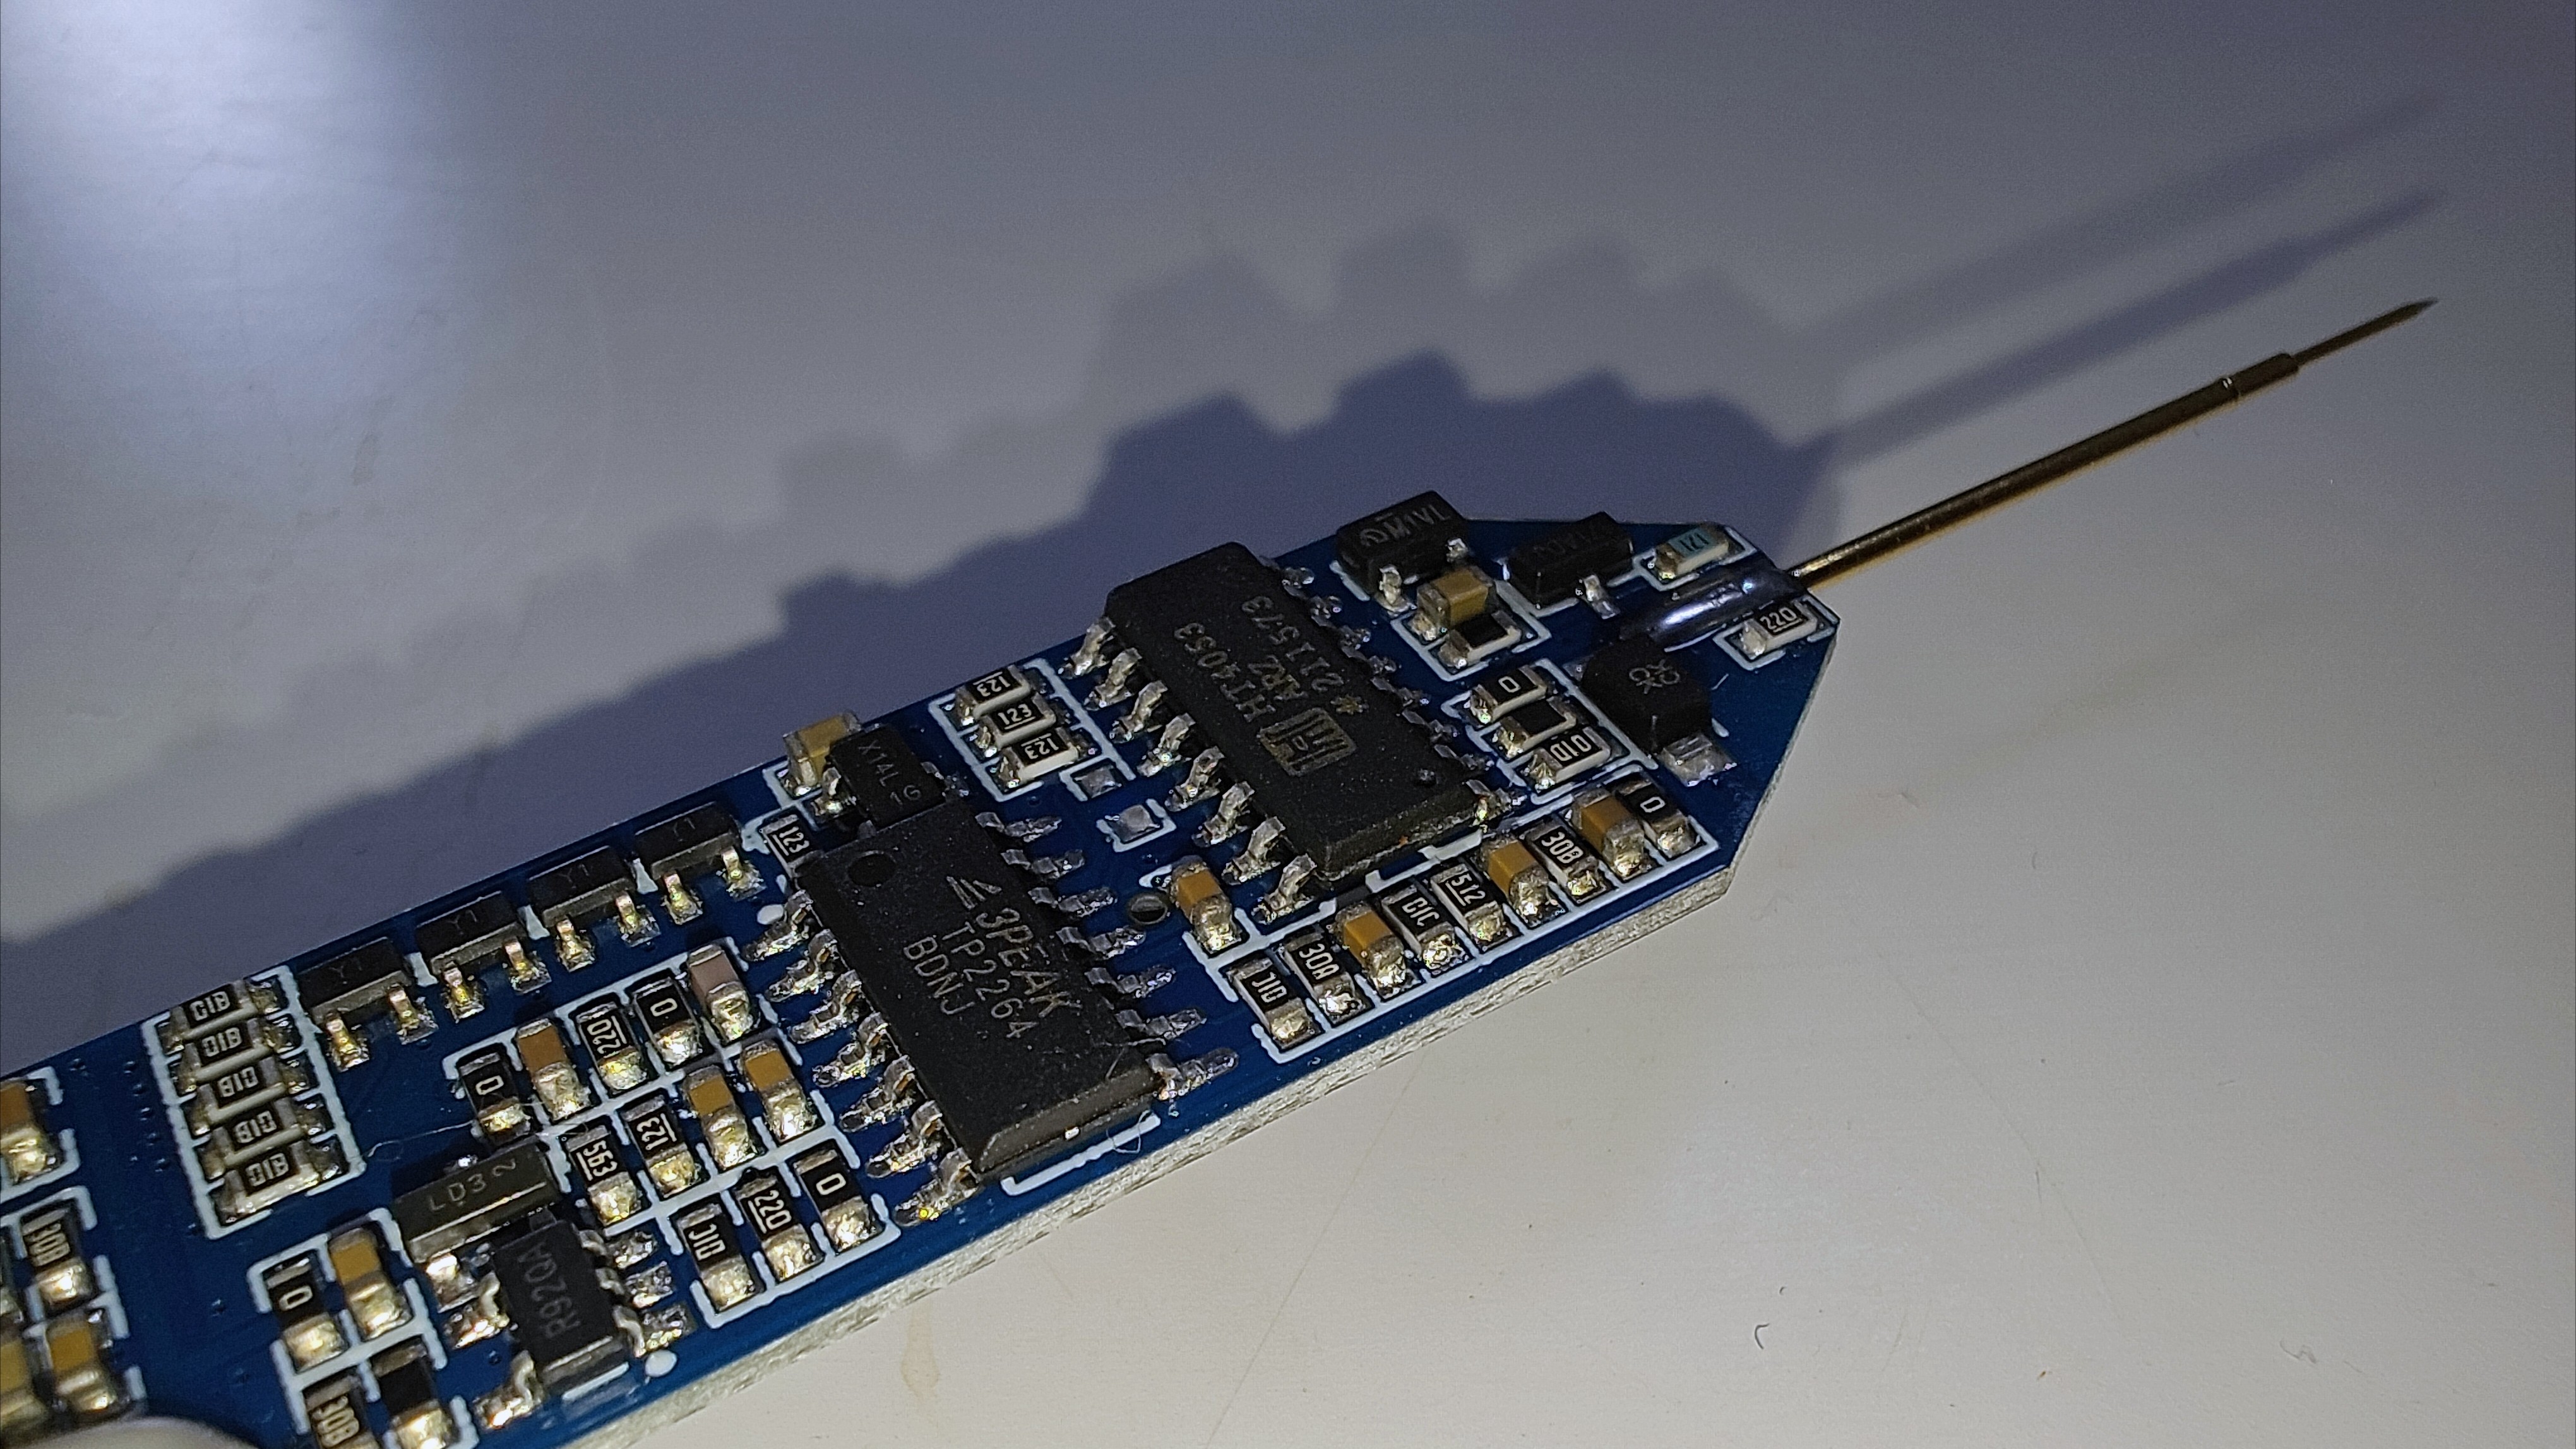
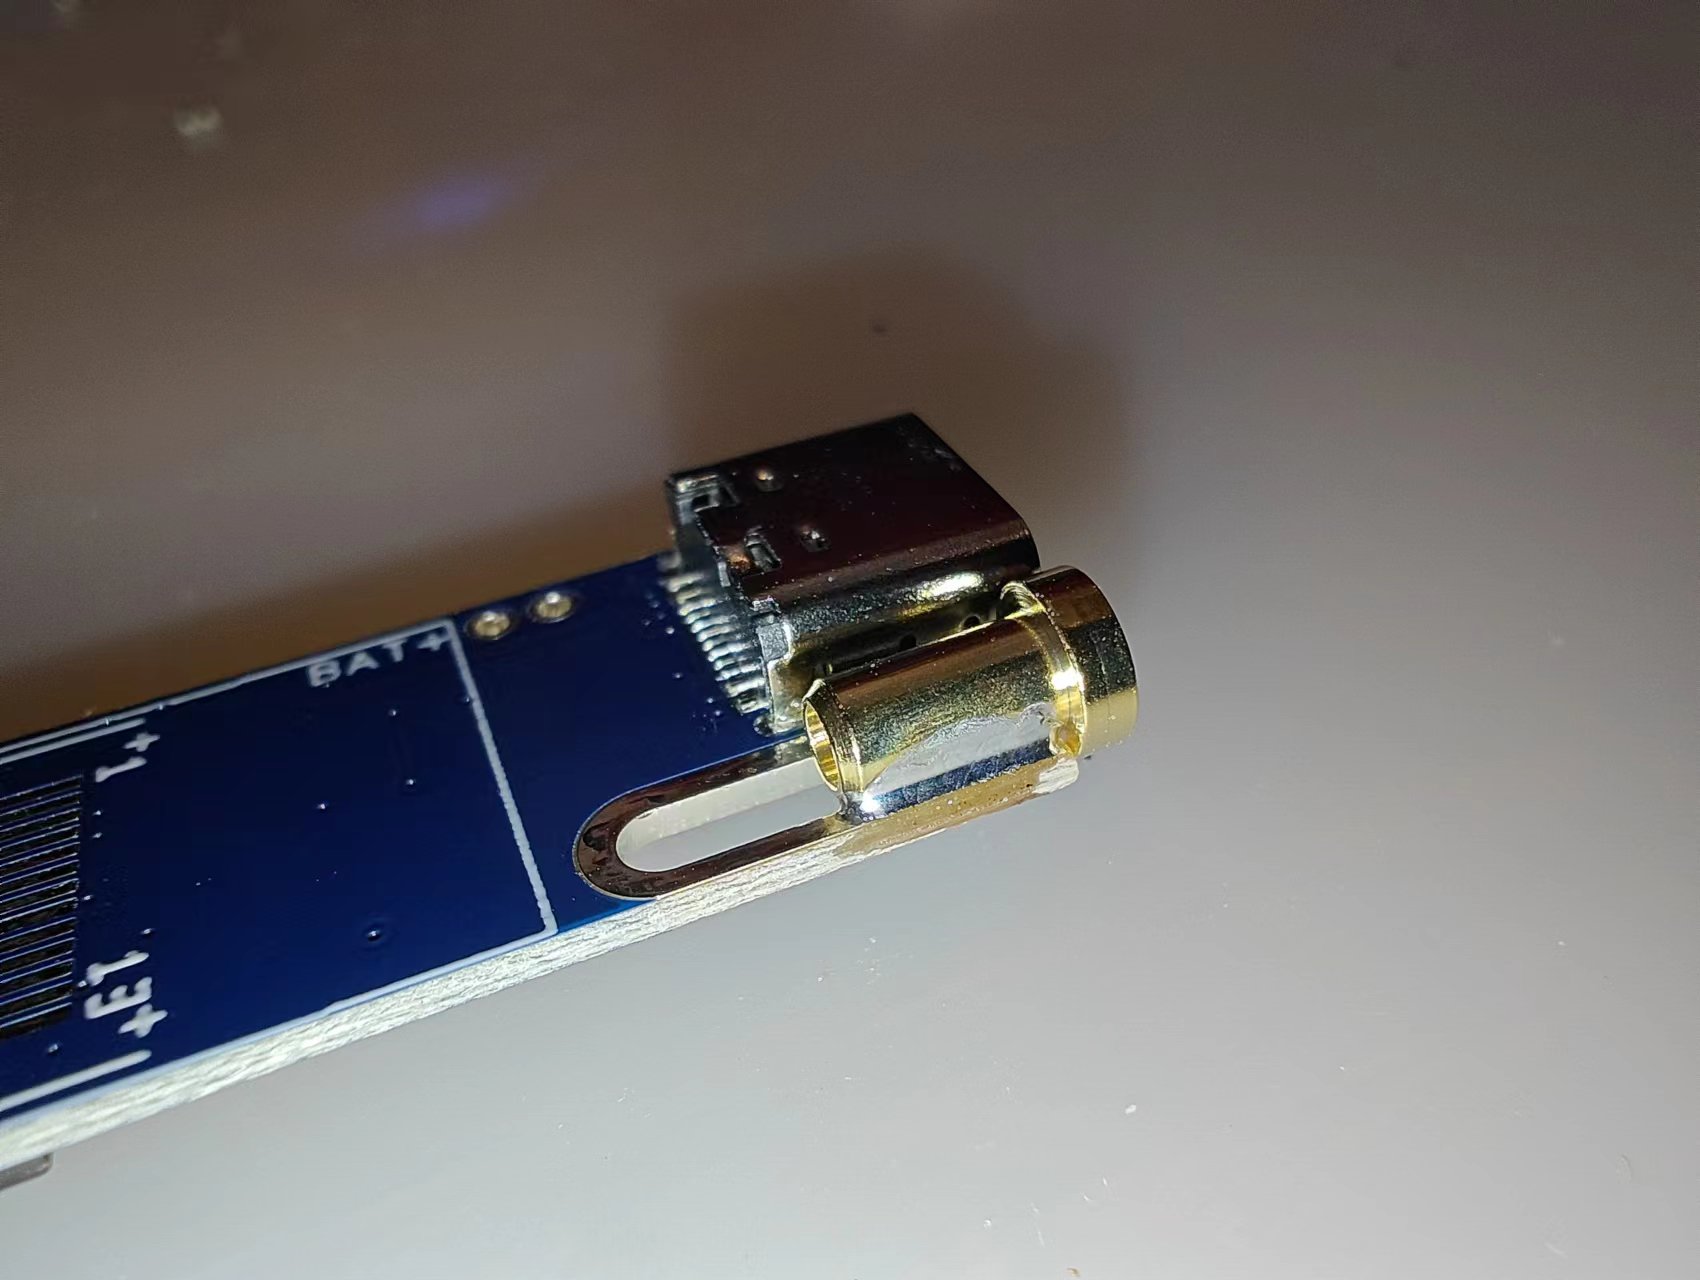
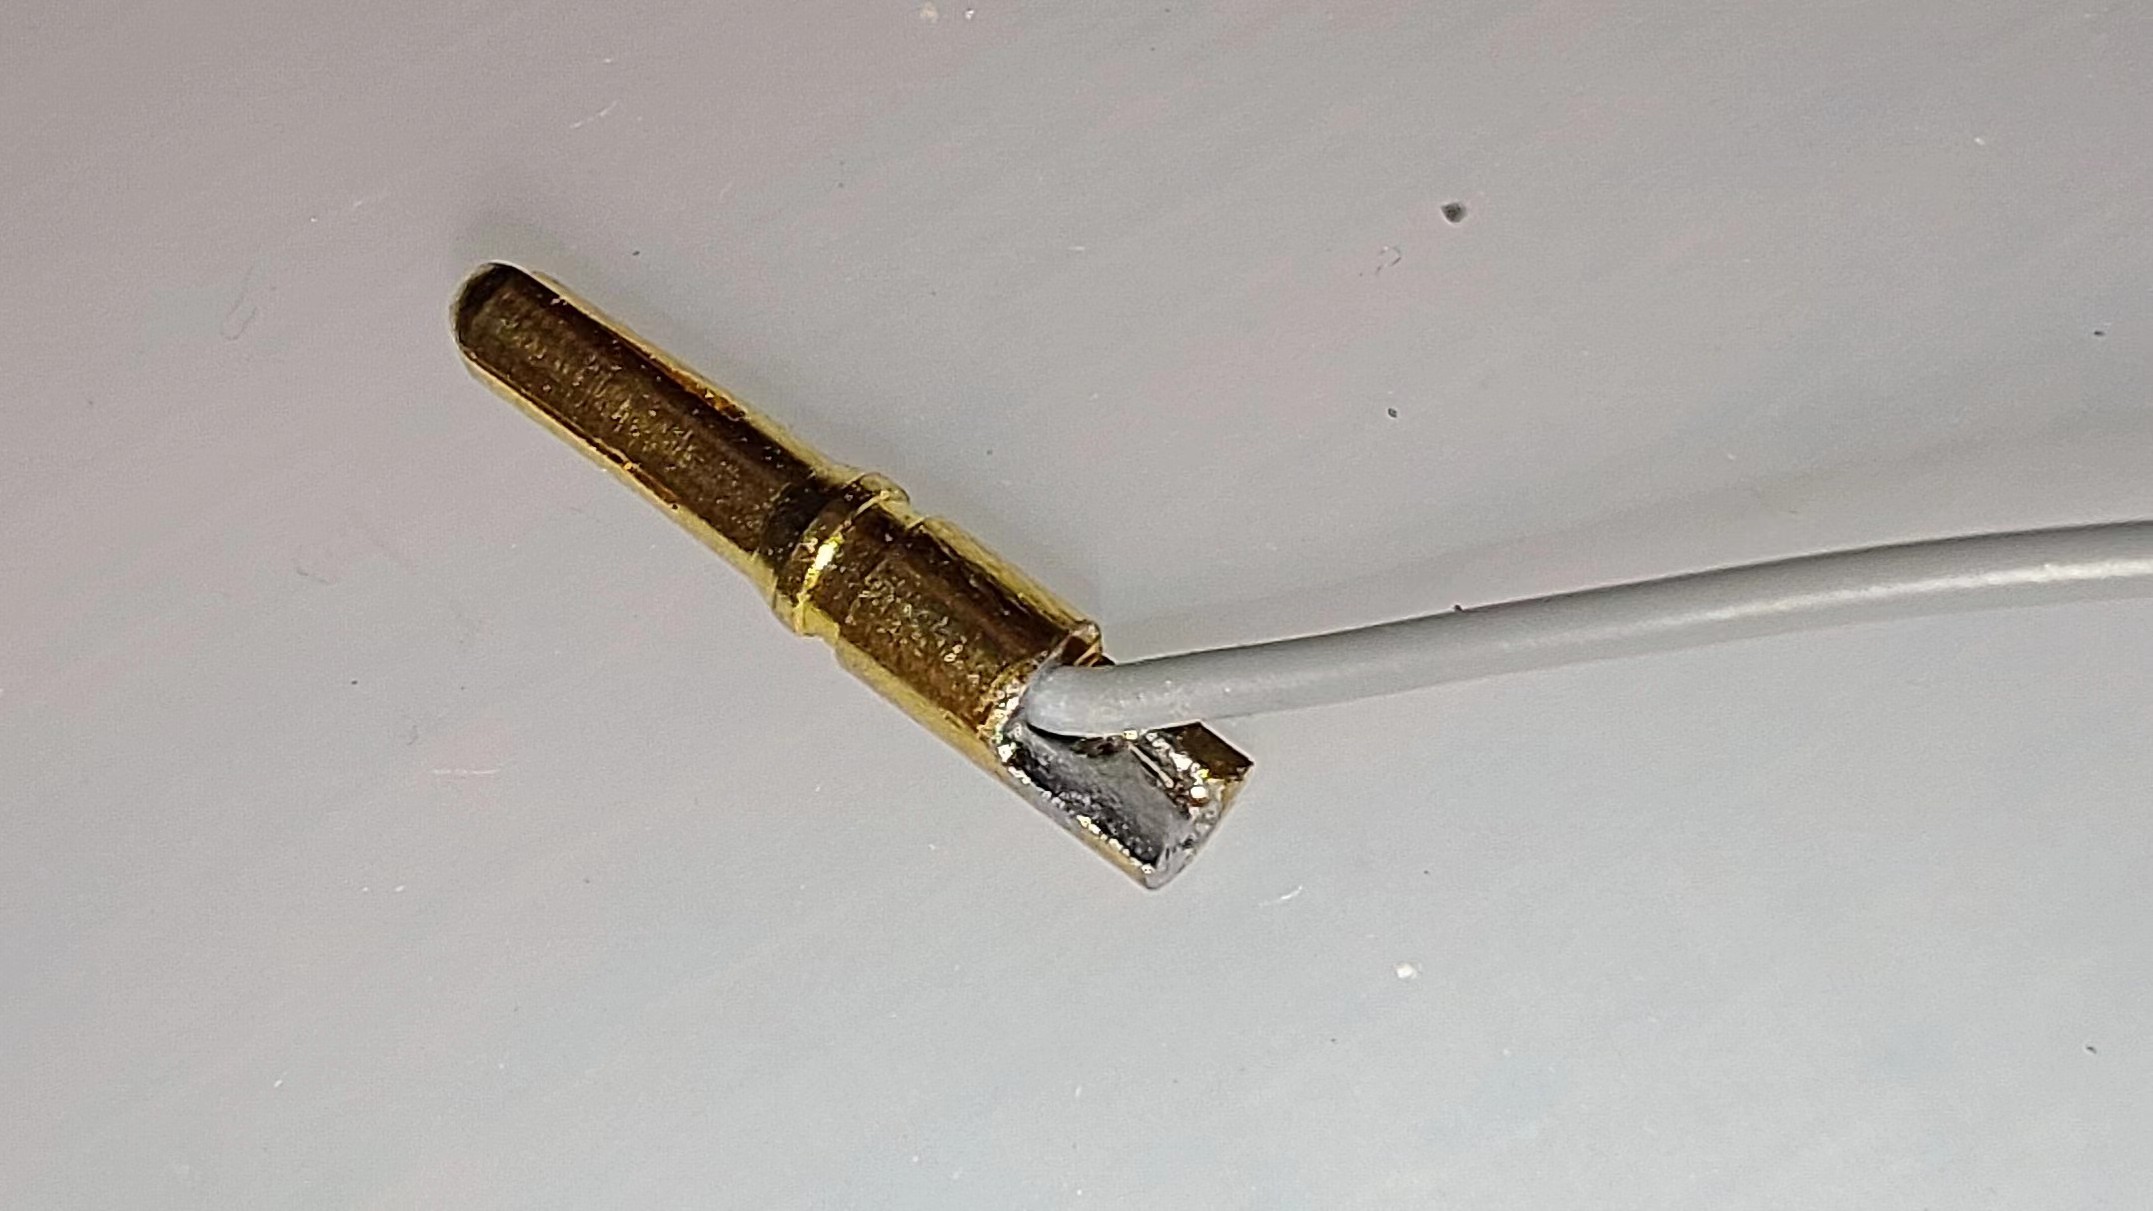
① Test Probe
Insert the spring pin into the sleeve, break off the thinner part of the sleeve (it's very brittle, you can break it by hand), clean the half-hole on the PCB (if you, like me, did not use the half-hole process but chose to use the conventional process to process the PCB, there is likely to be a piece of suspended copper foil in the half-hole), hold the probe in the PCB, and use a soldering iron to solder it so that the half-hole is filled with solder.
After soldering the probes, heat-shrink tubing can be applied to them to prevent short circuits and other hazards on the complex pin layout of the PCB.
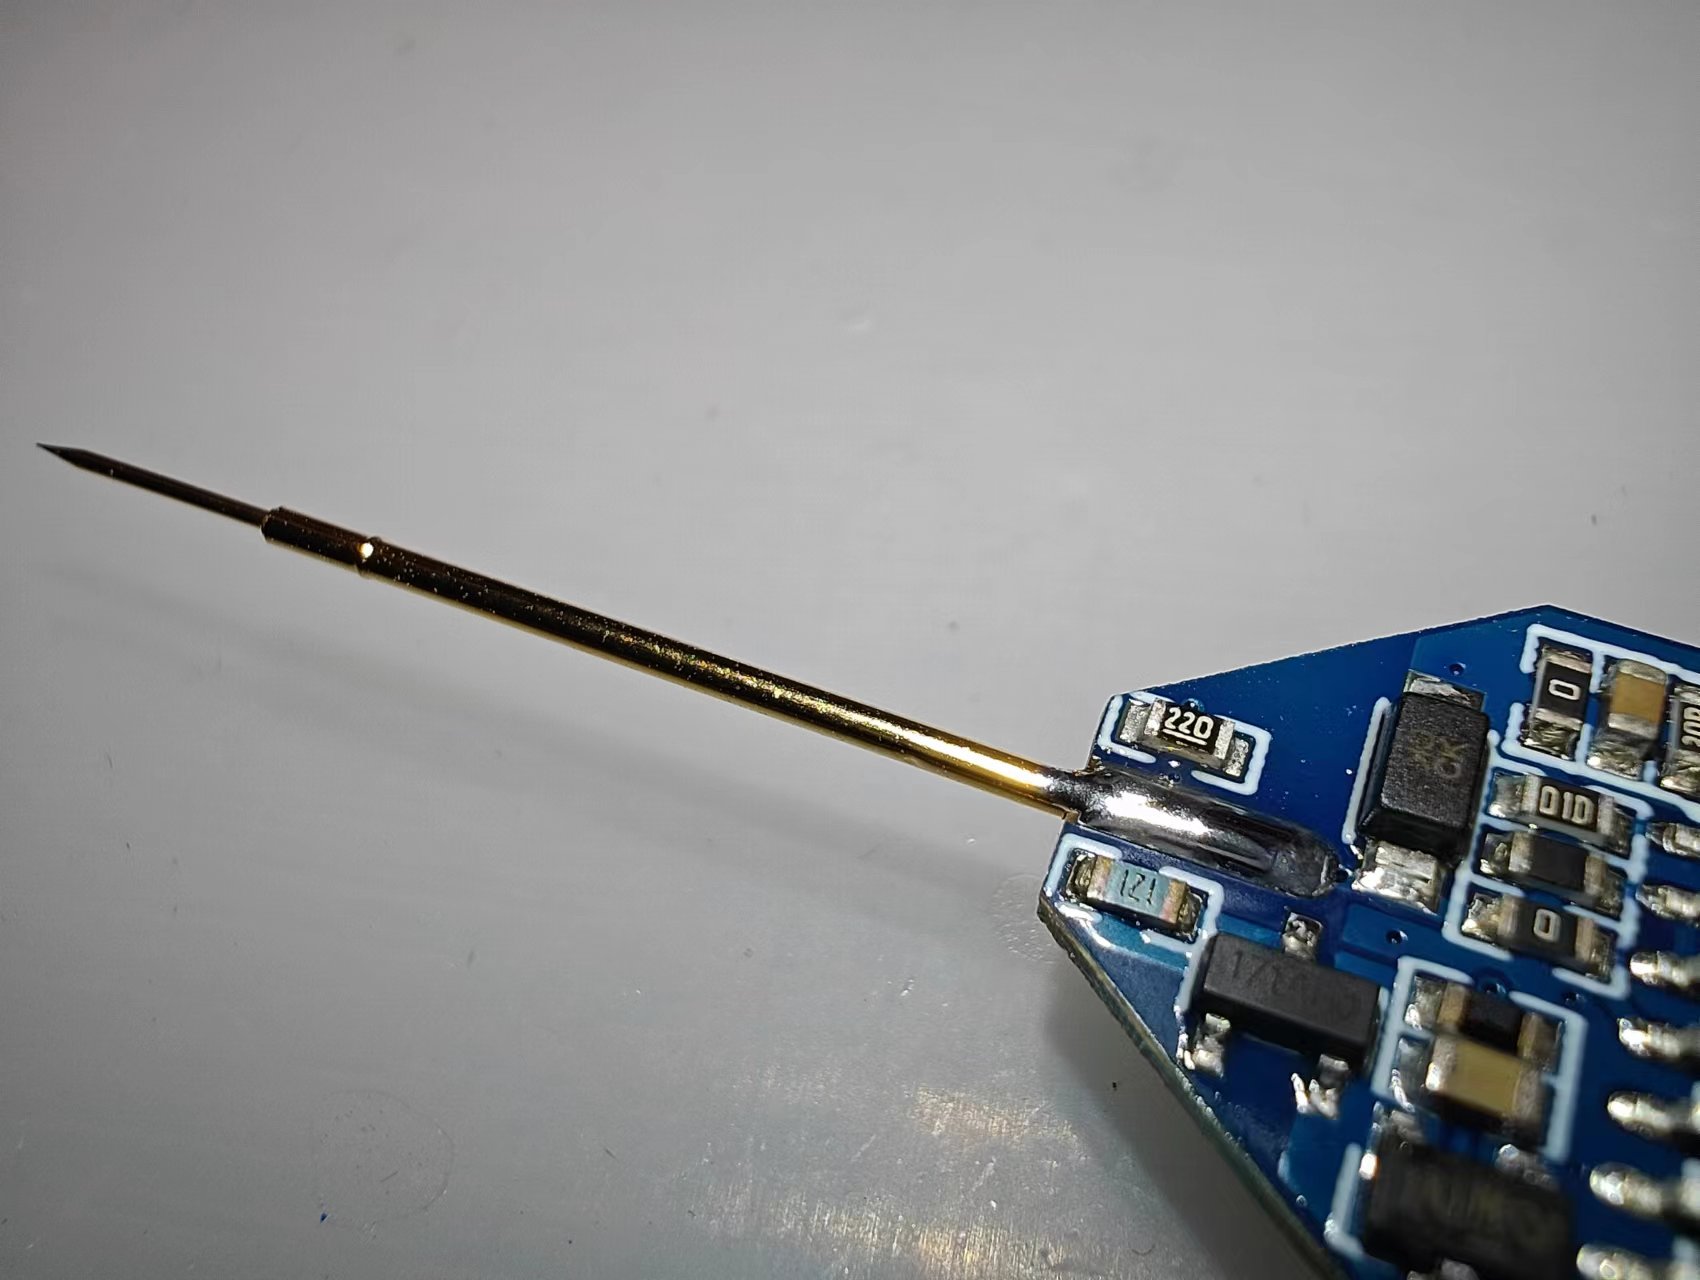
The reason for using a thin probe with tubing instead of a thicker probe is twofold: firstly, thicker probes are too bulky; secondly, the double-layer structure of the thin probe and tubing helps strengthen the structure, making a thicker probe less necessary for higher strength.
Another advantage of using tubing is that if the spring pin is damaged, it can be easily replaced by simply plugging and unplugging it!
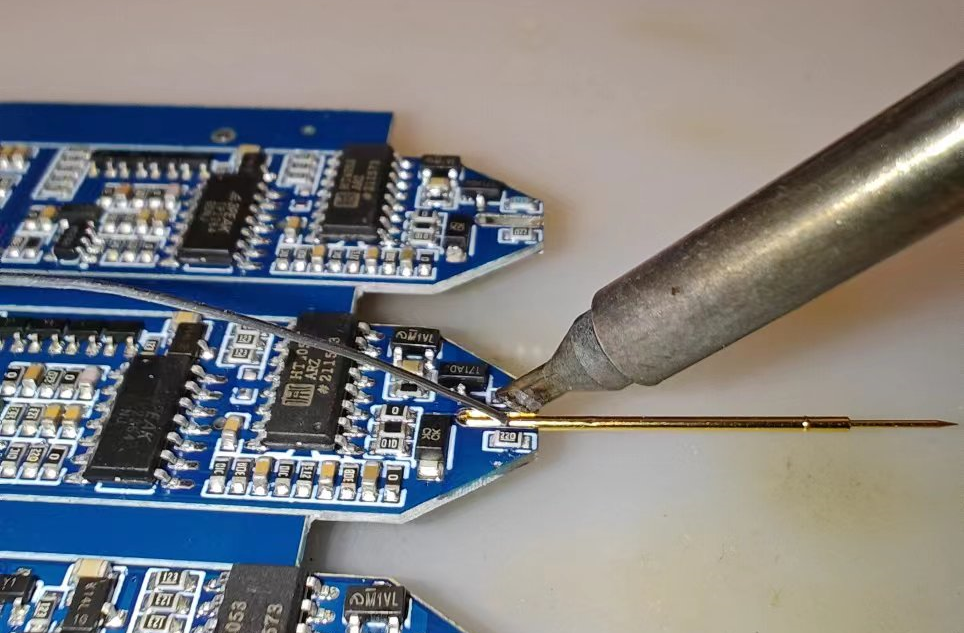
② Soldering the tail plug
is similar to the probe soldering process. First, clean the half-hole, then place the tail plug, and apply solder to the outside to secure it. Then, flip the PCB over and use tweezers to hold the tail plug to the PCB (the solder on the front side will melt during reverse soldering, causing the tail plug to fall off). Fill the pads with plenty of solder to ensure a firm solder joint. Remember to maintain the gripping position until the solder cools and solidifies.
Safety Tip: Due to the larger size of the tail plug, its heat capacity is also larger. After soldering, be sure to wait several minutes until the tail plug has completely cooled before touching it; otherwise, burns or other hazards may occur! (Don't ask why, just because I got burned.)
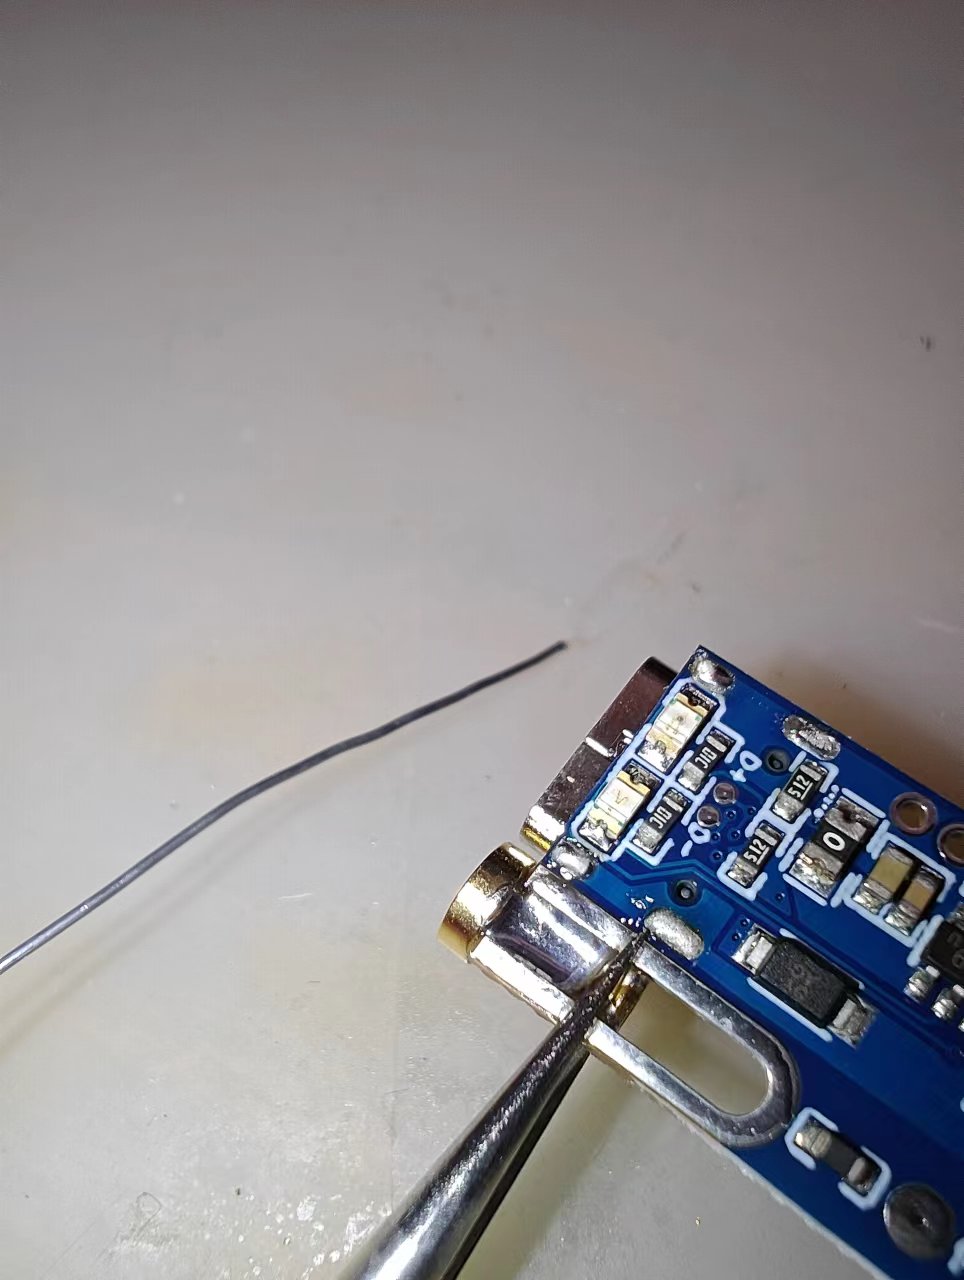
③ COM Jumper Wire
Note: Make sure to solder the COM-AGND jumper wire properly before use!
30AWG silicone wire is recommended, or other jumper wires can be used to connect the COM and AGND pads.
④ Tail Plug Connection Wire
30AWG silicone wire is recommended, or other jumper wires can be used to solder to the 2mm tail plug.
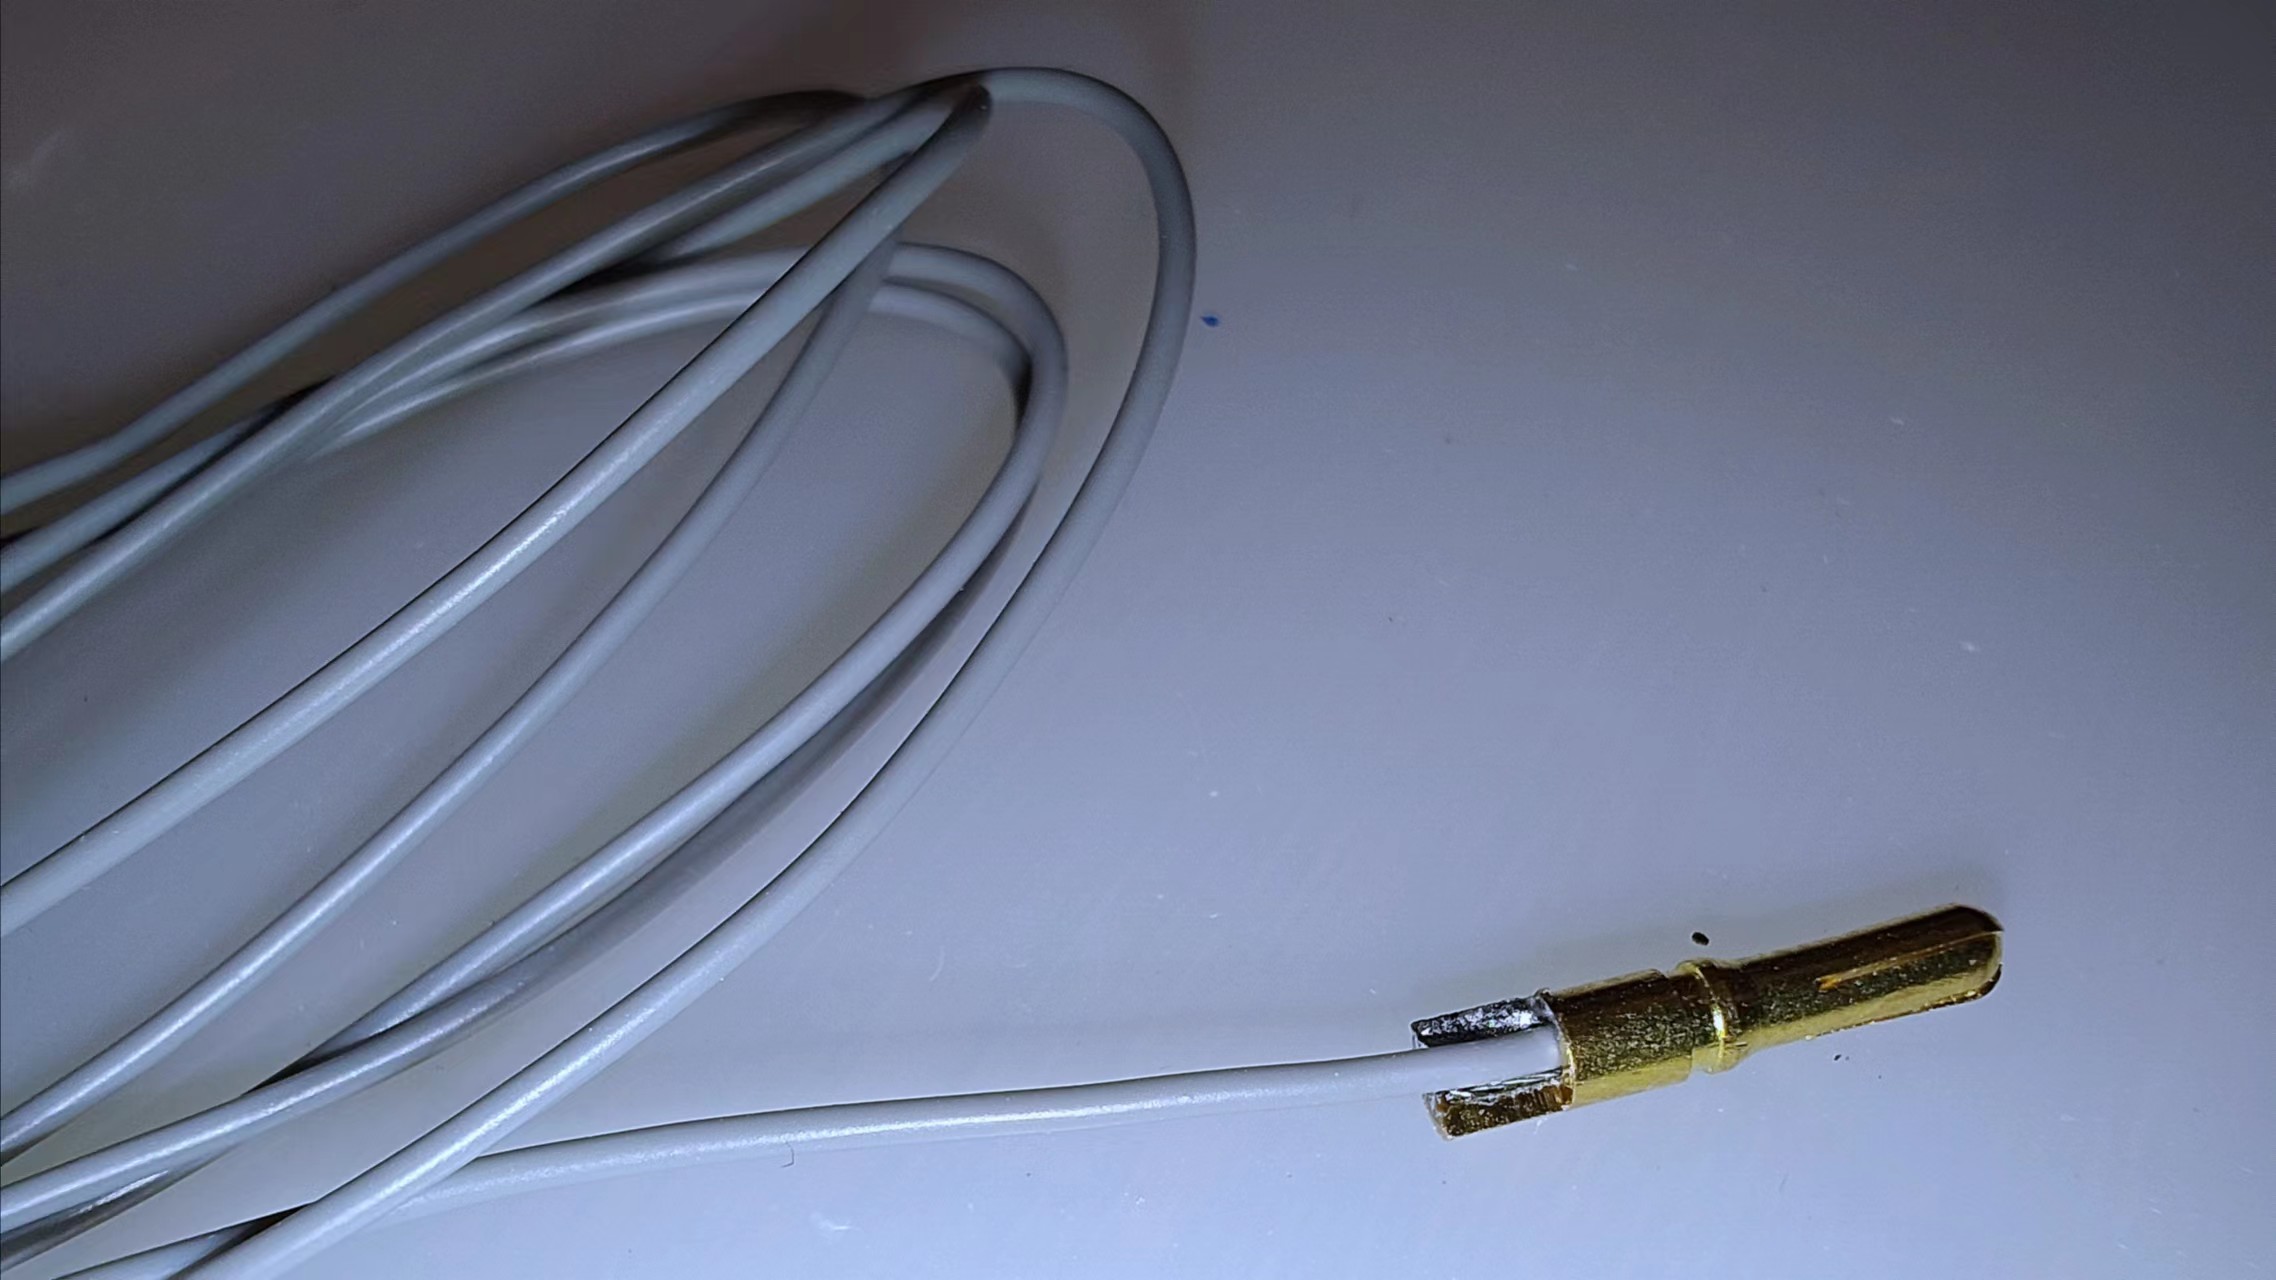
If you purchased the tail plug from the link I provided, you can unfold the silicone wire, bend it 180°, insert it into the tail plug hole, and then solder it with a soldering iron.
Please ensure the extension cable and tail plug are stably connected. See the image below for reference.
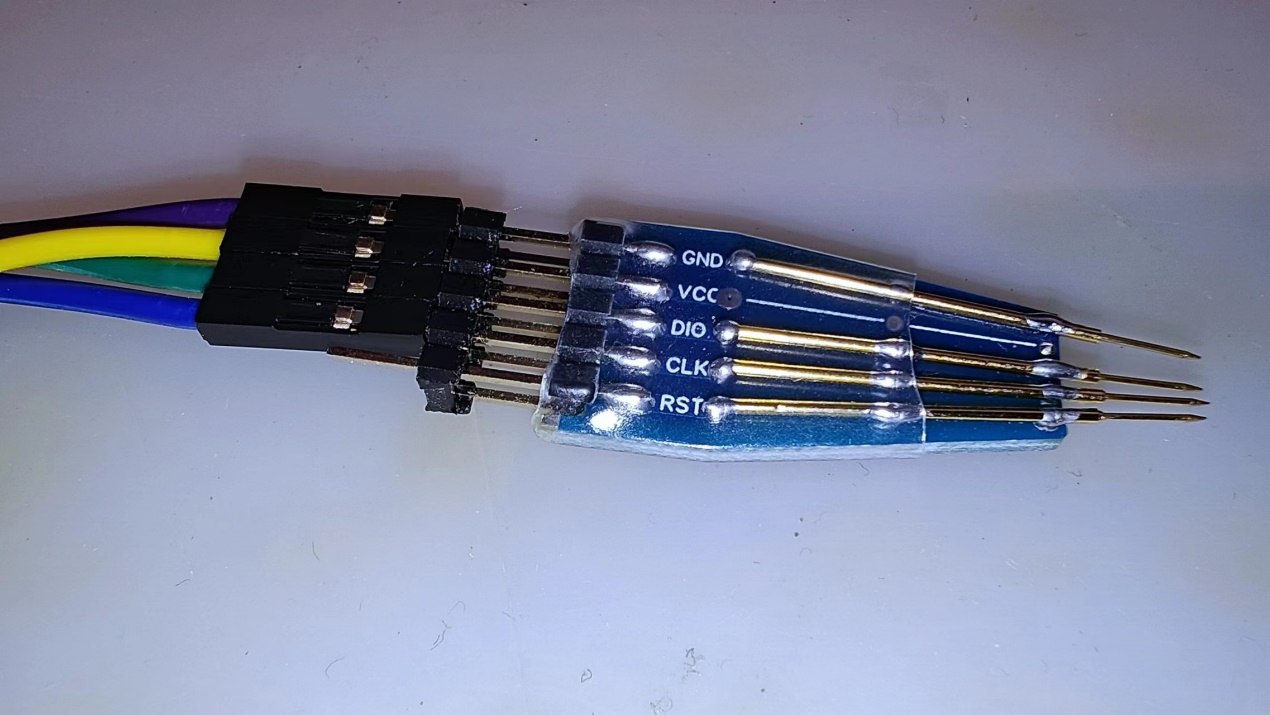
⑤ Programming Probe
If you have extra spring pins (usually a small pack contains 10), you can use the "programmer adapter board" PCB for programming.
The programmer probe adapter board has a slot at the rear to hold the 5P 2.54 header pins. After securing it, solder it by adding solder.
Insert the spring pin into the sleeve, then align the tail of the sleeve with the last row of circular pads on the adapter board and solder it. Place the probe in the direction of the indicator line (note that only one solder point at the tail is soldered at this time). Then, press the programmer probe against the corresponding hole of the test pen and fine-tune the probe position to ensure good contact. Then solder the remaining points to fix it.
To prevent short circuits outside the probe adapter board, heat shrink tubing can be used to protect the adapter board.
5.3 Programming Method Instructions:
If you do not wish to use probe programming, you can solder thin wires for programming. Only SWD_CLK, SWD_DIO, and GND wires need to be soldered. If you have extra spring pins, you can use them with the PCB of the "programmer adapter board" for programming.
Note that VCC here refers to the MCU's operating voltage, 3.3V. Do not input 5V, otherwise the board may be damaged!
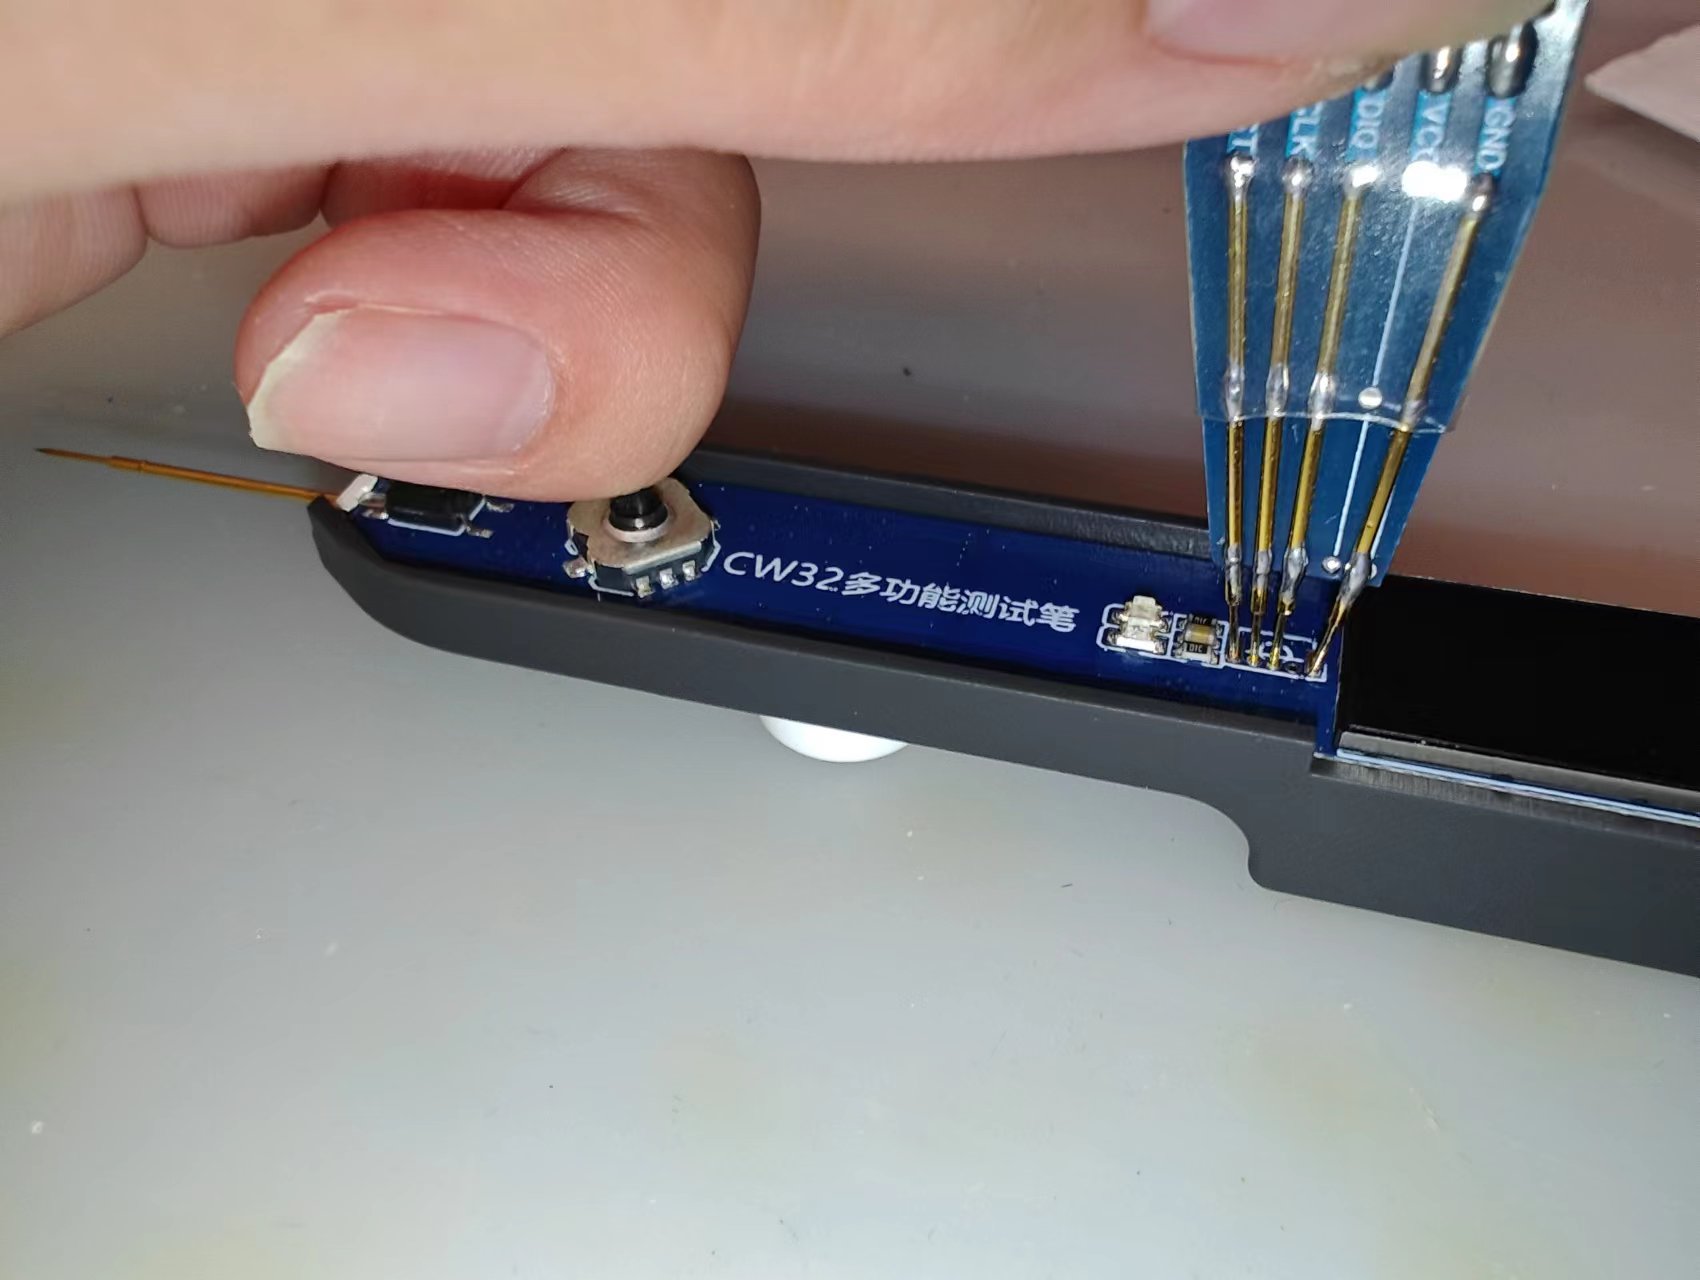
Regardless of the programming mode, before programming, you must press and hold the middle button of the five-way joystick to keep the system powered on until the program download is complete (you can use the back of your finger to press the switch as shown in the image above). Then, confirm that the chip ID can be recognized in the programmer and check the "Stop after Reset" checkbox (remember to check this; otherwise, you will need to manually power on and then manually reset after downloading for it to work properly). Then you can start downloading the program.

After downloading, release the hand holding the switch and press the middle button again to power on.
When powered on, the green indicator light will illuminate and then turn off. This method can be used to check if the programming was successful when the display screen is not soldered.
VI. Hardware and Software Integration and Testing
After the hardware has completed its individual debugging and testing, it can be integrated with the software for further integration. Hardware and software integration is often the most time-consuming and labor-intensive part of a project. During this process, the hardware and software need to be optimized and tested again based on the data and phenomena obtained from the tests.
Since this test pen generates a large amount of data during hardware and software integration and testing, and this article is only for the purpose of showcasing the project's results and for learning purposes, this article only presents the final test data after the test pen has completed all hardware and software integration, for performance indicator reference.
Remember to calibrate before the first use after downloading the program!
The following data are all measured values after calibration.
1. Voltage Input Measurement Mode:
The voltage to be measured is simulated by the digitally controlled power supply and input through the pen tip. A multimeter is used to measure the AIN node (simulating the signal input to the microcontroller's ADC after front-end processing; AIN nodes/networks mentioned later refer to this location and will not be explained separately). The measured data is then compared with the data obtained by the test pen.
The following are the test data:
Note: Measurements were taken using Hardwood Classroom equipment and virtual instrument software.
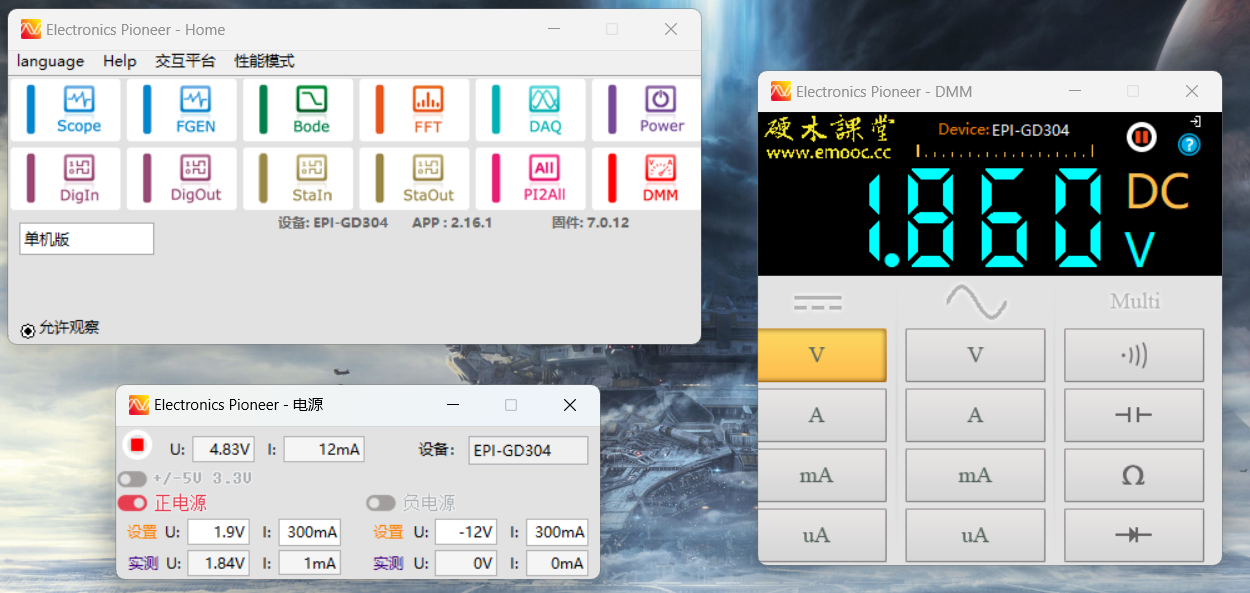
Actual output voltage: 1.84V
AIN node voltage: 1.860V
Test pen display voltage (this data will be processed by software to eliminate system constant error): 1.832V

Actual output voltage: 15.07V
AIN node voltage: 1.532V (due to the voltage being greater than 2.5V, it will be attenuated by X10)
Test pen display voltage (after eliminating system constant error): 15.110V
Explanation: According to actual product testing, the value input to AIN will have a positive offset of approximately 0.2V. The software will subtract this error value before displaying.
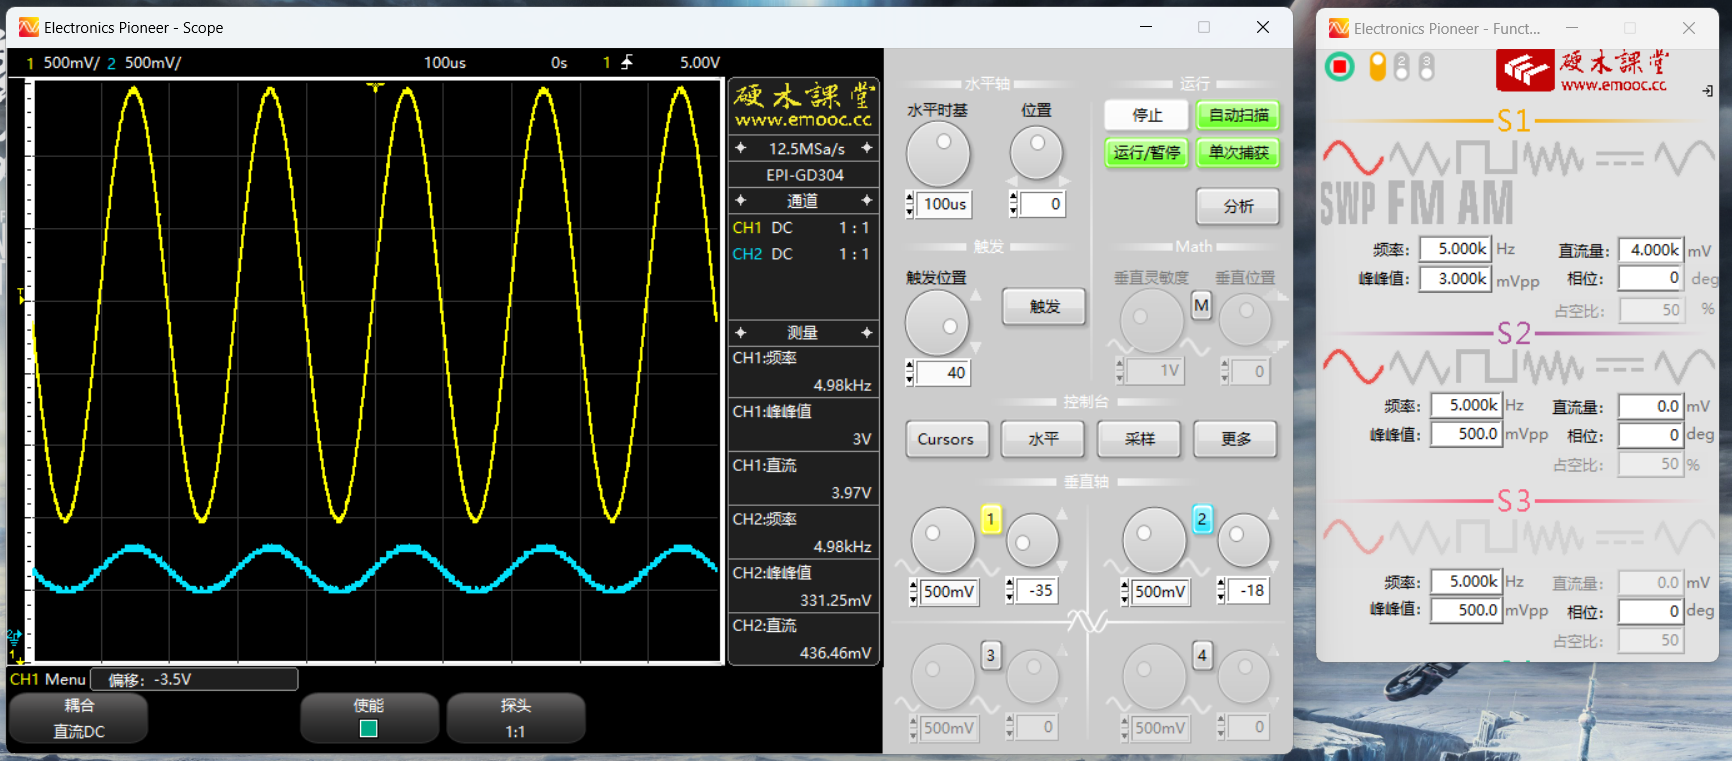
Supplementary test:
To better demonstrate the simulation performance of the test pen, a sine wave will be input through the pen tip using a signal generator, and the input signal and AIN node signal will be displayed using a dual-trace oscilloscope. In the following test, the signal generator S1 signal will be input to the test pen tip and connected to oscilloscope channel 1, and the test pen AIN node signal will be connected to oscilloscope channel 2.

Peak voltage less than 2.5V: (Working at X1 range)
Note: The two waveforms are almost identical. Since all settings for both channels of the oscilloscope are the same, the two waveforms overlap on the interface.
Waveform data can be compared based on the oscilloscope's automatic measurement data.
Valley voltage greater than 2.5V: (Working at X10 range)
Waveform data can be compared based on the oscilloscope's automatic measurement data.
It should be noted that even when the test probe is suspended in the air, a voltage may still exist. This is due to the probe being floating (the probe tip is in a high-resistance state). This is not a hardware problem, as the same situation occurs when the multimeter probe is suspended.
2. PWM output mode
In this test, simply connect the test probe tip to the oscilloscope and compare the output parameters set by the test probe with the parameters actually measured by the oscilloscope.

Test pen settings: Frequency 20kHz, duty cycle 90%;
Oscilloscope measured parameters: Frequency 19.71kHz, duty cycle 90.04%;
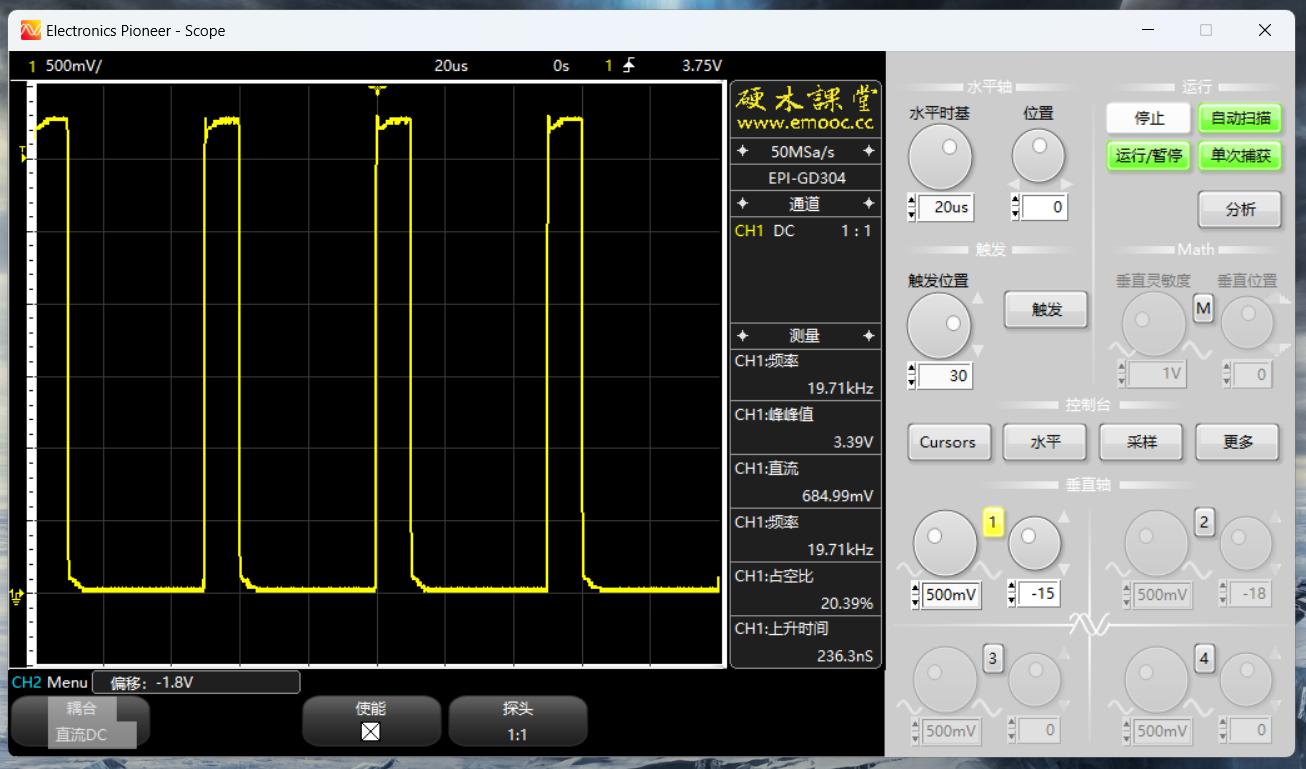
Test pen settings: Frequency 20kHz, duty cycle 20%;
Oscilloscope measured parameters: Frequency 19.71kHz, duty cycle 20.39%.
The maximum output frequency of the multi-functional test pen is measured below:

Test pen settings: Frequency 100kHz, duty cycle 50%
; Oscilloscope measured parameters: Frequency 99.55kHz, duty cycle 49.97%.
3. DC Output Mode
: This test uses a multimeter to measure the output voltage:
Unit: V.
Set voltage,
actual output: 1.0
0.97
1.5
1.49
2.0
2.02
2.5
2.54
3.0
3.07
3.5 3.53 4.0
4.05 4.5 4.58 5.0 5.11 5.5 5.63 Due to the lack of negative feedback, there will be some error (recommended for use within the 1-5V range). 4. Continuity Detection Mode: This mode allows direct measurement of small resistances using a test probe for functional testing. Note that the range in this mode is 0-200Ω (this is the design range; higher resistances can actually be measured). Unit: Ω. Design resistance value . Multimeter measured resistance value. Test probe displayed resistance value : 0 0 0 10 9.7 10 20 19.9 19 30 29.7 30 40 39.6 40 50 49.4 50
60
59.4
60
70
69.5
70
80
79.5
81
90
89.3
90
100
99.1
100
110
109.1
110
120
119
119
130
129
130
140
139.1
140
150
148.8
150
160
158.7
160
170
168.9
170
180
178.6 If the
177
test pen displays OL, it means the set range exceeds 200 ohms. If a larger range is needed, please modify
the R below the program code to represent the set threshold resistance (customizable). If the resistance is below the threshold, an alarm will sound.
5. Diode Mode:
This mode directly uses the test pen to test the diode's forward voltage and compares it with the multimeter's test value:
Unit: mV
Test Component
Multimeter Test Value:
Test Pen Display Value:
Sample Germanium Tube
278
273
Sample Silicon Tube
599
601
Red LED
1740
1763
Yellow LED
1897
1917
Blue LED
2568
2820
6. For calibration mode,
the pen tip needs to be reliably shorted to the COM terminal. It is recommended to use a connector or breadboard for connection (do not hold it by hand, as this may cause unstable contact resistance). Then enter this mode (be sure to short-circuit before entering calibration mode; the automatic calibration program will begin immediately upon entering calibration mode). After entering the mode, the system will automatically measure at X1 and X10 levels, record the zero-point error, and store it in Flash.
Normally, because the data is stored in Flash, the test values are accurate for a long period after calibration. However, if a component inside the circuit experiences parameter drift, it will still cause errors. Therefore, if the test data deviation is large, recalibration can be performed. However, if the data remains unstable after multiple calibrations, a hardware fault should be suspected.
VII. Hardware Design Summary
Hardware design may seem very complex, but if followed properly, it can be a very enjoyable process. During the design, testing, optimization, and integration of this project, I gained a deeper understanding of mixed-signal circuits, and the final result exceeded my design expectations.
While this project is relatively complete in functionality and can basically meet the basic needs of hardware testing, its accuracy in various aspects is not high. Therefore, I plan to release an upgraded version with better parameters next year. This is the first step I've taken.
Finally, I need to clarify that although I have conducted relatively complete testing on the hardware and software of this project, I still cannot guarantee that it will be completely problem-free. Like the classic "fried rice in a bar" joke, problems may still occur in actual use due to different operations. I welcome timely feedback so that I can optimize the project further.
VIII. Software Program:
The software code was written by Mr. Song (@境遇的你).
This project uses the FreeRTOS operating system.
Considering the length and code format of open-source projects, please refer to the project documentation for code explanations:
CW32 Multifunctional Test Pen - Feishu Cloud Documentation (feishu.cn).
The project code may be updated later; please keep an eye on the Gitee repository:
https://gitee.com/multifunction_test_pen/test_pen.
The truth table for the analog switch in different modes is as follows:
Control Pin Mode
Level Measurement 10x
Level Measurement 1x
PWM Output
DC Output
On/Off/Diode Detection
ASW1
L
L
H
L
L
ASW2
L
H
L
L
L (1x setting is H)
ASW3
L
L
H
H
L
ASW4
L
L
L
L
H
VOFA+ Serial Port Monitoring Assistant
Plugin Driver High-Degree of Freedom Host Computer
Official Website: VOFA-Plus Host Computer | VOFA-Plus Host Computer


 京公网安备 11010802033920号

 TCM1C106K8R