I. Project Introduction
This is a smart scale based on STM32 and HX711, with basic weighing functions; it has Bluetooth or Wi-Fi transmission capabilities, allowing users to view weighing information via a mobile phone; the mobile app needs to have weighing information storage capabilities and be able to analyze historical data; it weighs the scale when a heavy object is placed on it, and enters standby mode when the weight is below a certain value; the scale is powered by a lithium battery and includes a battery management circuit.
II. Onboard Resources

Figure 1-1 3D diagram of the smart scale circuit
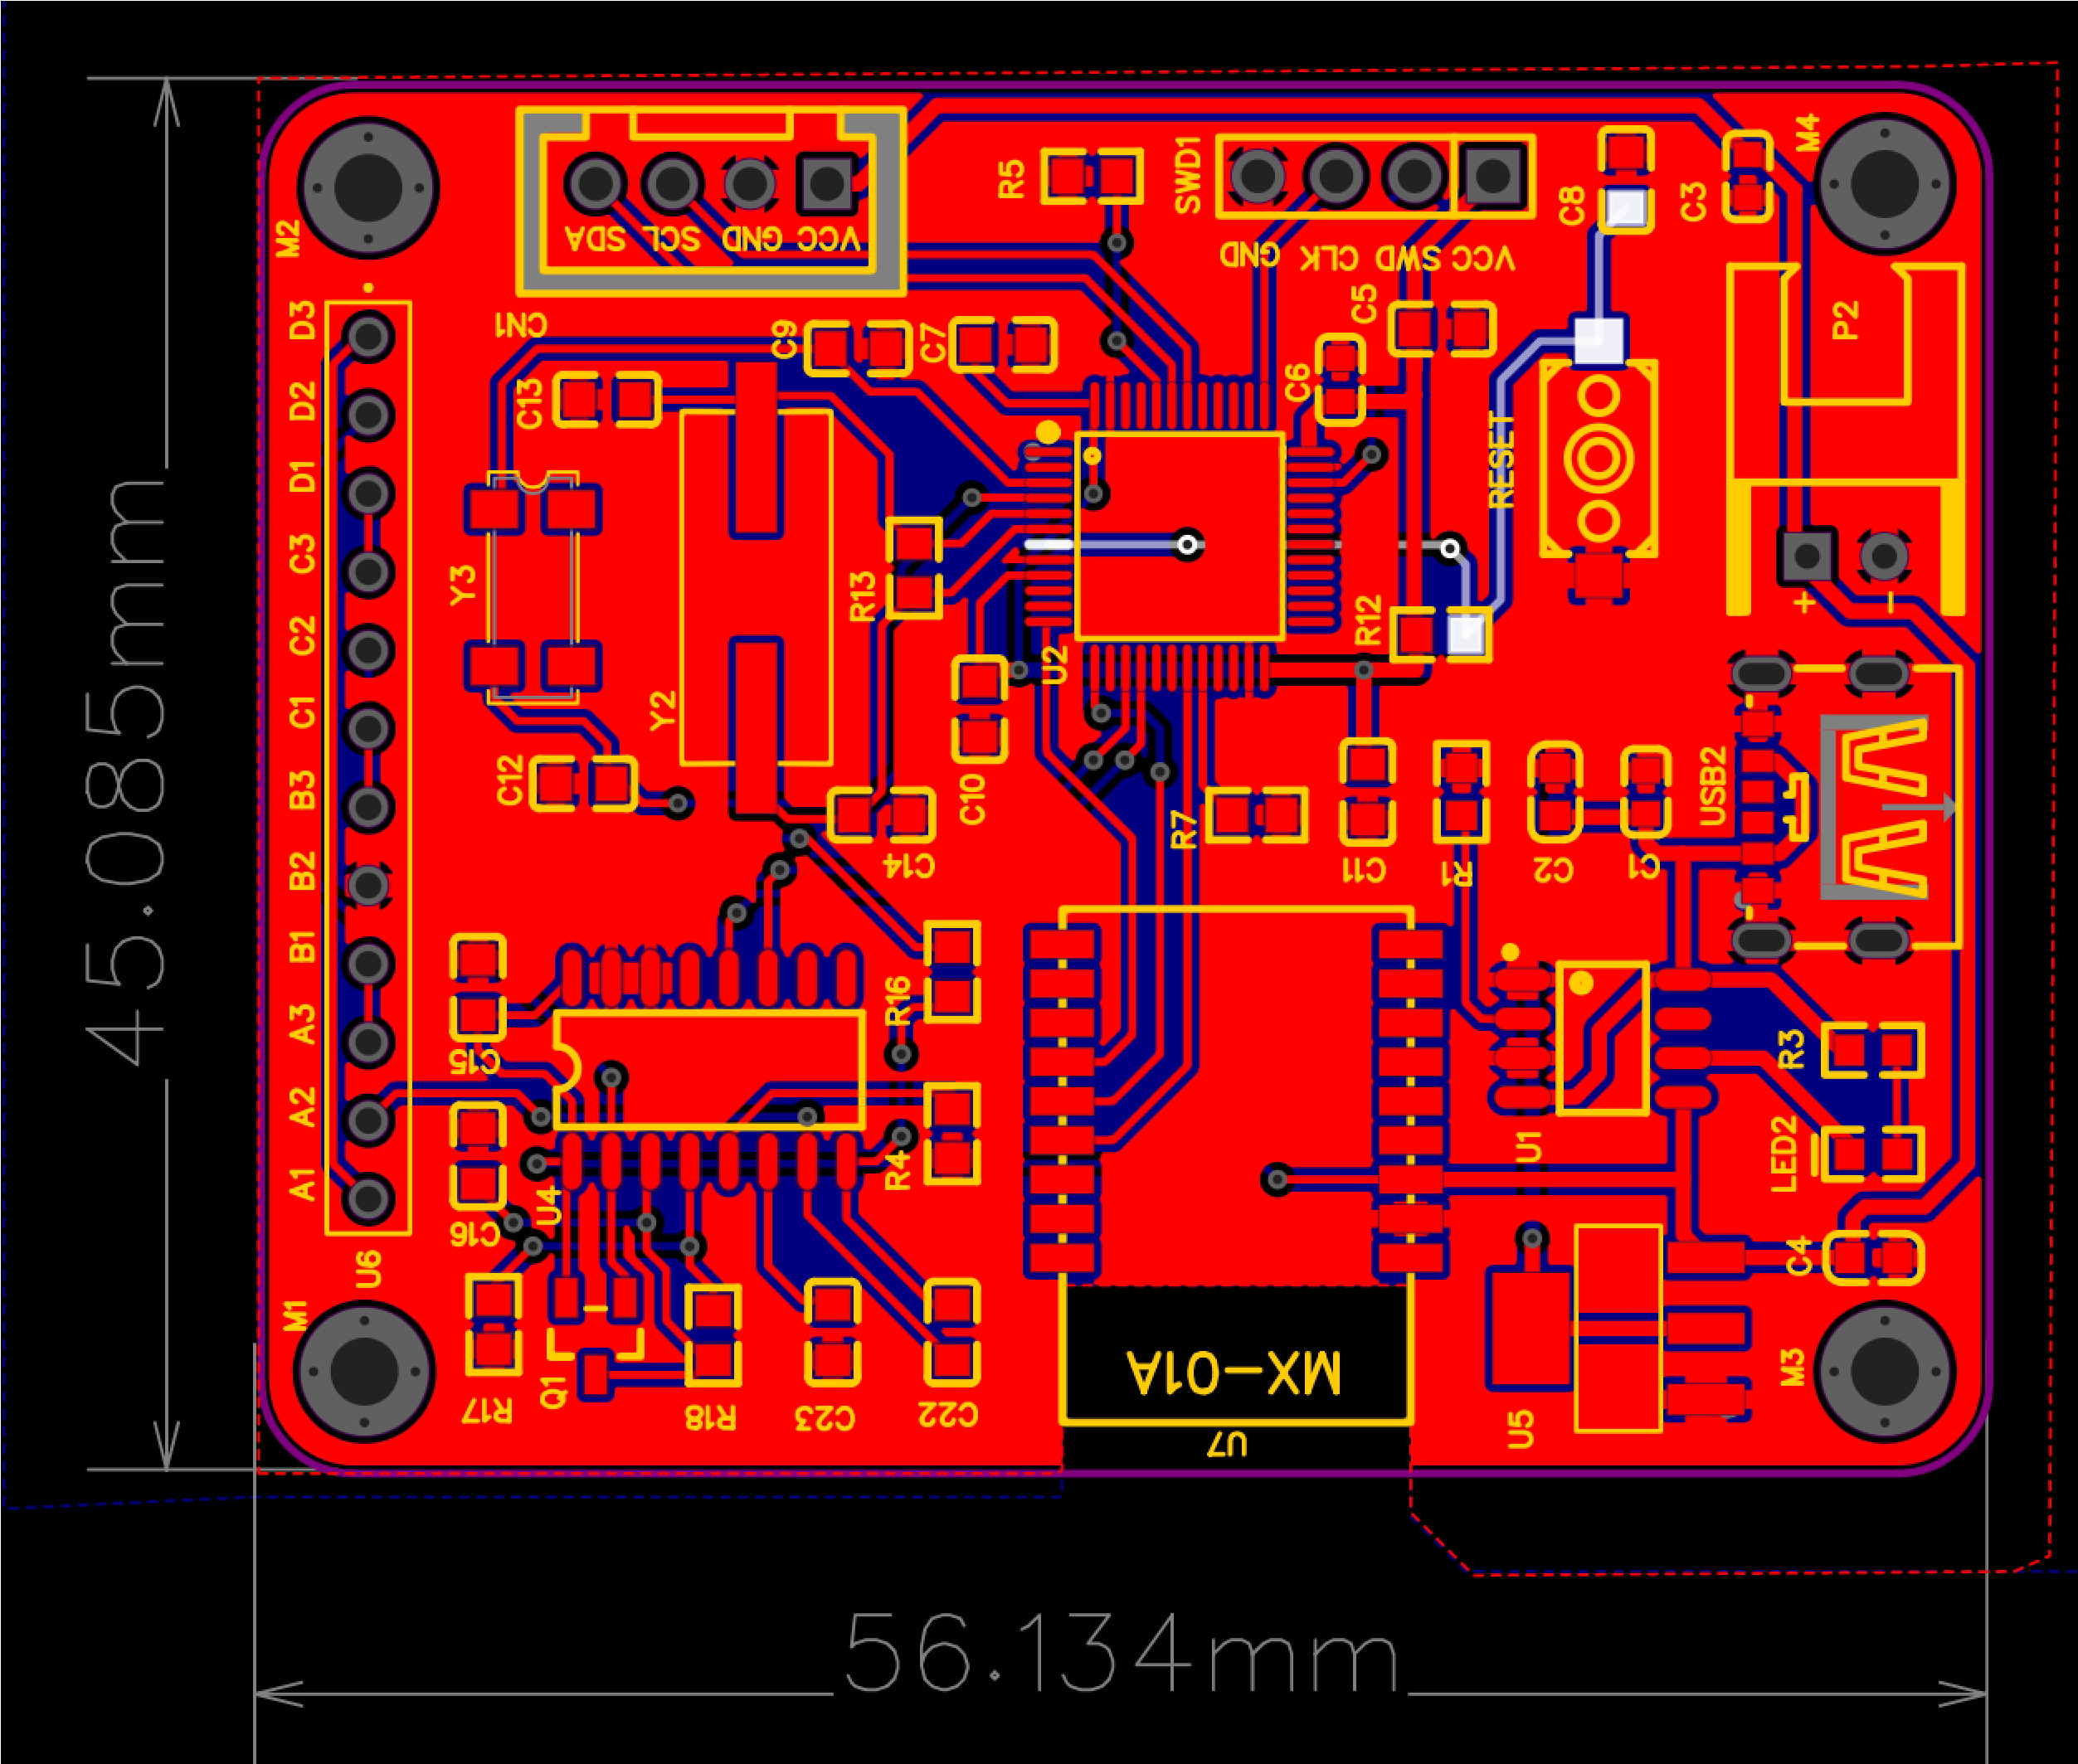
Figure 1-2 Plan view of the smart scale circuit
1. Main control chip: STM32F103C8T6
2. Power interface: TYPE-C
3. Buttons: One reset button
4. Weight measurement chip: HX711
5. Display Interface: OLED display with I2C protocol
6. Debugging Interface: SWD download and debugging interface
7. Communication: Communication with mobile phone via Bluetooth module
III. Design Principles
This solution uses HX711 as the weighing sensor processing chip, uses four pressure strain gauges to form a full bridge to measure weight, uses STM32 as the main control chip to communicate with HX711 to obtain the deformation of the pressure strain gauges and convert it into weight, and uses MX-01 Bluetooth module to communicate with the mobile phone. The mobile software is designed using WeChat mini-program, which can store weighing data and perform data analysis.
IV. Circuit Analysis
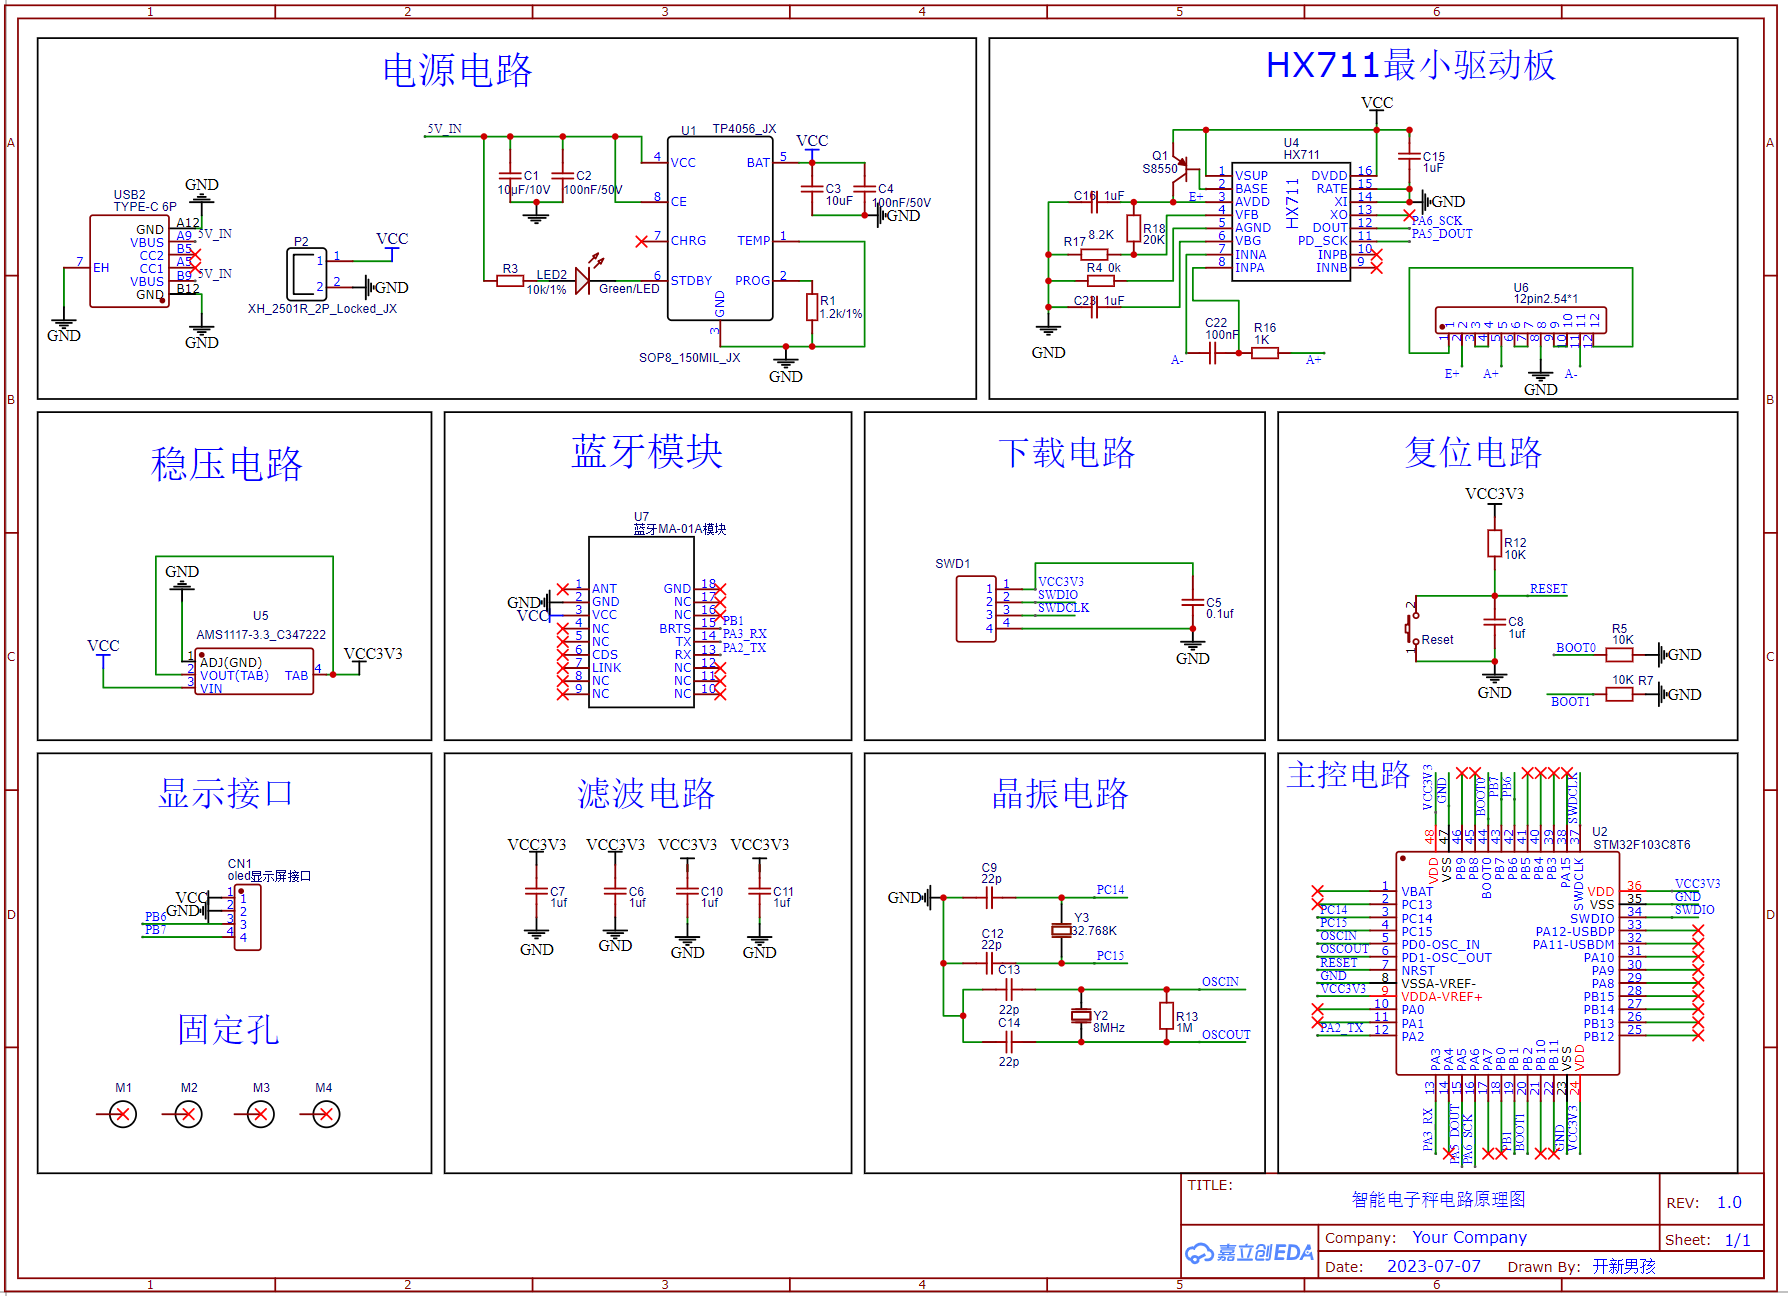
Figure 4-1 Overall Schematic Diagram of the Intelligent Electronic Scale
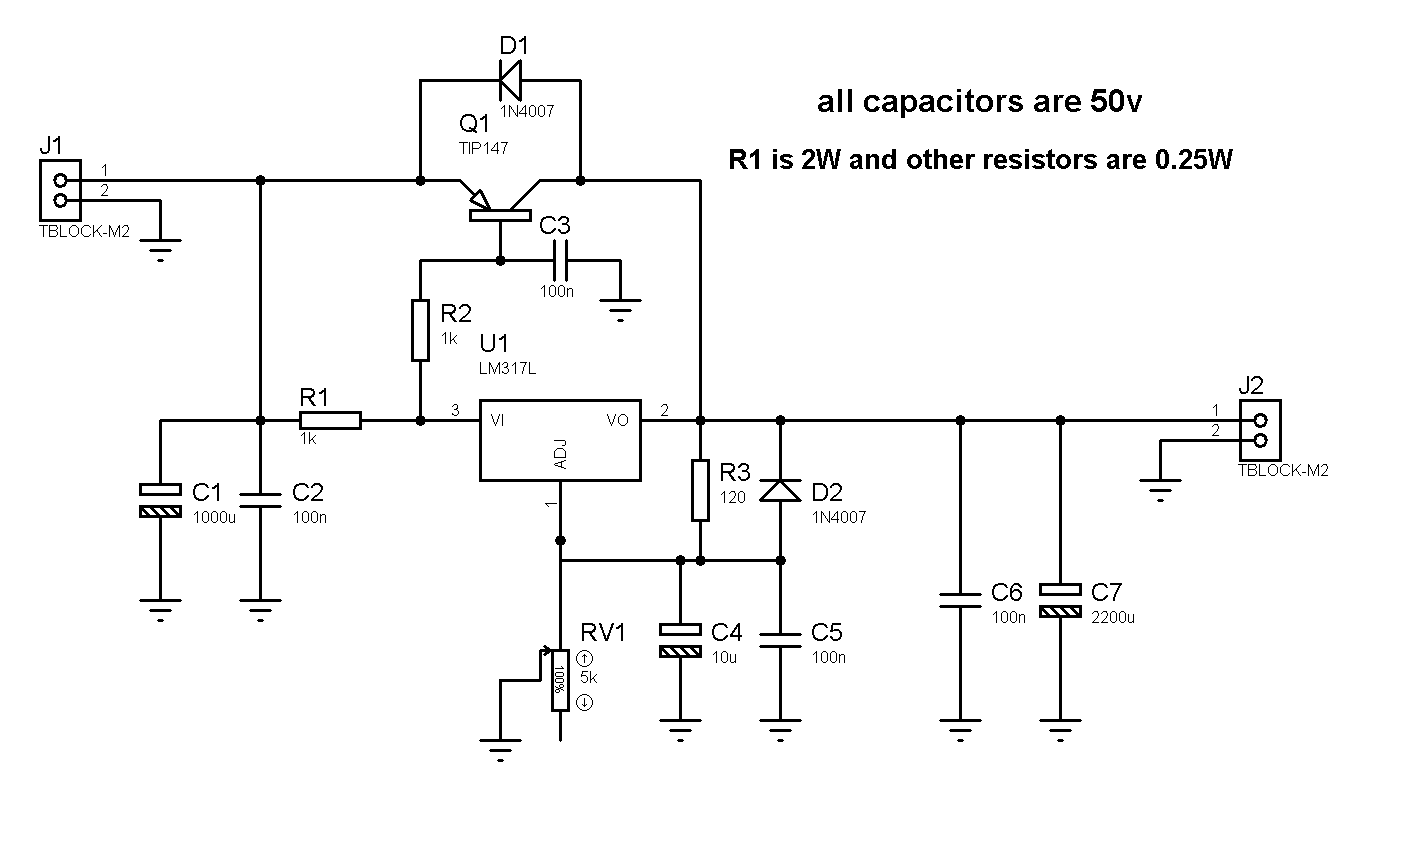
4.1 Power Supply Circuit The power
supply circuit mainly consists of a TYPE-C interface, a lithium battery module, and a charging circuit. LED2 serves as a charging indicator light; LED2 illuminates when charging is complete. TP4056 is the lithium battery charging management chip, and P2 is the lithium battery interface, using a 3.7V lithium battery for power supply.
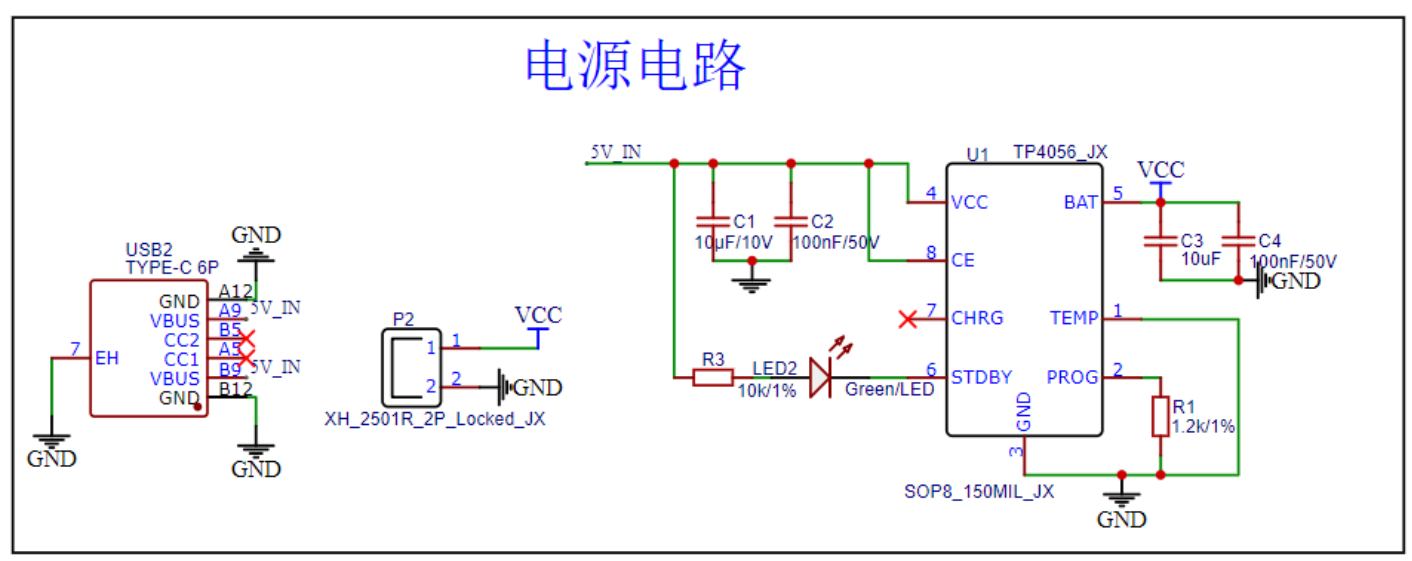
Figure 4-2 Power Supply Circuit of Intelligent Electronic Scale
4.2 Main
Control Circuit The main control circuit uses STM32F103C8T6 as the main control chip, with an operating voltage of 2.0V~3.6V, a maximum clock frequency of 72MHz, 64KB of flash memory and 20KB of SRAM. It is equipped with rich peripheral interfaces, including multiple general-purpose timers, a universal synchronous/asynchronous serial interface (USART), I2C and SPI interfaces to support various communication and external device connection needs. A 100nF capacitor needs to be added to the power input section of the chip for power filtering.
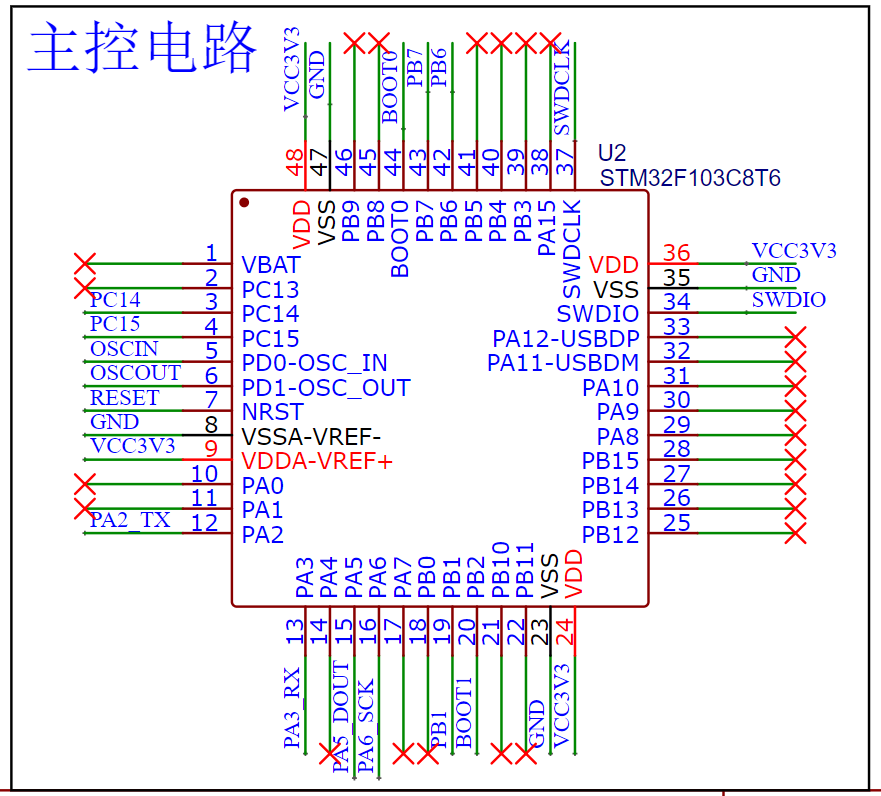
Figure 4-3 Main Control Circuit of Intelligent Electronic Scale
4.3 Crystal
Oscillator Circuit The crystal oscillator circuit uses a 32.768kHz low-speed crystal oscillator and an 8MHz high-speed crystal oscillator. In the software configuration, the chip's clock input source should also be configured as an external input.
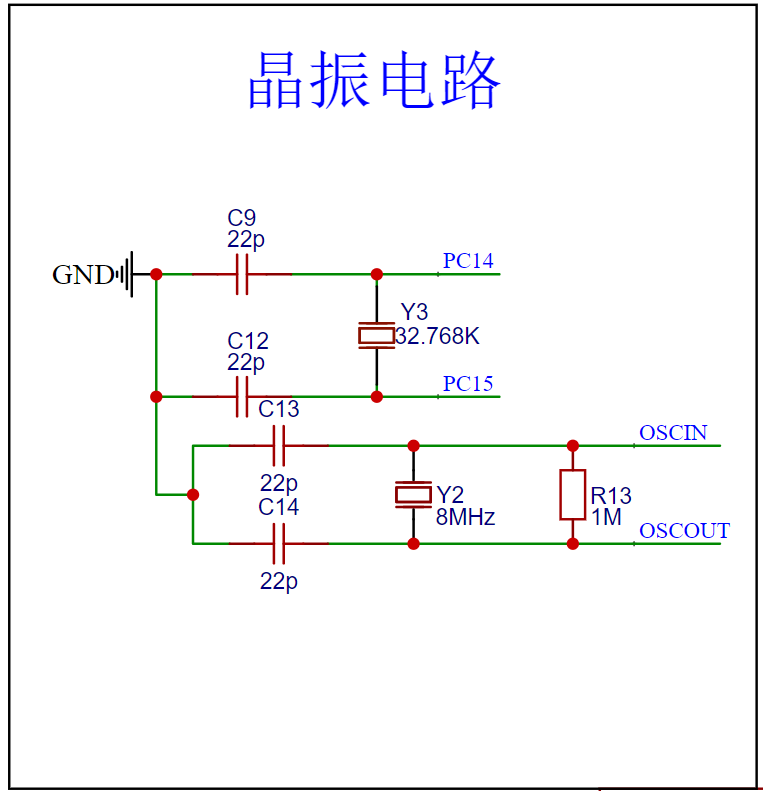
Figure 4-4 Crystal Oscillator Circuit of Intelligent Electronic Scale
4.4 Weighing
Circuit The weighing circuit uses the HX711 as the analog-to-digital converter chip. The HX711 is a precision analog-to-digital converter chip widely used in weight measurement and weighing applications. It is particularly suitable for various weighing systems requiring high precision and stability. This chip suppresses external interference and noise during measurement, thus providing more reliable measurement results. It converts analog signals into digital data through a digital interface (such as SPI or a simplified serial interface), facilitating communication with the microcontroller.
The pressure sensor is connected via a full-bridge connection and is connected to the E+, A+, GND, and A- interfaces of the HX711 chip via four wires, as shown in Figure 4-6.

Figure 4-5 Weighing
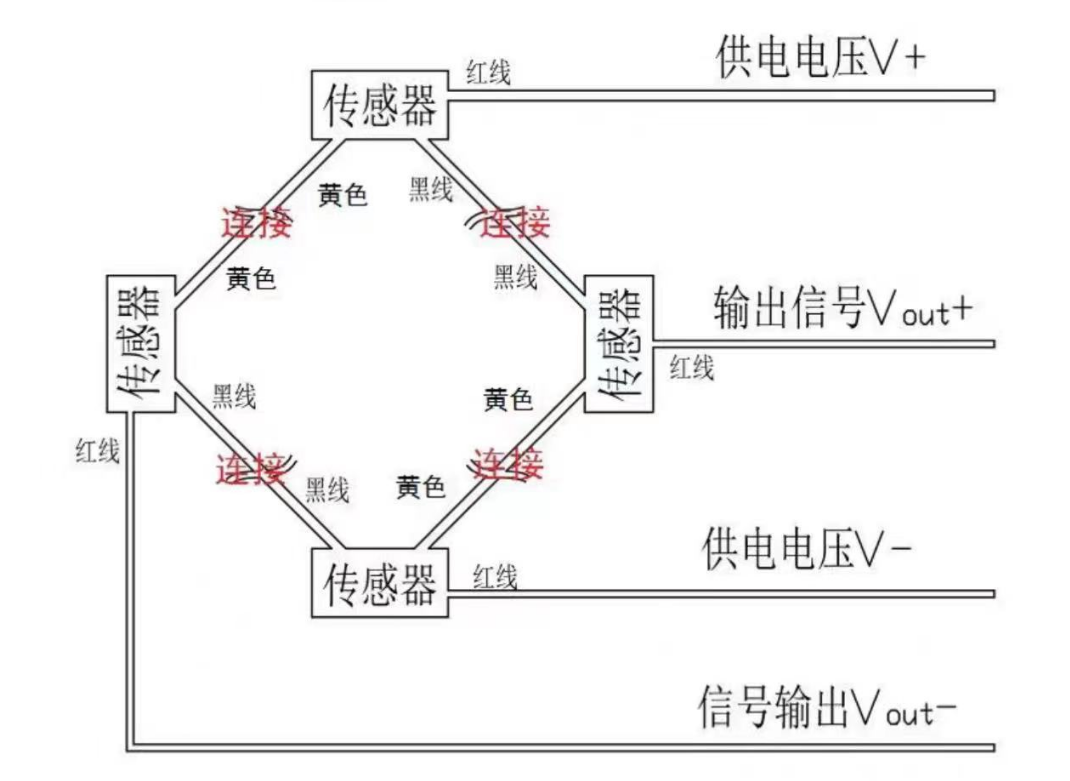
Circuit 4-6 Pressure Sensor Connection Circuit Figure
4.5 Voltage
Regulator Circuit The voltage regulator circuit uses the AMS1117 as the voltage regulator chip, outputting 3.3V. The AMS1117 is a linear voltage regulator chip commonly used in electronic circuits to provide stable voltage output. It is a miniature packaged low-dropout regulator, typically used to step down a higher voltage source (such as a battery or power adapter) to a stable lower voltage to power other circuits or devices.

Figure 4-7 Regulator Circuit
4.6 Communication Circuit
The smart scale communicates with a mobile phone via a Bluetooth module. The Bluetooth module uses MA-01A, employing a BLE5.2 Bluetooth interface. It is a small connector with a test communication distance of 100m+, and the module's transmit power is 5dBm. The module connects to the main control circuit via a serial port for transparent transmission.
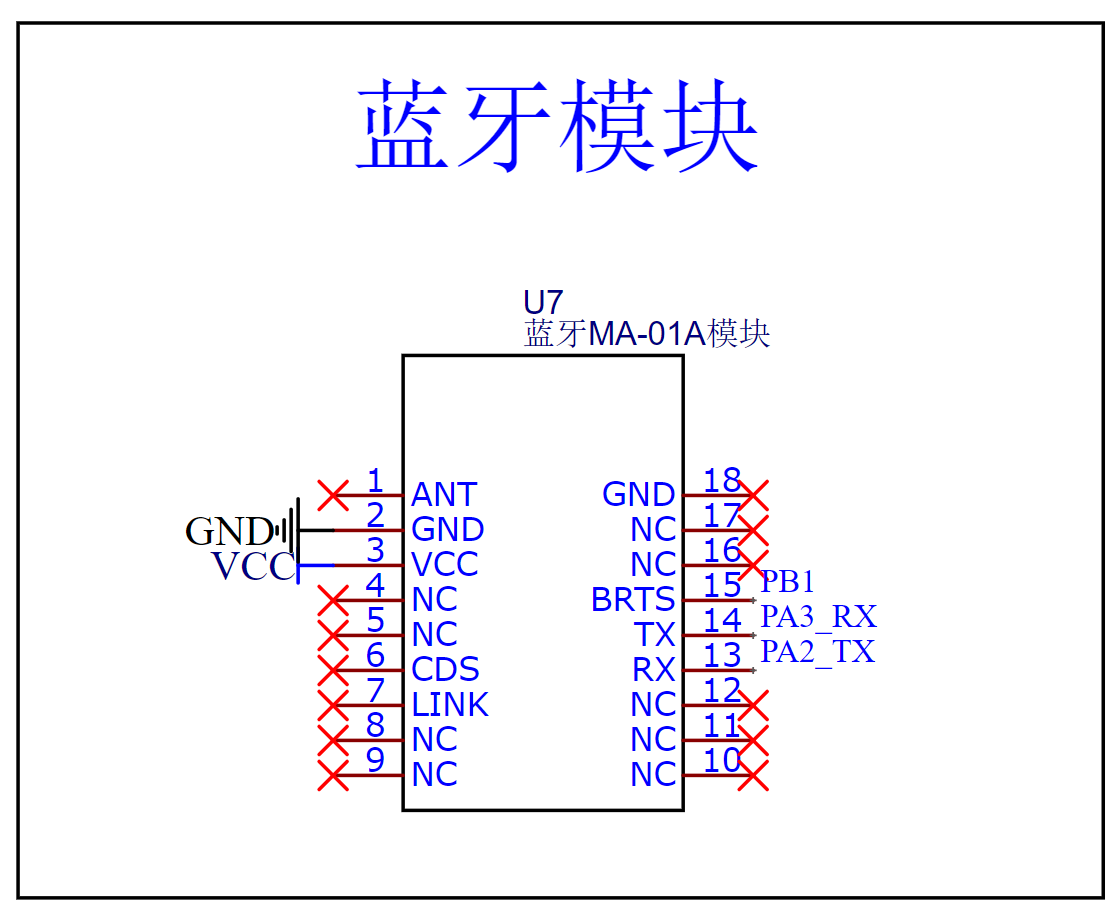
Figure 4-8 Bluetooth Circuit
4.6 Reset
Circuit The reset circuit is activated when the Reset button is pressed, pulling the main control's RESET pin low and entering a reset state. Releasing the Reset button returns the main control's RESET pin to a high level, and the system resumes operation, completing the reset.

Figure 4-9 Reset Circuit
4.7 OLED Display Interface
The project uses an OLED as the display to show weight information. The OLED display module communicates with the main control chip via the I2C protocol, connecting to PB6 and PB7 of the main control chip. PB6 is the clock line, and PB7 is the SDA signal line.

Figure 4-10 OLED Display Interface
V. Embedded Software Analysis
5.1 Clock Configuration
The main control chip uses STM32CUBE for clock configuration, as shown in Figure 5-1. During configuration, it is important to switch the clock input source to an external input, i.e., HSE, to achieve a maximum clock frequency of 72MHz.
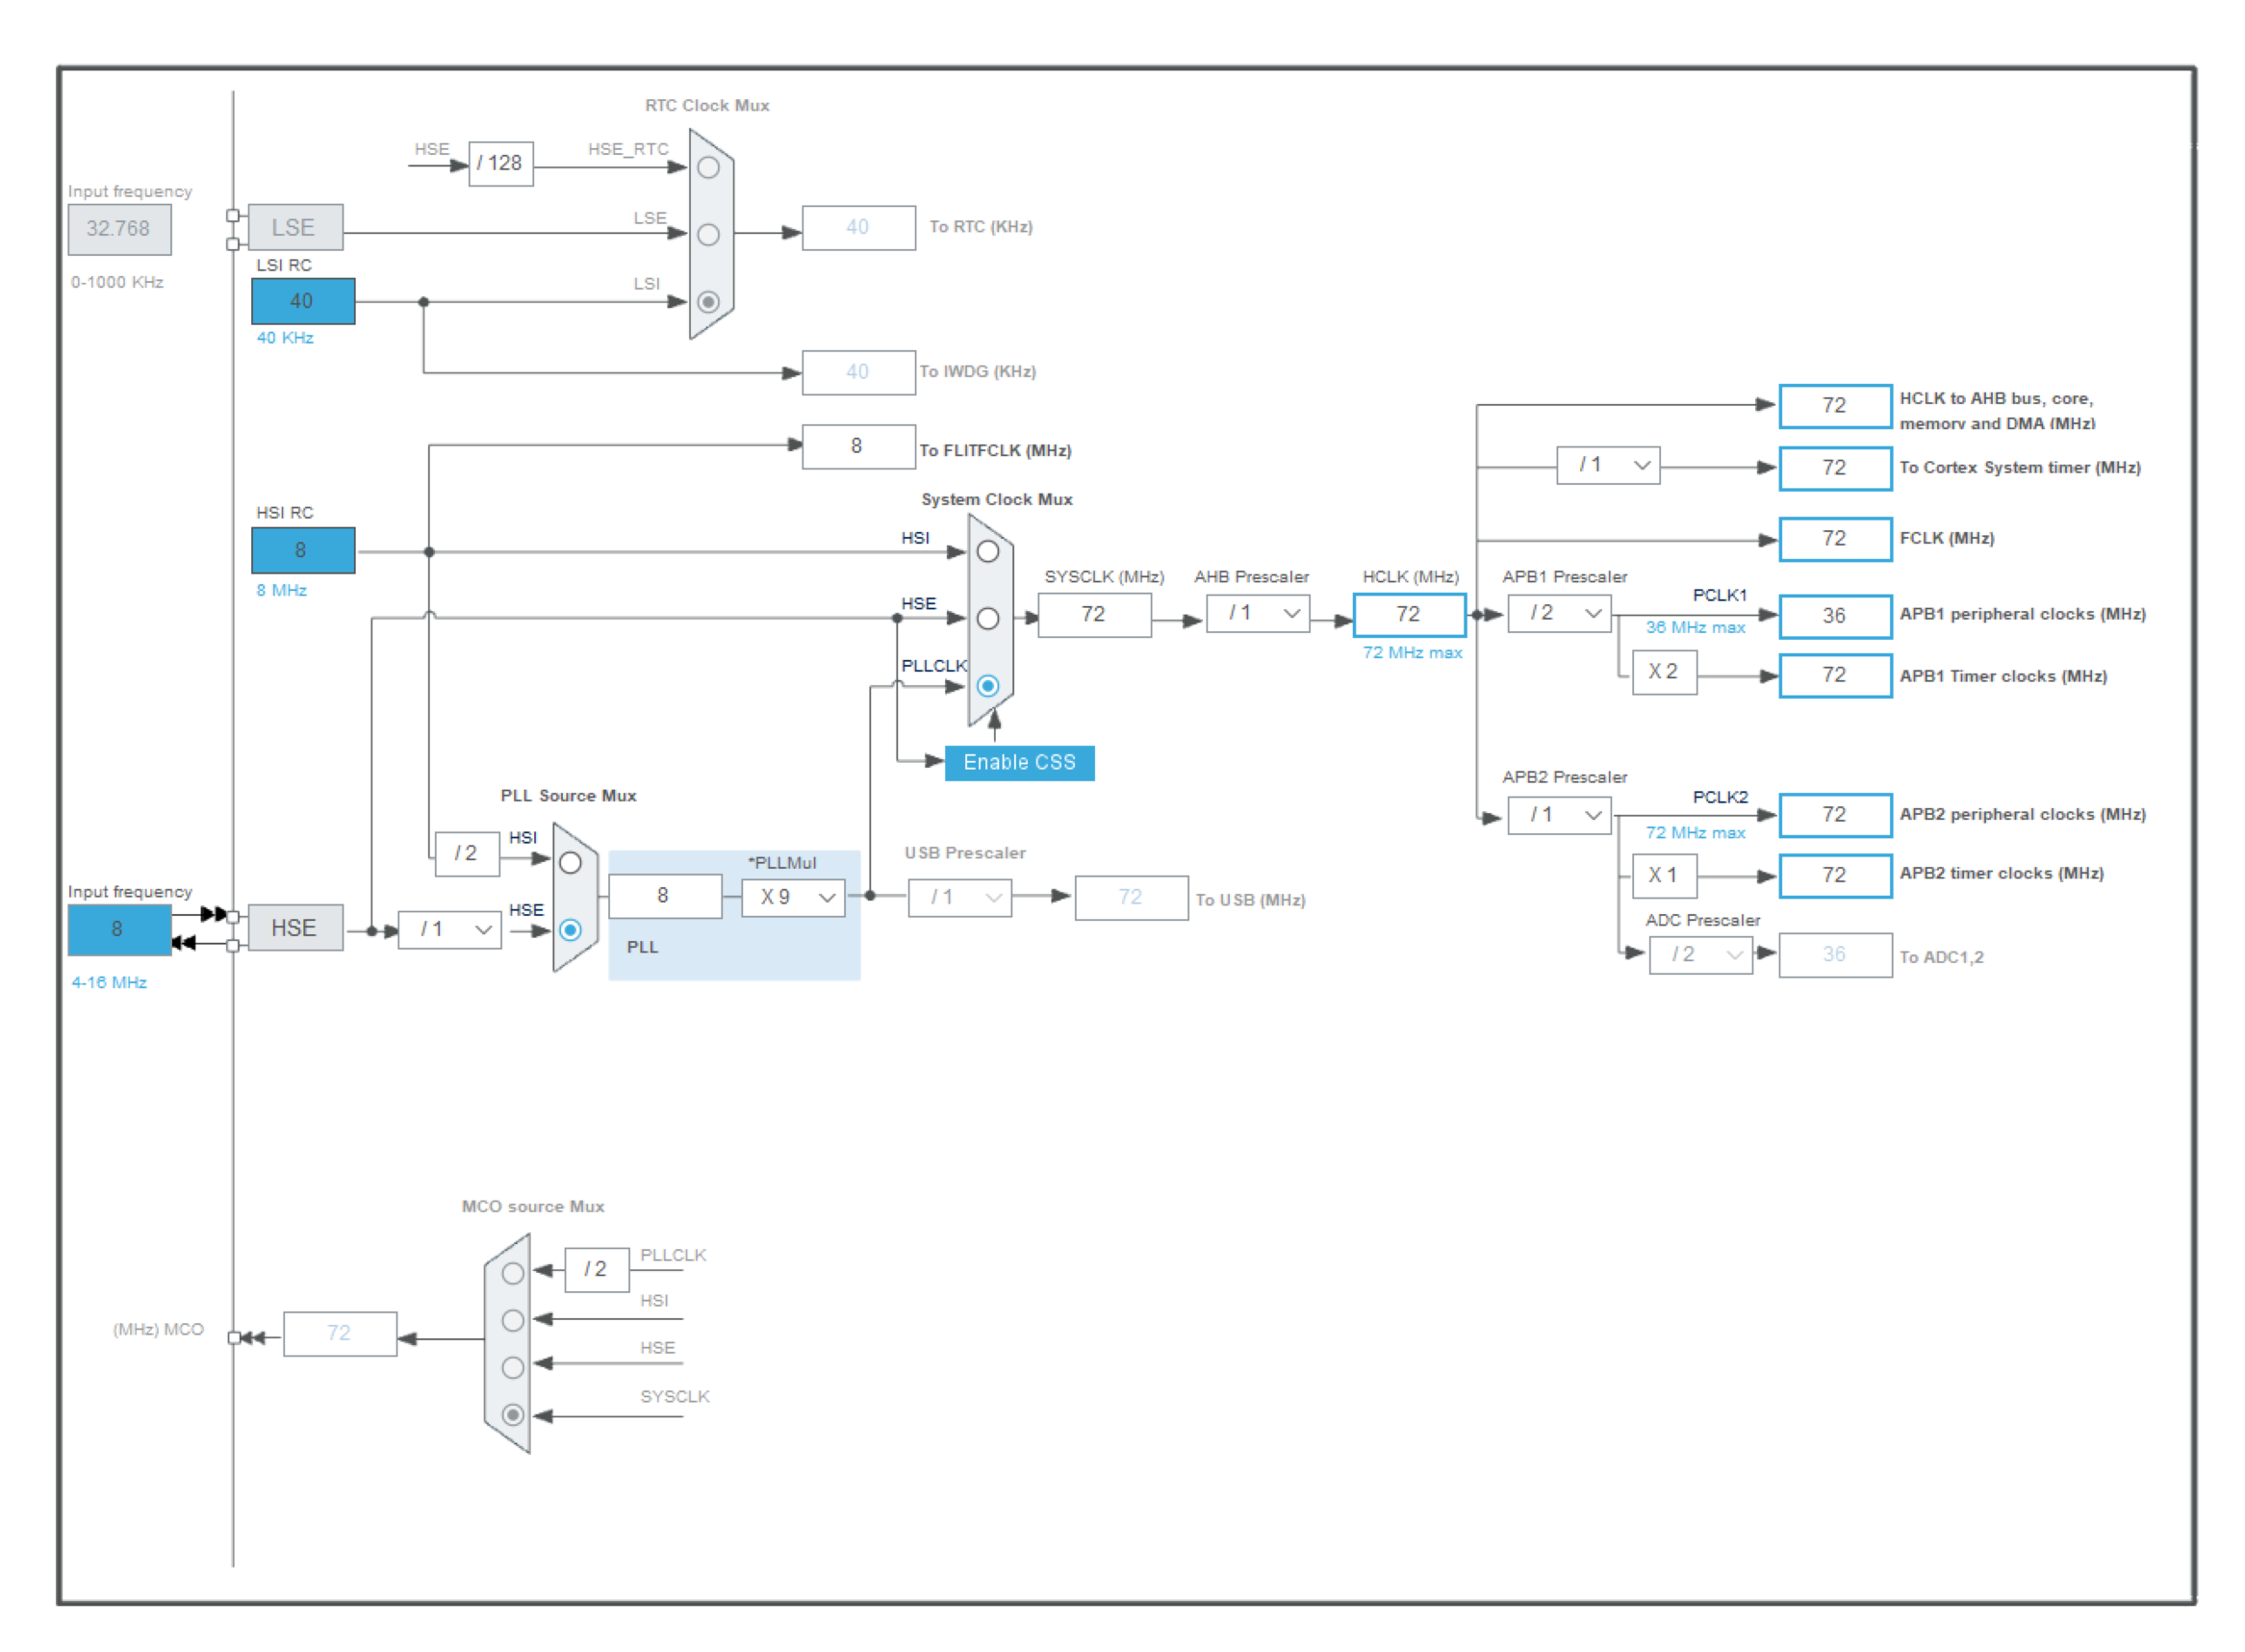
Figure 5-1 Clock Tree
5.2 Core Code Analysis
The complete embedded code is attached. Here, the core code in the attachment will be explained:
1. The HX711_Read(void) function in main.c reads the sensor value from the hx711 module.
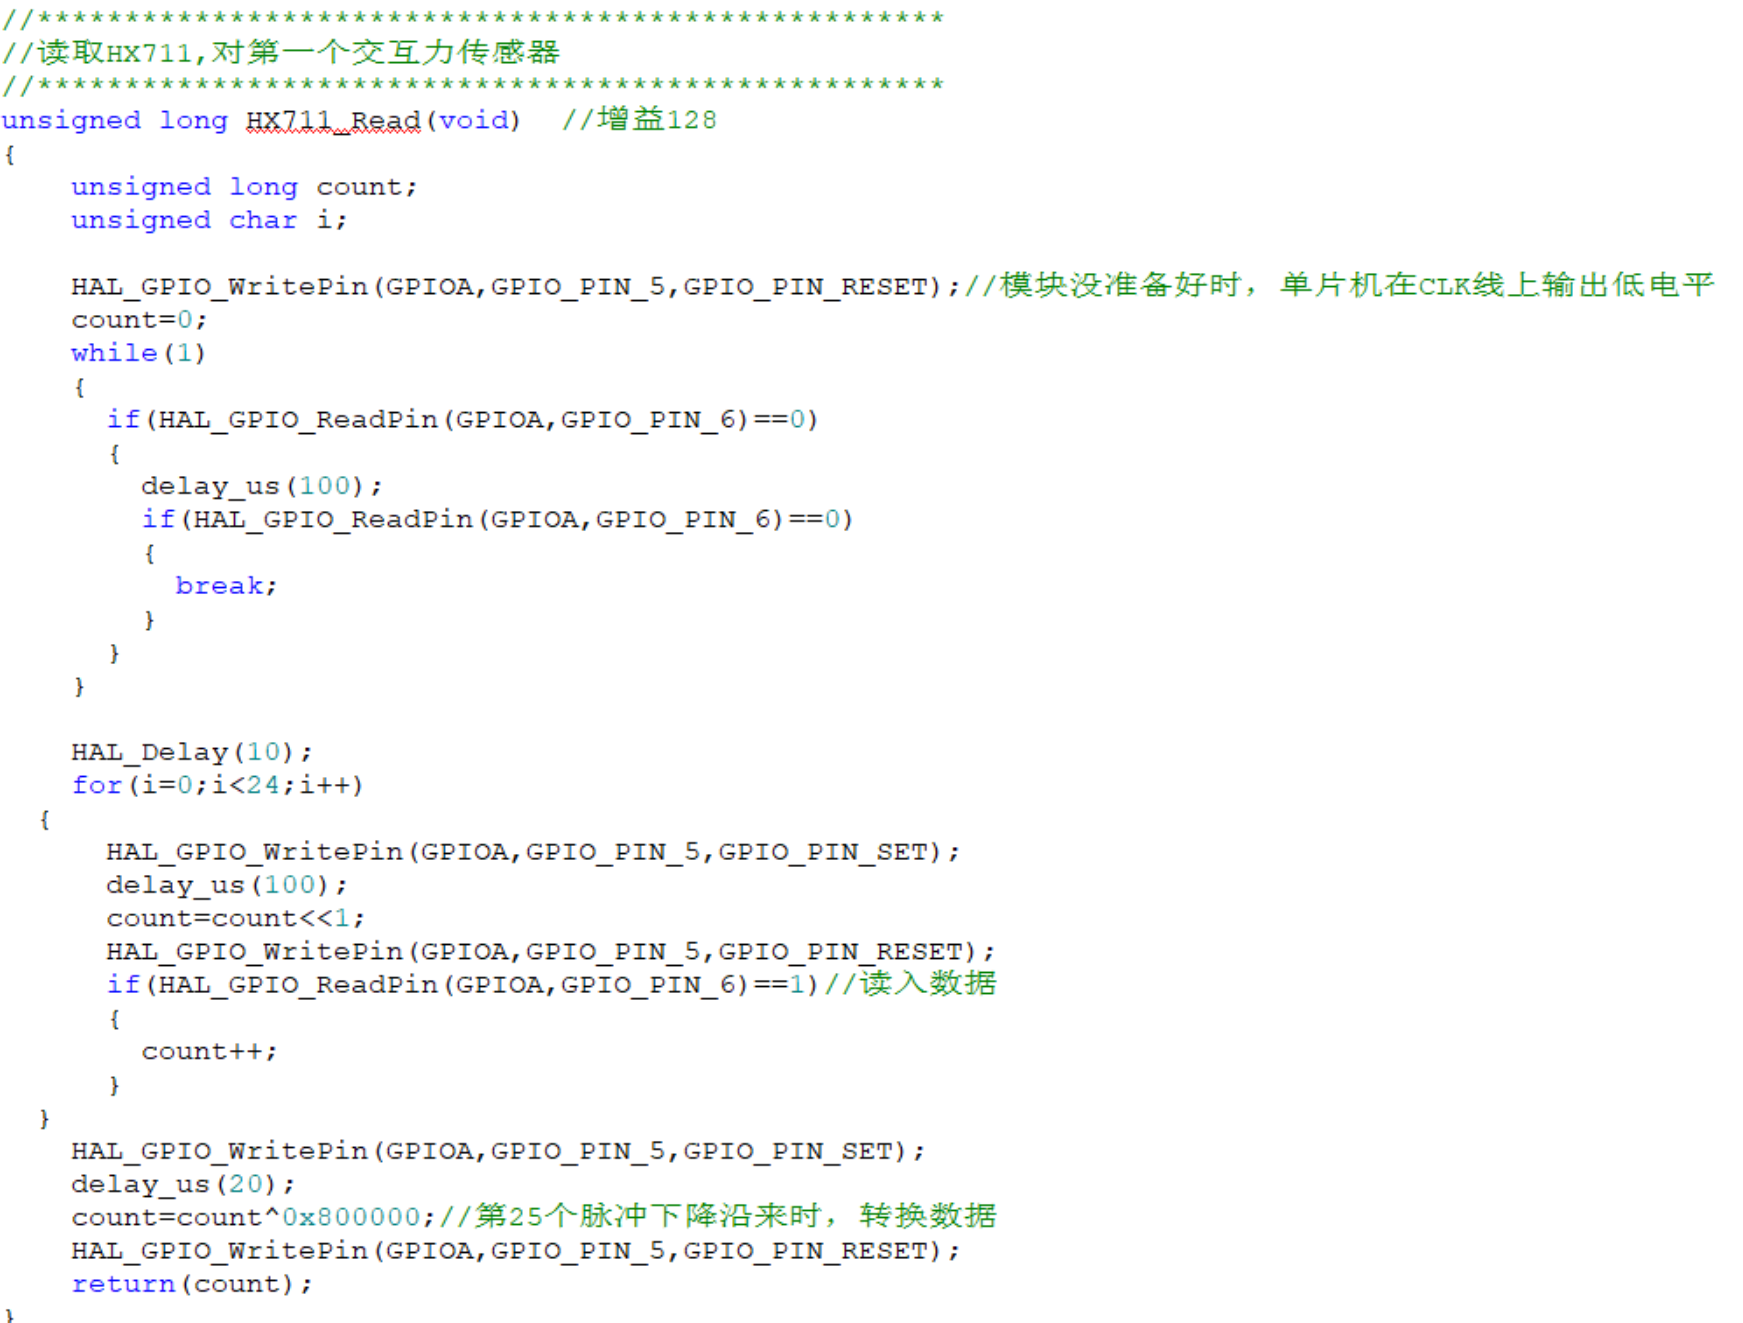
Figure 5-2 Sensor Pressure Reading Code
2. The Get_Weight(void) function in main.c converts the pressure sensor value into weight and stores it. The pressure sensor data is basically linear and can be directly calibrated linearly. If higher accuracy measurement results are desired, interpolation calibration is required.
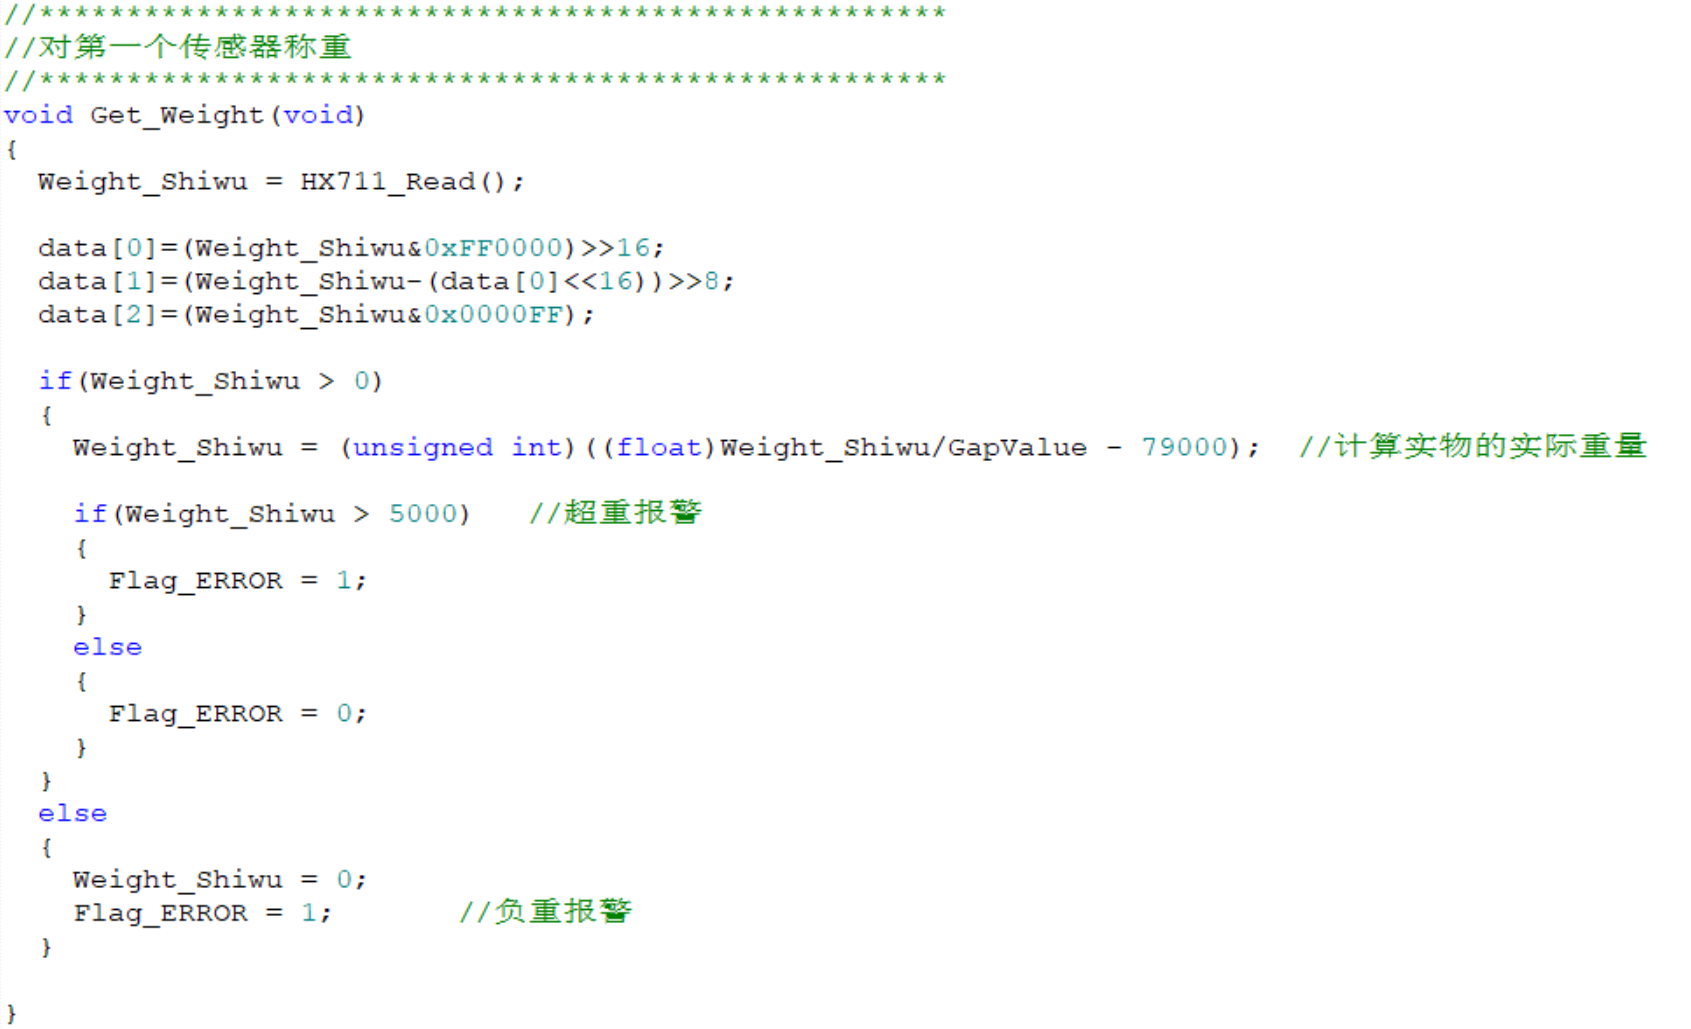
Figure 5-3 Sensor pressure processing code
3. OLED display string code. The way the OLED displays strings and numbers is to first use the image extraction software PCtoLCD to obtain the hexadecimal encoding value of each string, and then write it into the microcontroller code file as shown in Figure 5-5. This project mainly uses some strings. Binary images can also be extracted using image extraction software and displayed on the OLED. At the same time, if you want to display animation, multiple GIF images can be extracted using image extraction software and placed in the code file.
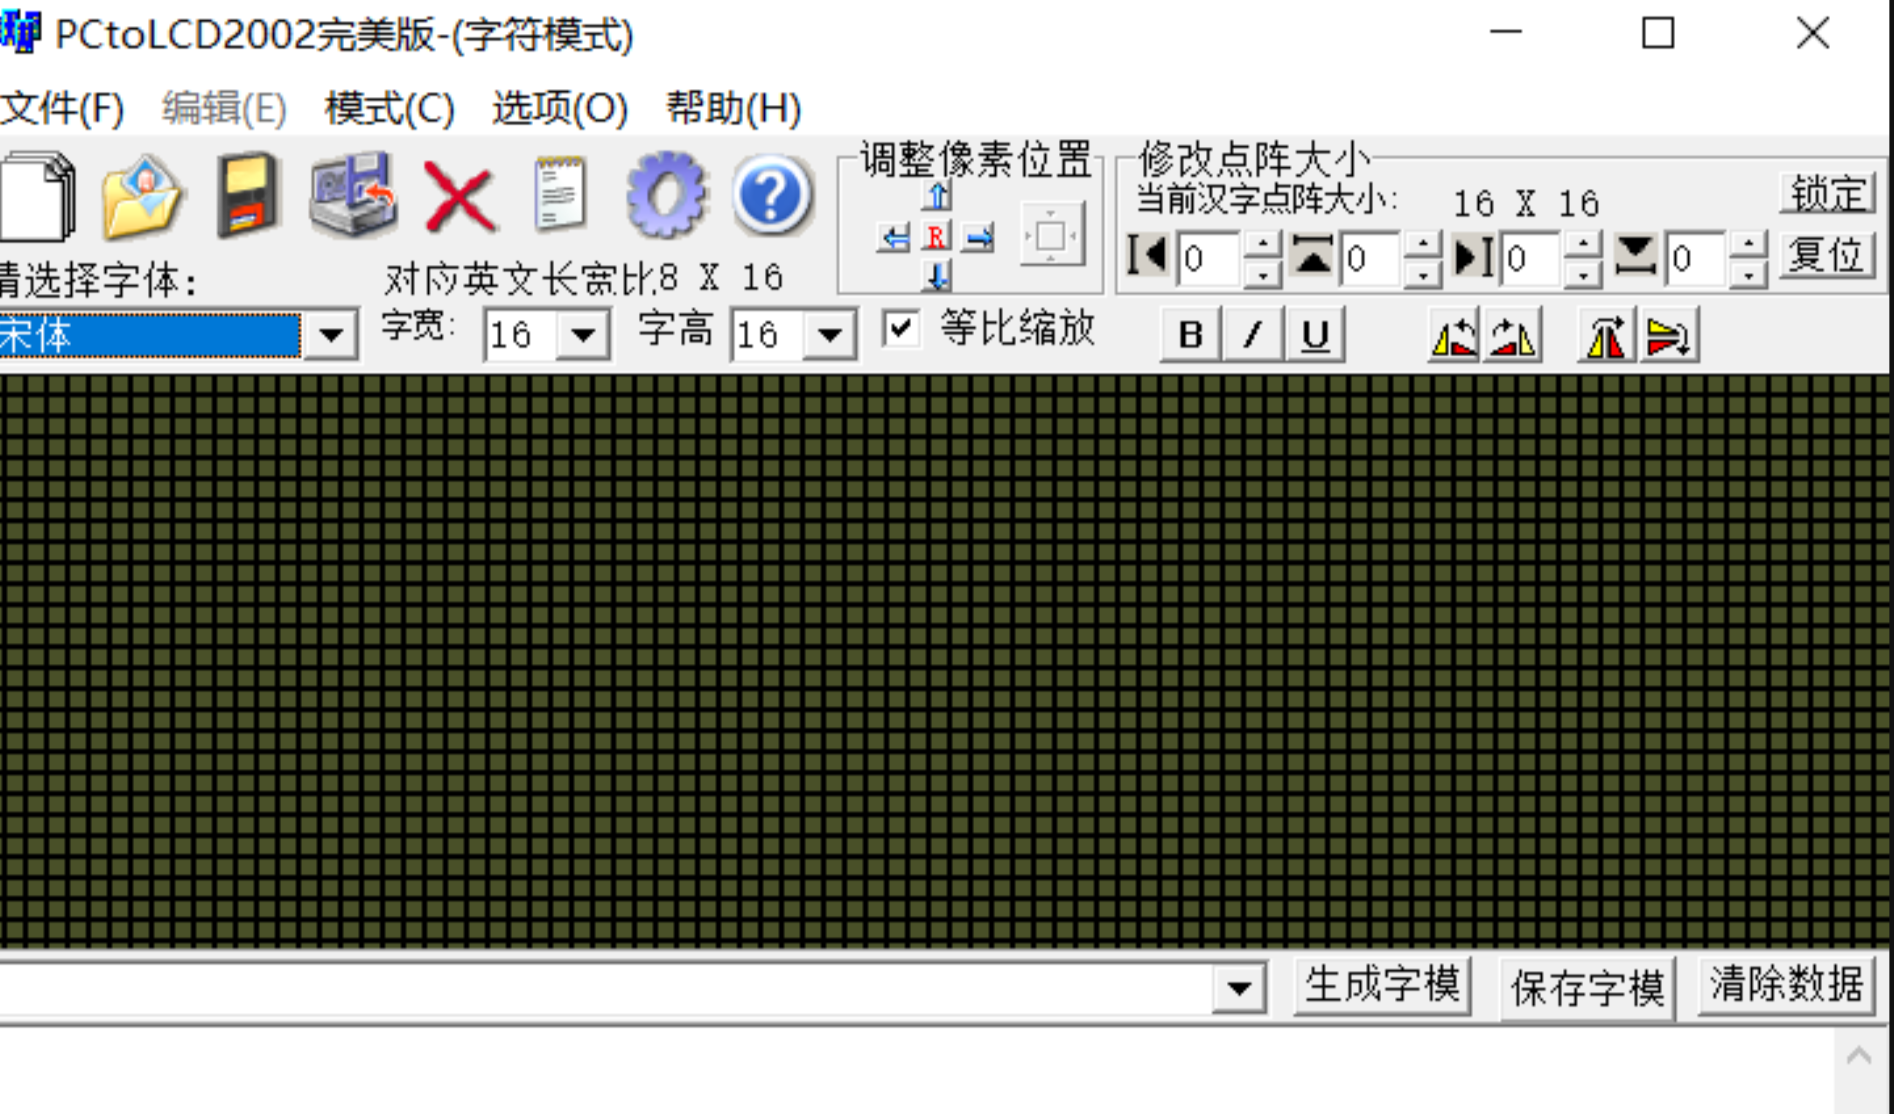
Figure 5-4 Image extraction software interface
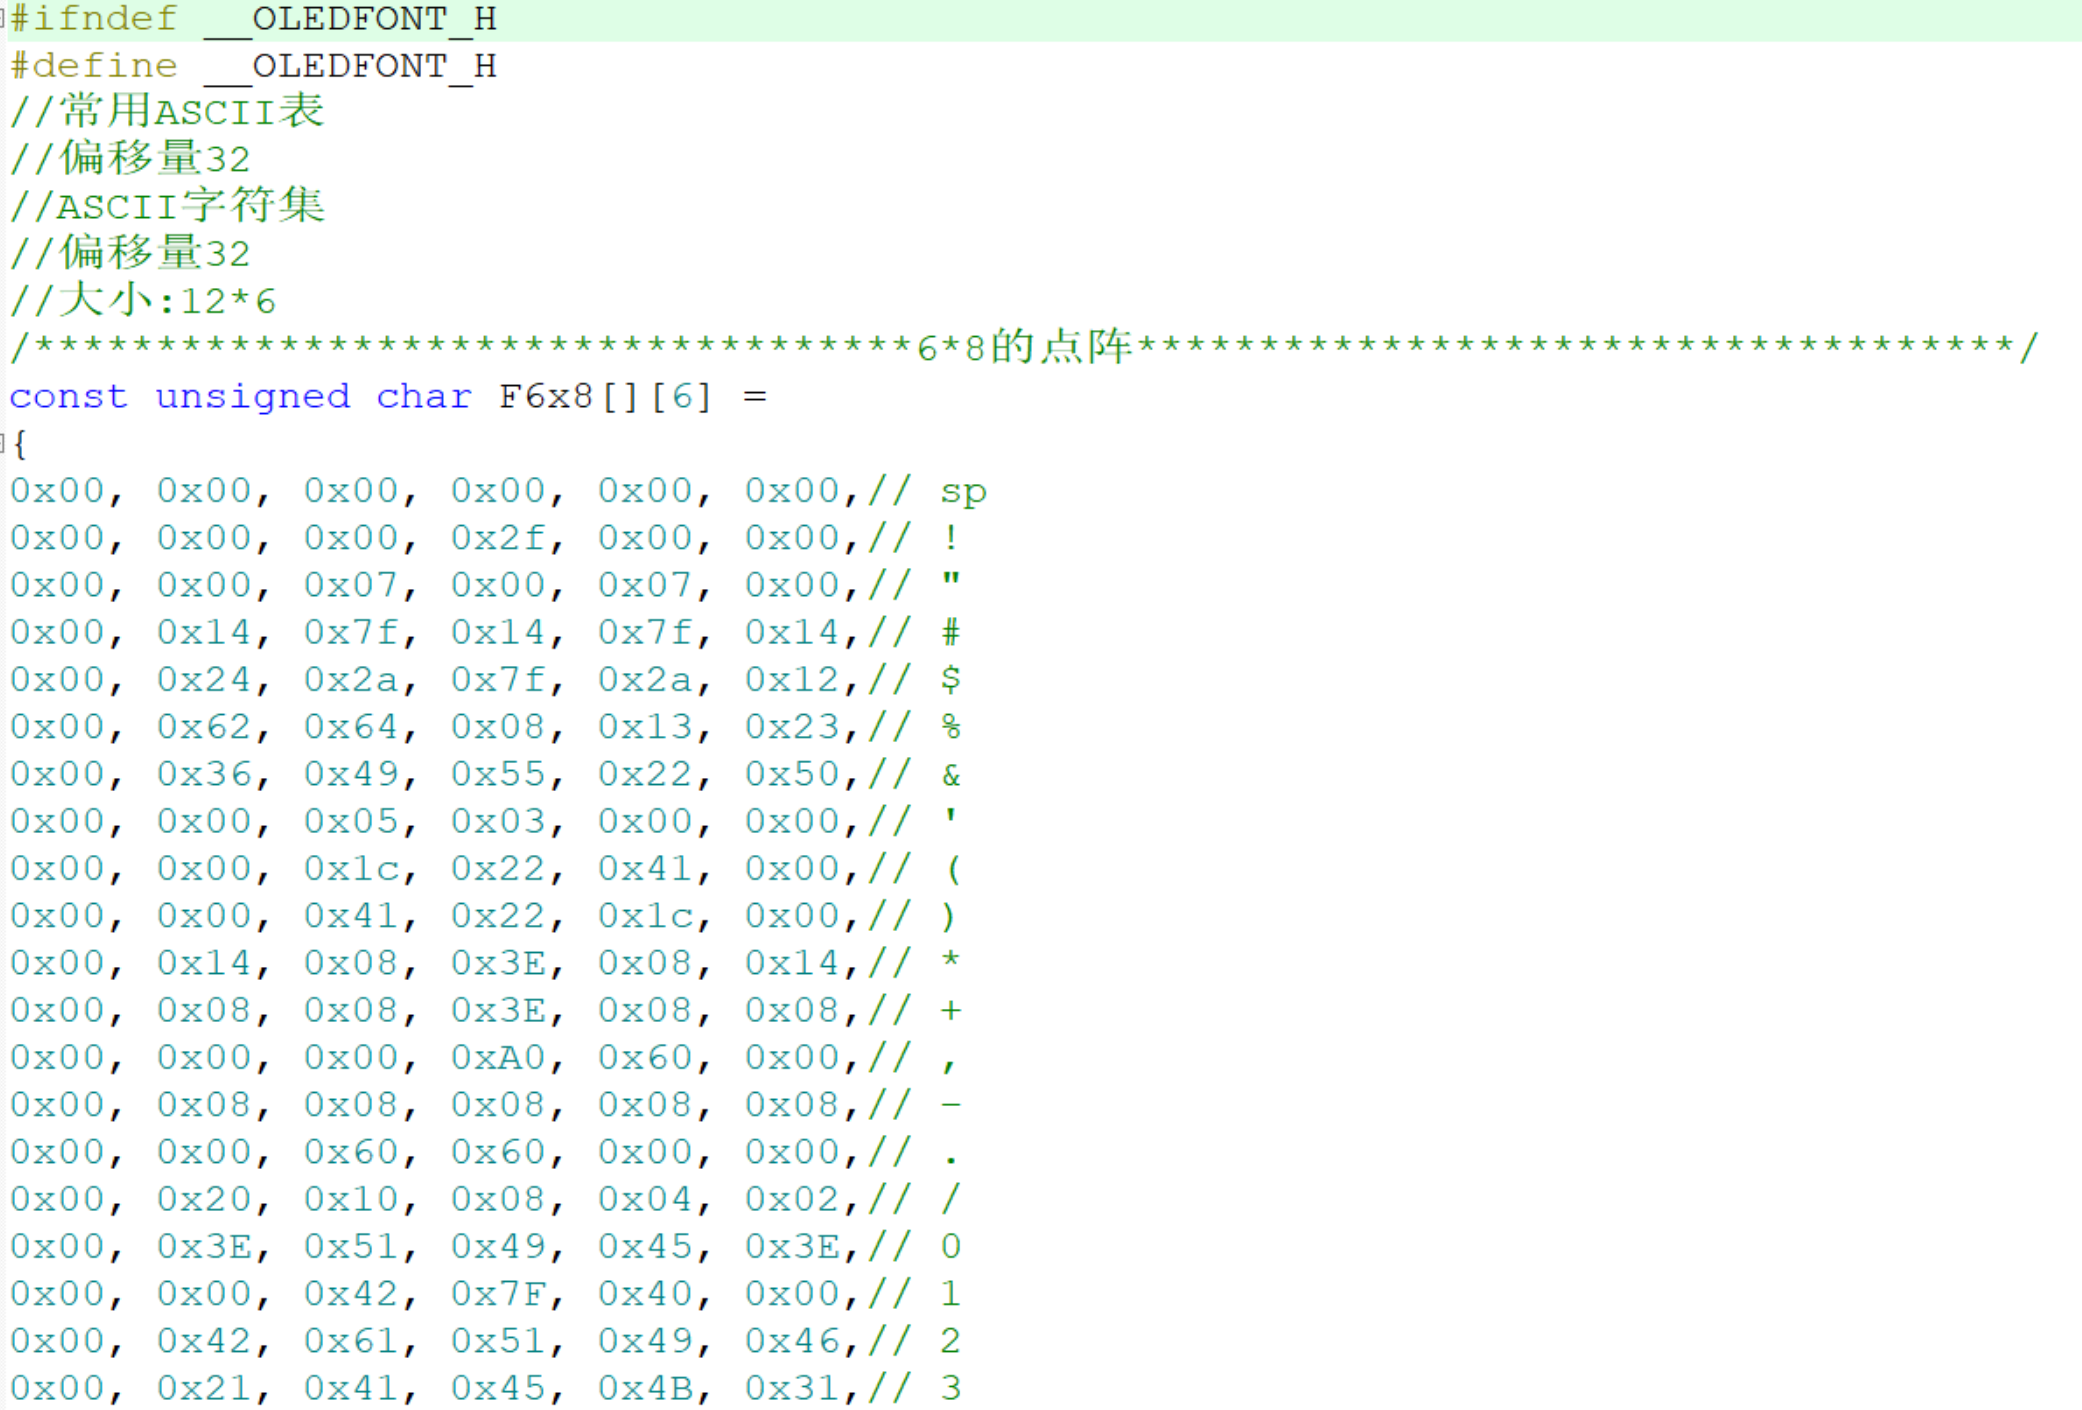
Figure 5-5 Modulus values of some strings
VI. Mobile software analysis
6.1 Software page introduction
Figure 6-1 shows the main interface of the mobile software. Figure a is the Bluetooth connection interface. Upon entering this page, the software will automatically search for nearby Bluetooth devices. After selecting the scale's Bluetooth and connecting, the user will enter the interface shown in Figure b. The interface in Figure b displays the weight in real time, and the user can use the zeroing button to zero the weight, similar to the tare function of a high-precision electronic scale. The user can also click the record function to record the current weight. When the user clicks on historical analysis, they will enter the historical data statistics interface, which displays the weight of the last 10 weighings and calculates the average weight, as well as the heaviest and lightest weights.
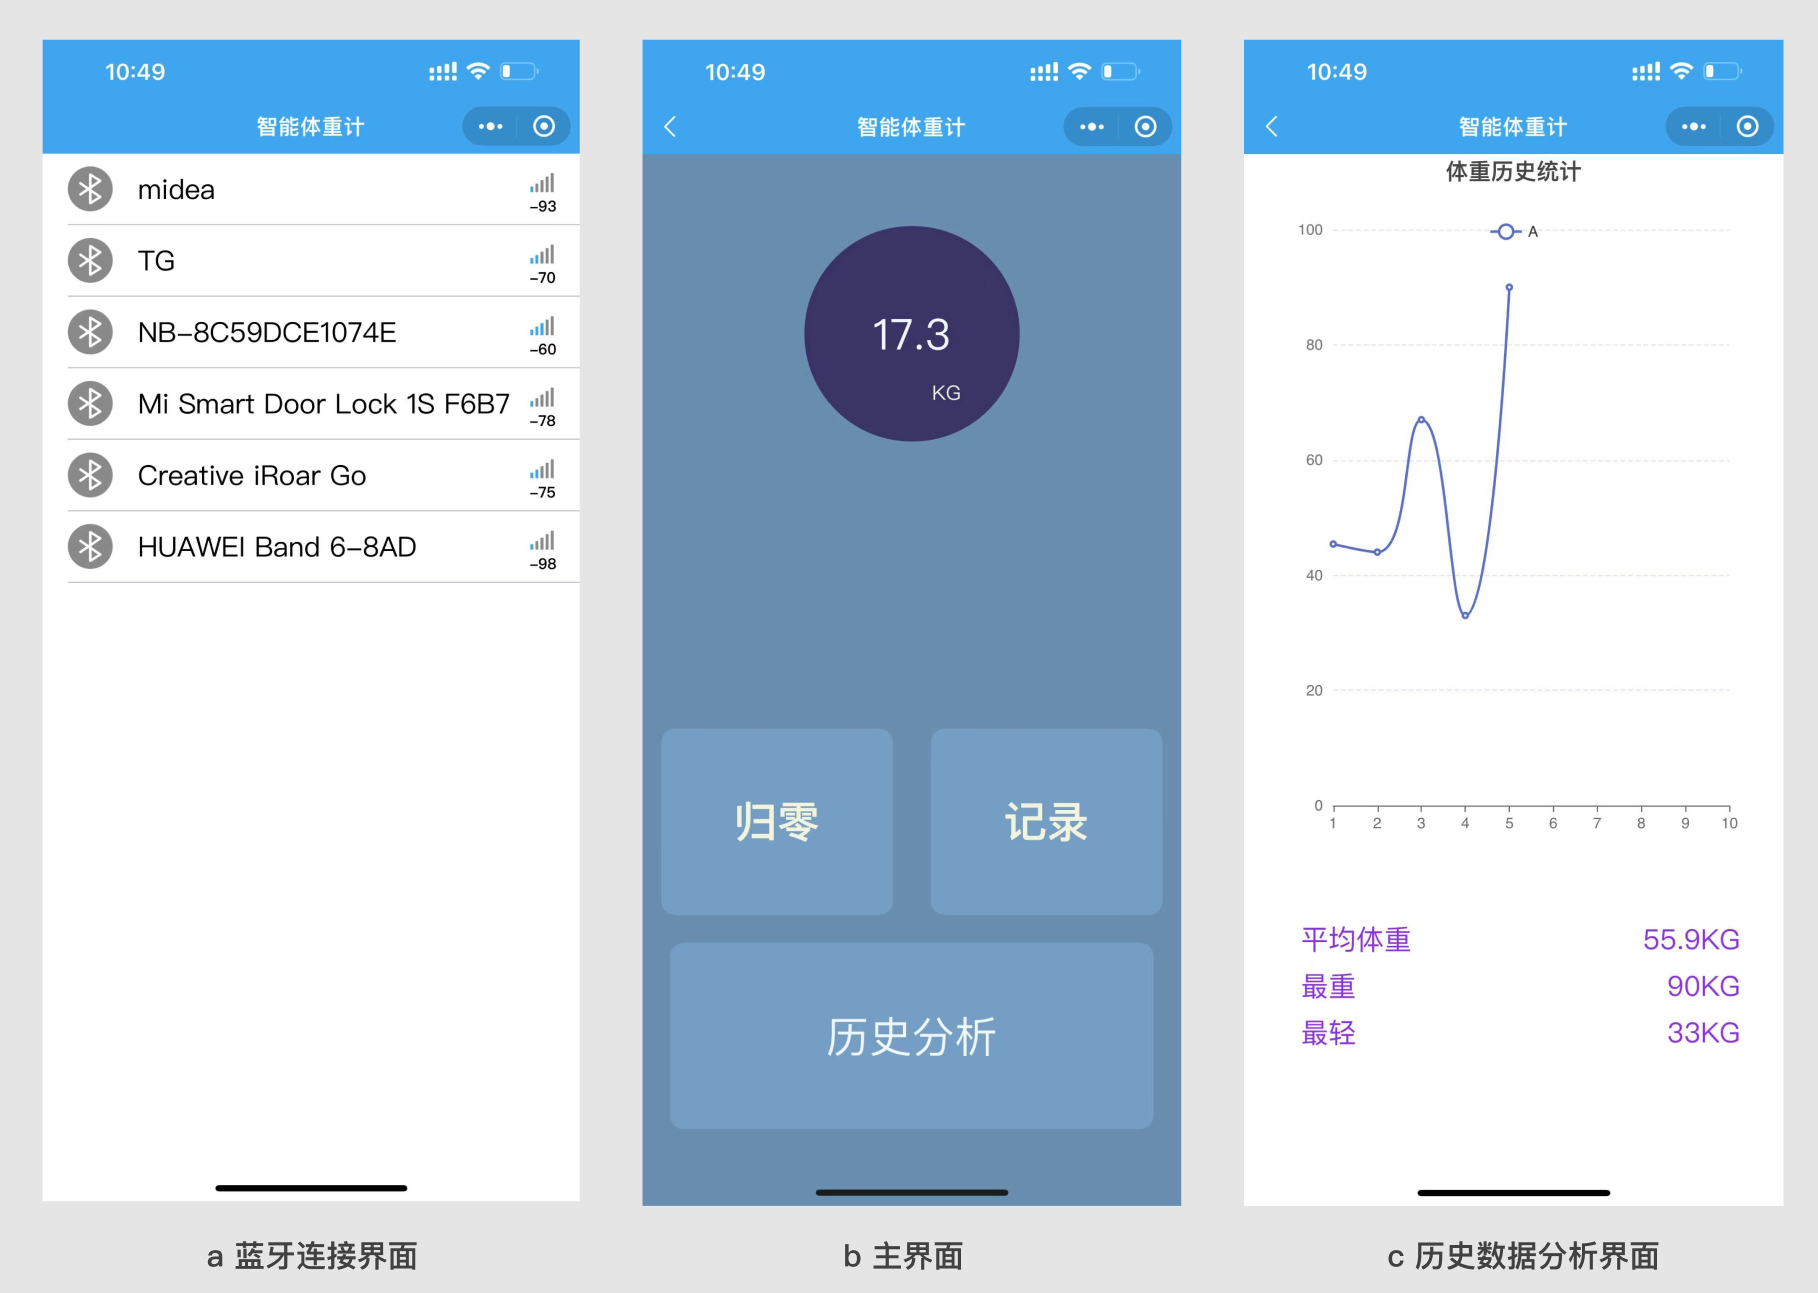
Figure 6-1 Mobile Software Interface
6.2 Introduction to the Mini Program Code Structure
The complete mini program code will be attached. The following will introduce the code structure and functions. The mini program mainly has four pages: the index page is the homepage, i.e., the Bluetooth connection interface; the weightUI page is the weighing homepage; and the analyze page is the historical data statistics page, which can be switched by clicking the historical analysis button.
The mini program uses the ec-canvas control to draw line charts and allows dynamic modification of the charts. See the code for details. The GitHub link for the ec-canvas open-source library is: GitHub - ecomfe/echarts-for-weixin: WeChat Mini Program version of Apache ECharts.
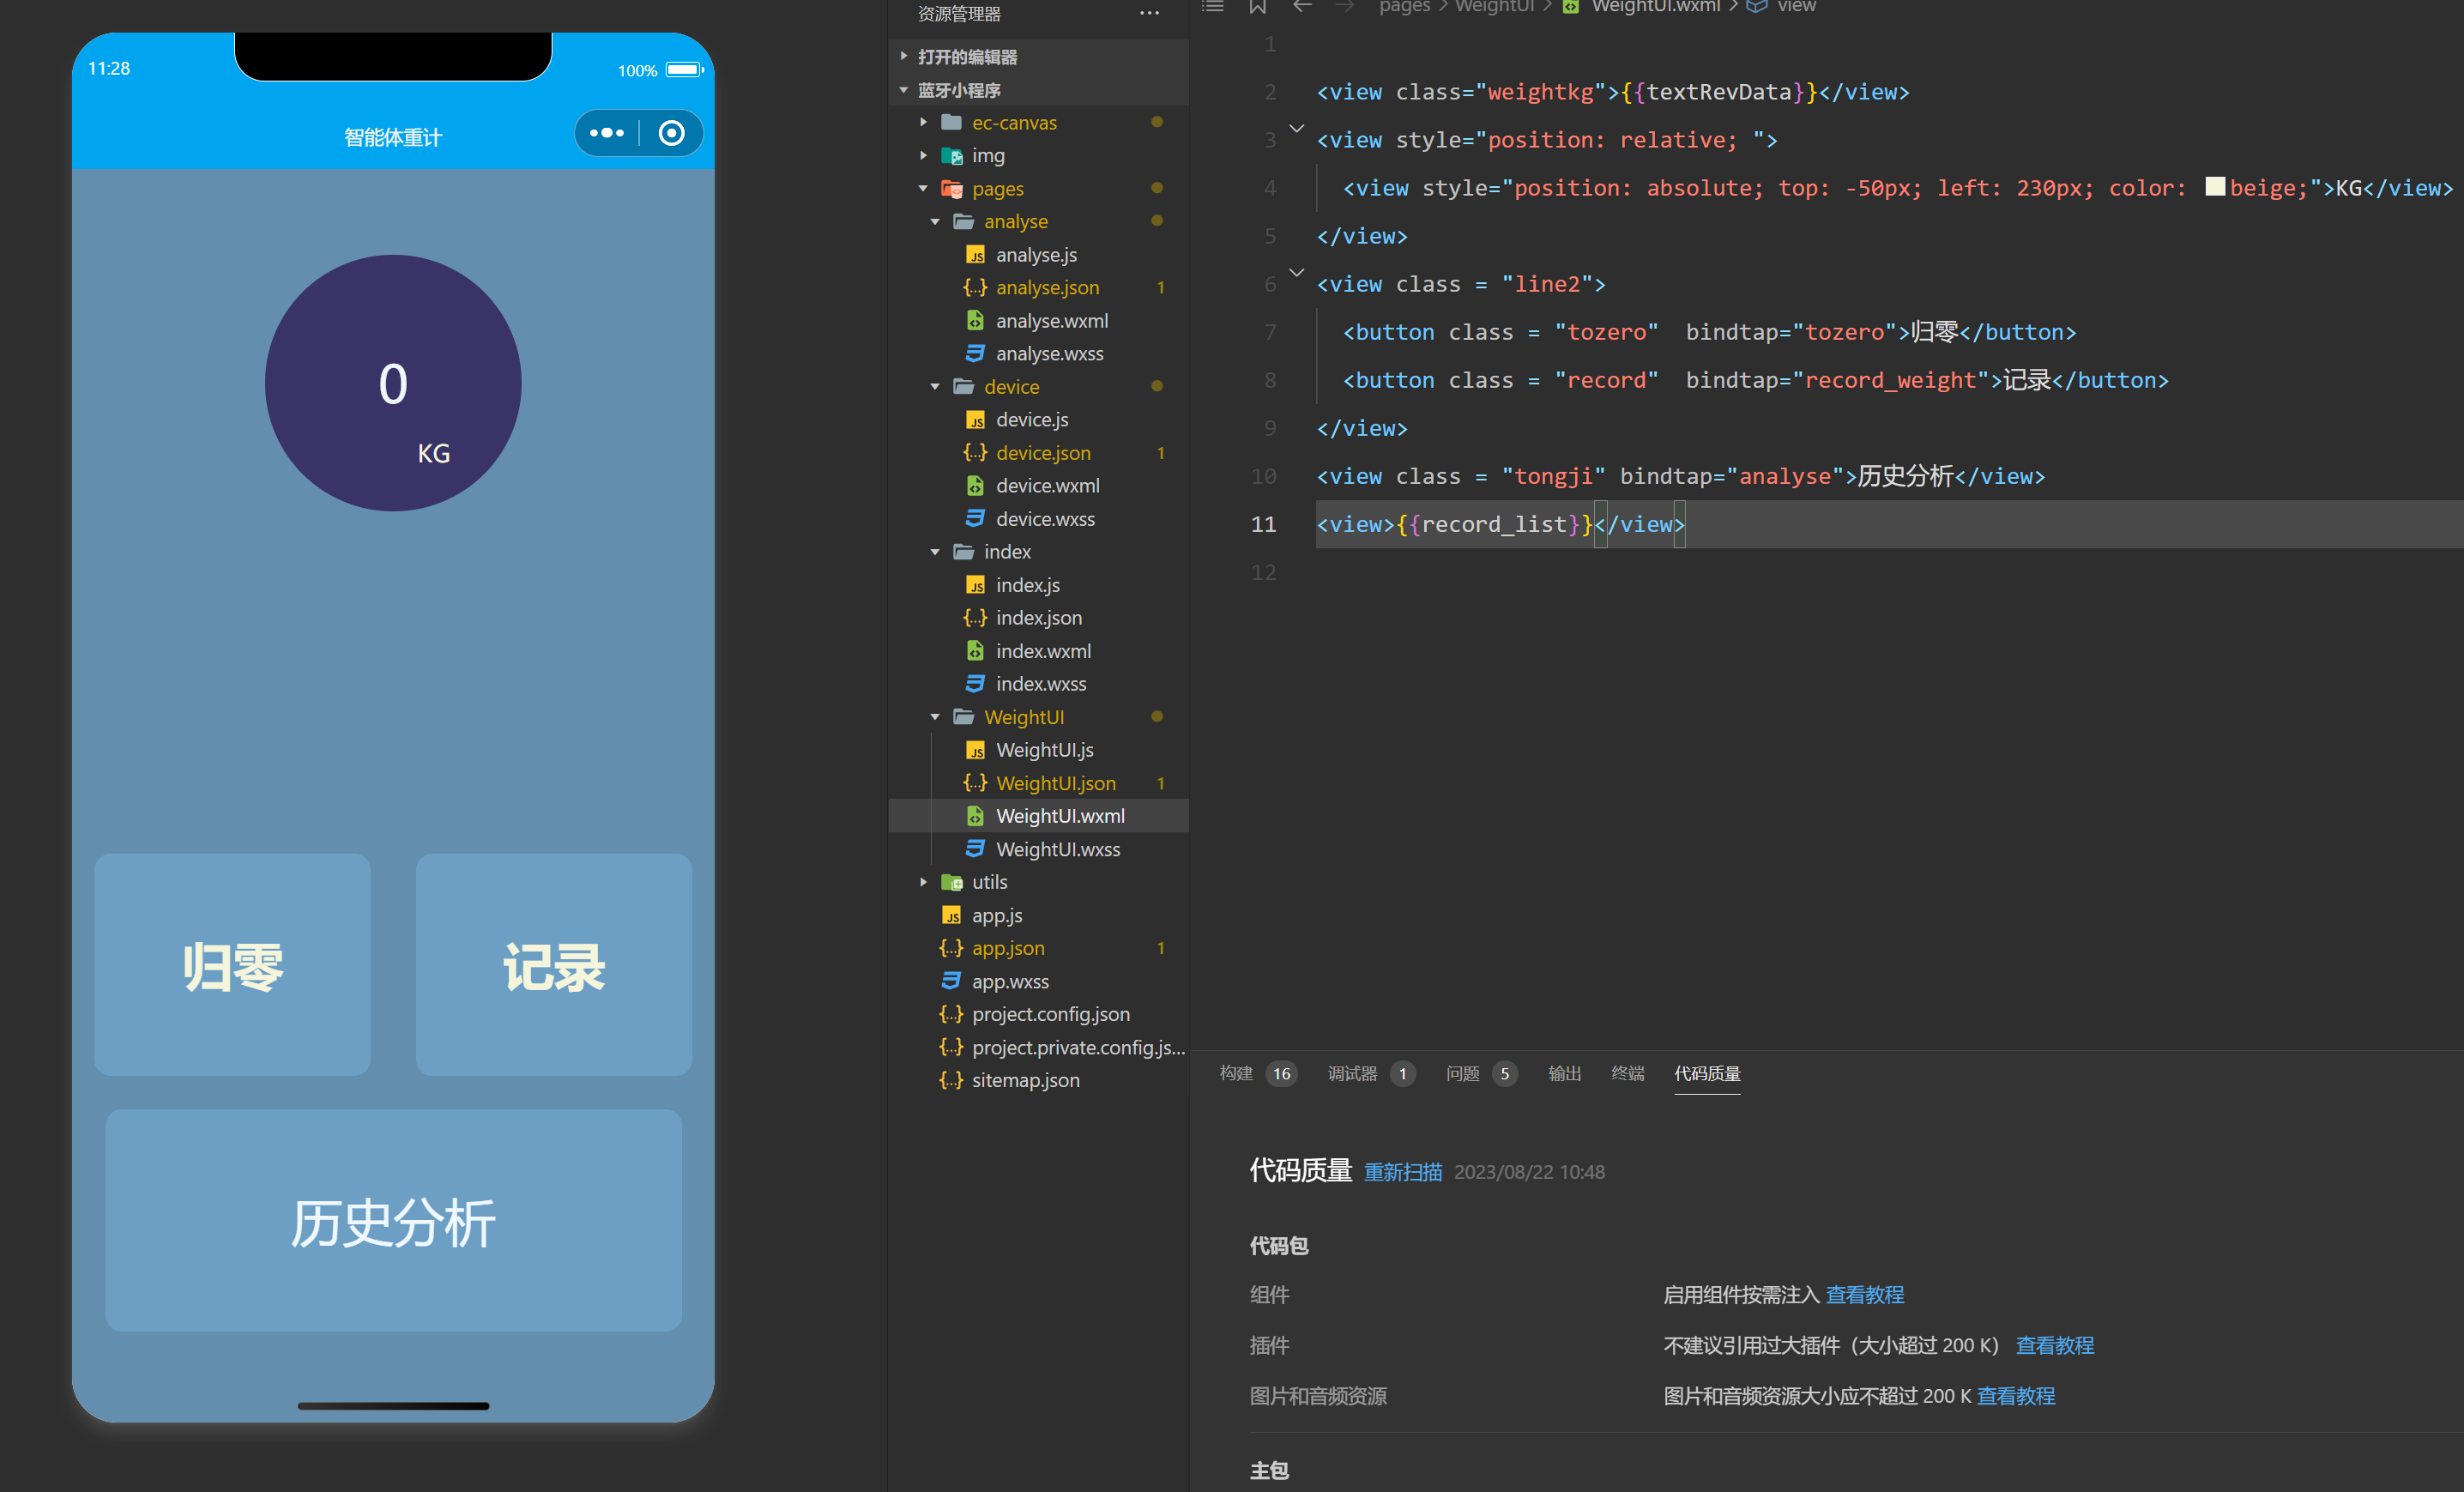
Figure 6-2 shows the mobile code structure.
The device page is the communication debugging page, which can receive data and customize the data to be generated, as shown in Figure 6-3.
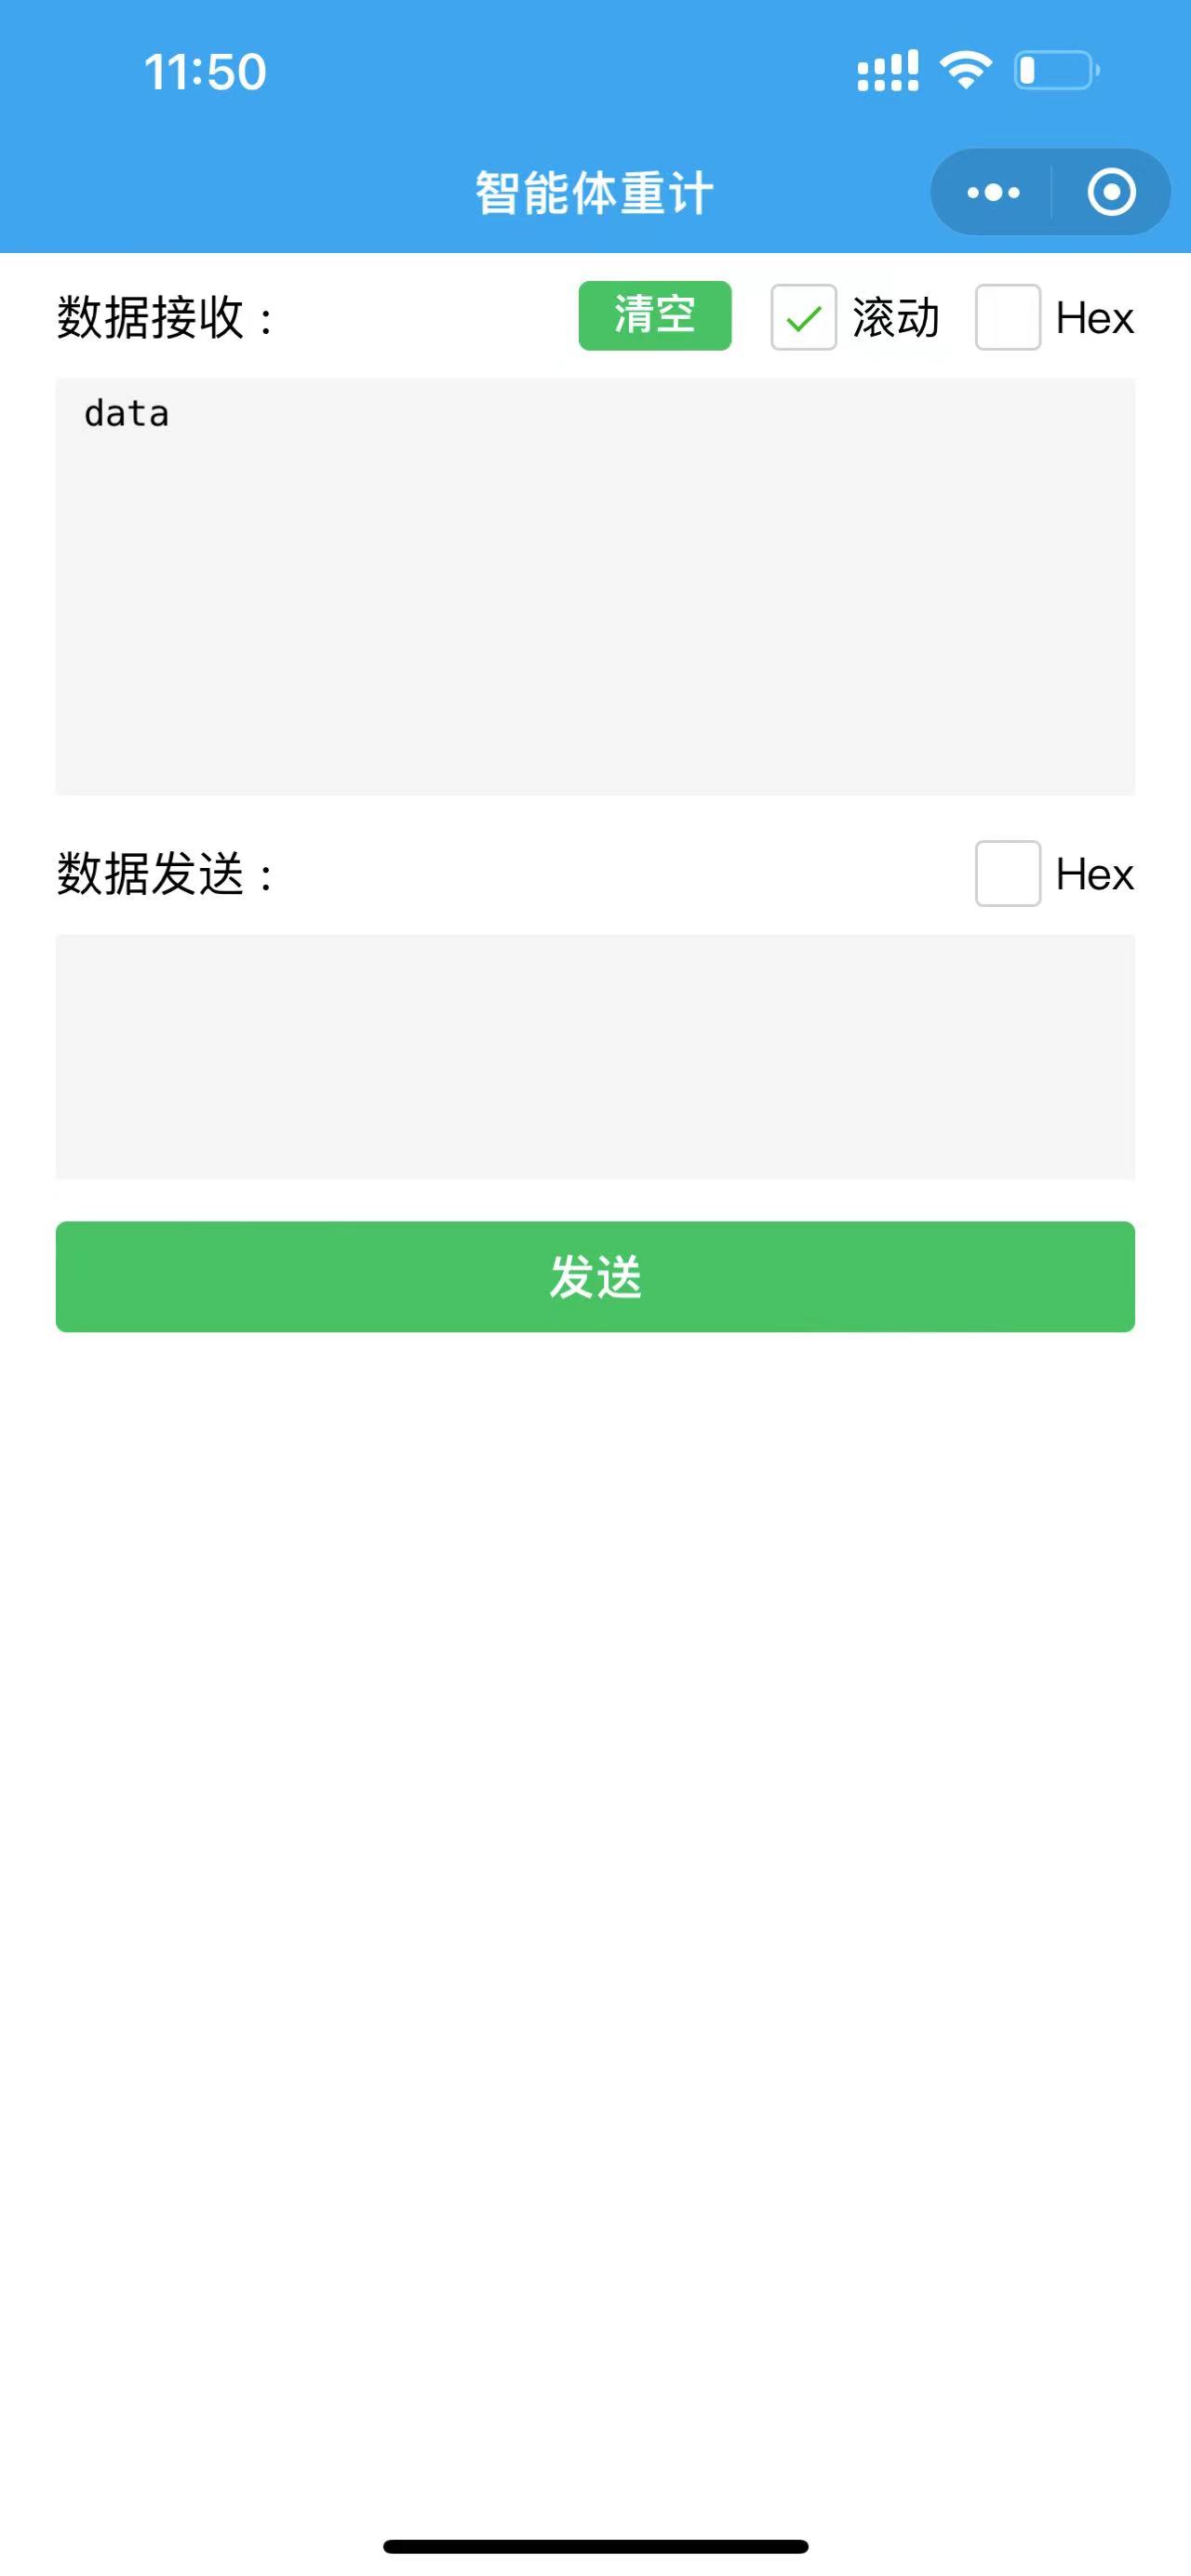
Figure 6-3 Communication Debugging Page.
VII. Physical Display
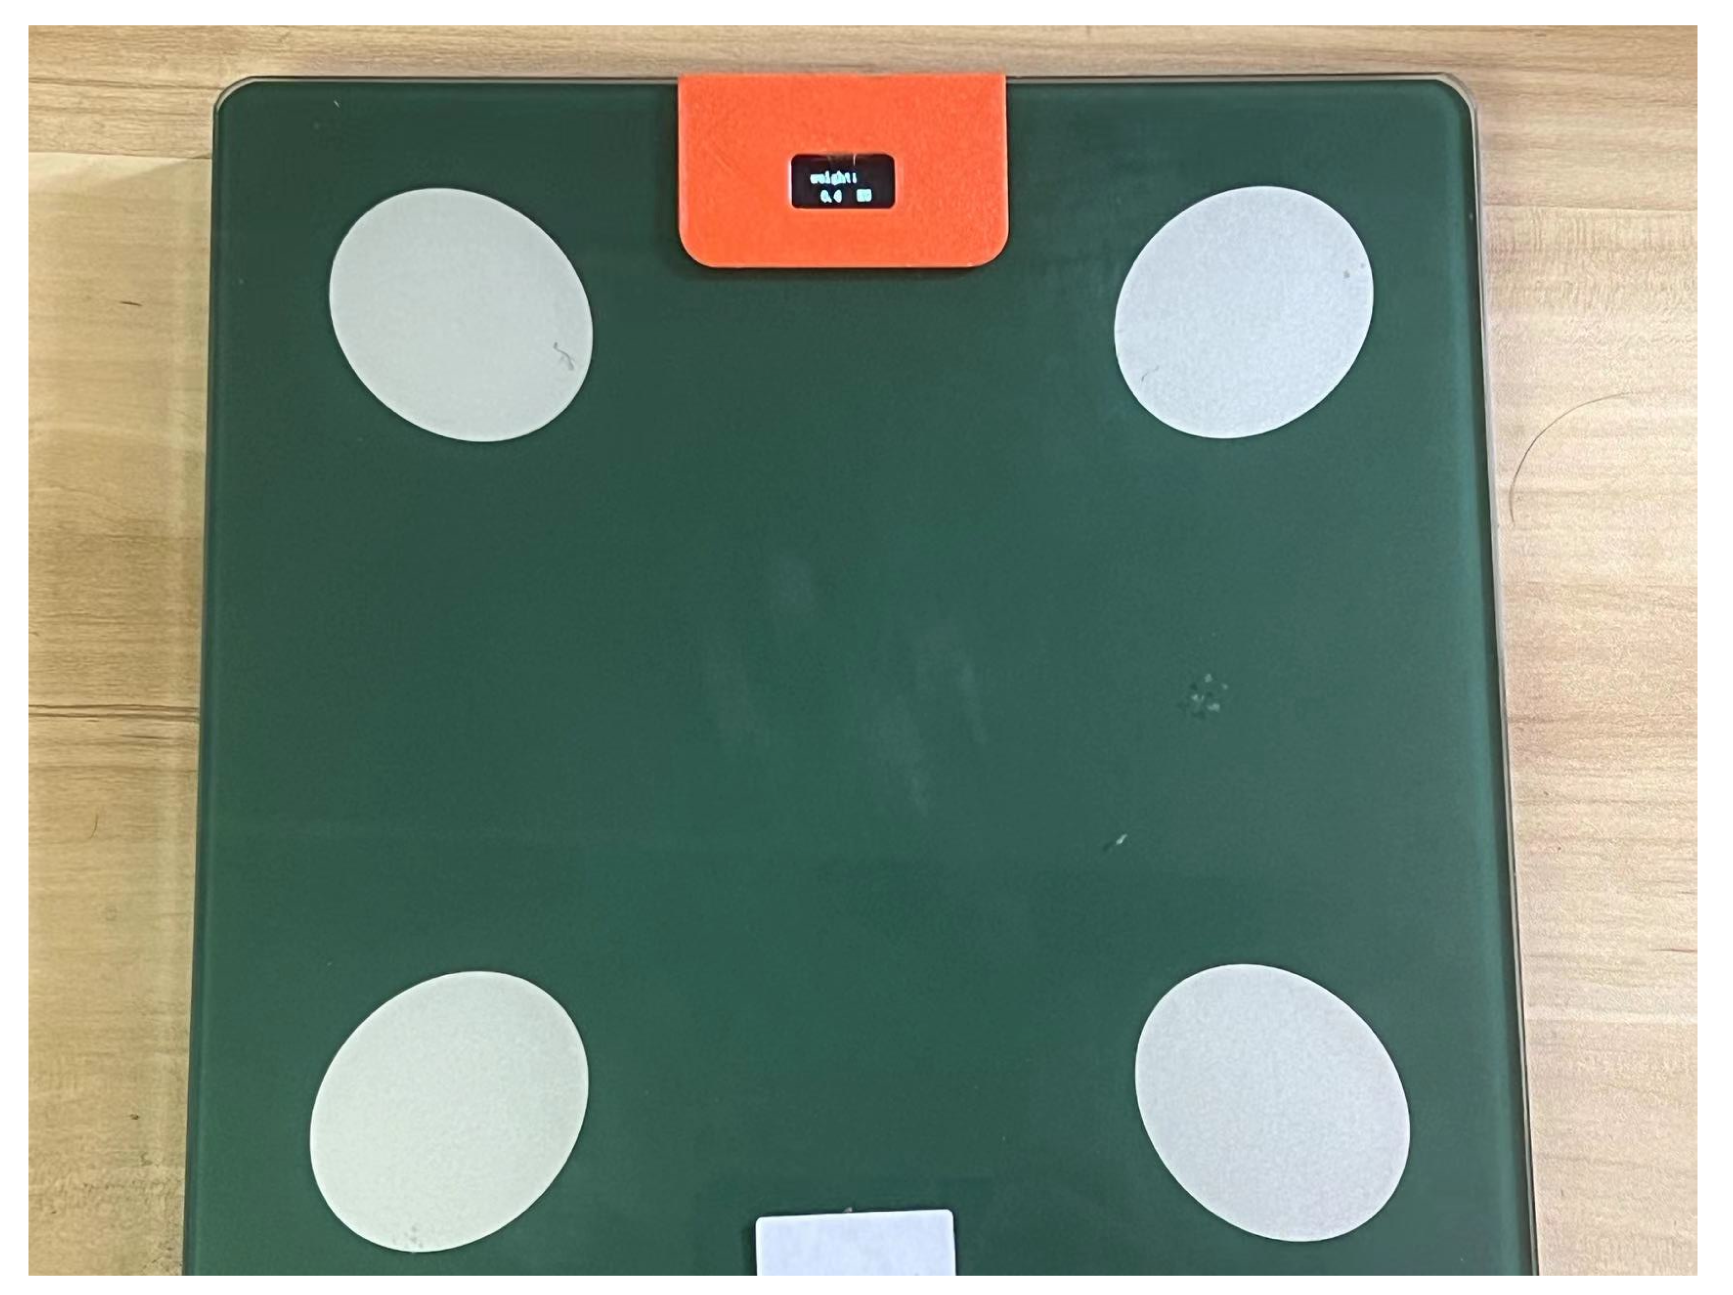
Figure 7-1 Front View of the Smart Scale
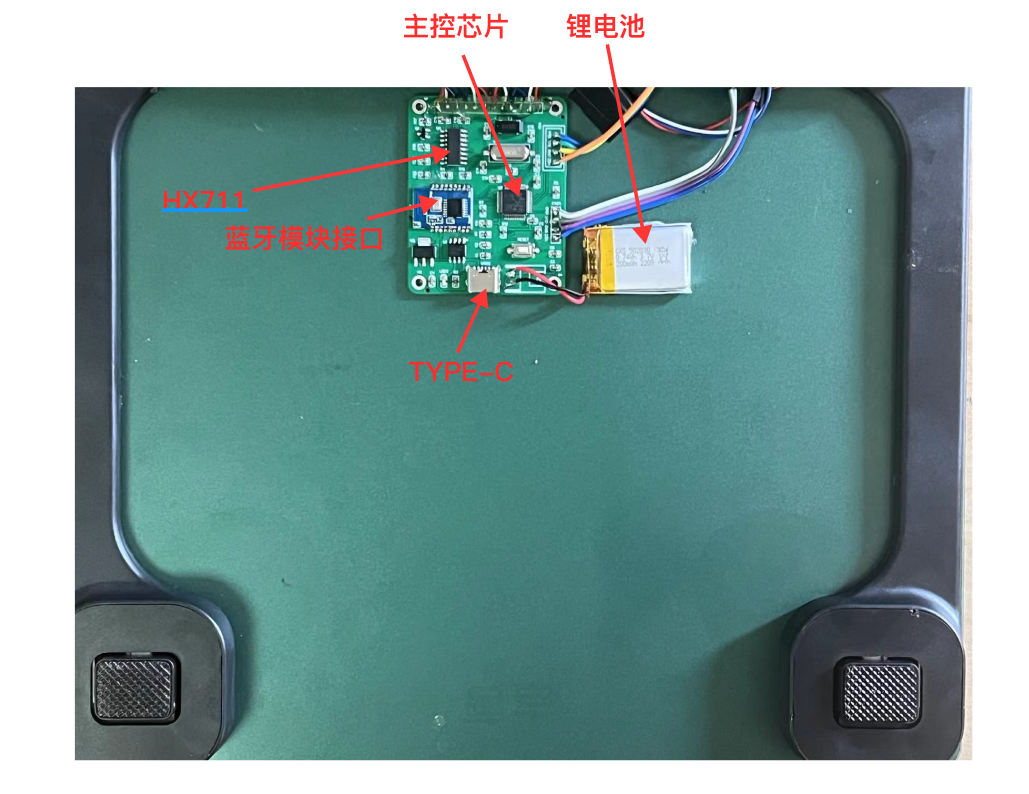
Figure 7-2 Back Circuit Diagram of the Smart Scale
VIII. Precautions
8.1 Precautions for Drawing Circuit Schematic
1. Modular circuit structure and reasonable partitioning.
2. Pins without network should be marked with ❌.
3. Pay attention to the addition of power supply filter capacitors.
8.2 Precautions for Wiring
1. The power supply filter capacitor should be as close as possible to the power supply pin.
2. Avoid forming loops in signal lines.
3. The antenna of the Bluetooth module should face outwards, and copper should not be laid under the antenna.
4. Avoid right-angle traces.
5. It is recommended to use T-shaped connections for power supply traces.
6. It is best to ensure that there is no clearance under the crystal oscillator and do not run traces.
7. Add appropriate silkscreen prompts.

Figure 8-1 Circuit Plan Diagram
8.3 Debugging Precautions
1. The RX pin of the serial port corresponds to the TX pin of the Bluetooth module, and the TX pin corresponds to the RX pin of the Bluetooth module. Be careful not to reverse them.
2. When connecting the pressure sensors, pay attention to the full-bridge connection method. Ensure the order is not reversed. If connecting four sensors at once is difficult to test, you can start testing from one pressure sensor.


 京公网安备 11010802033920号

 P5KE100A