Design of a Wireless Handheld Environmental Monitoring Instrument Based on the Liangshan School of Environmental Science and Technology
1. Background
China's current industrial regions are geographically vast and have complex terrains, resulting in a wide distribution of industrial and mining enterprises and township enterprises. This poses many inconveniences for environmental monitoring personnel, as it is impossible for them to transport large laboratory testing equipment to various locations. In particular, a considerable number of township enterprises have flourished, but many townships still lack testing capabilities, causing significant inconvenience and risks in prevention and control. The use of portable testing instruments can not only reduce the pollution problems of environmental samples during transportation and simplify the procedures for sample fixation and preservation, but also greatly reduce the workload of monitoring personnel, allowing for real-time monitoring of dynamic environmental changes and minimizing potential risks. Therefore, it is necessary to design a wireless handheld environmental monitoring instrument based on the Liangshan School of Environmental Science and Technology.
2. Design Requirements and Specifications
Technical Requirements
Temperature and humidity sensor: used to detect temperature and humidity data;
Barometric pressure sensor: used to detect atmospheric pressure data;
Harmful gas sensor: used to detect harmful gases and other data;
Screen: used to display the collected data in real time;
Wireless communication: used to send data to the receiving device;
Handheld: compact, battery-powered, eliminating the need for power cords;
Specifications
Measurement of temperature, humidity, air pressure, harmful gases, etc.;
Screen displays measurement results in real time using the LVGL open-source GUI library;
Battery-powered, allowing for charging and discharging;
Two wireless communication methods: 1. Implement NBIOT to transmit data to the cloud; 2. Send data to the receiving device via a wireless module;
I. Hardware Design
1. Charging and Boost Circuit Design
1.1 Introduction to Charging and Boost Chip
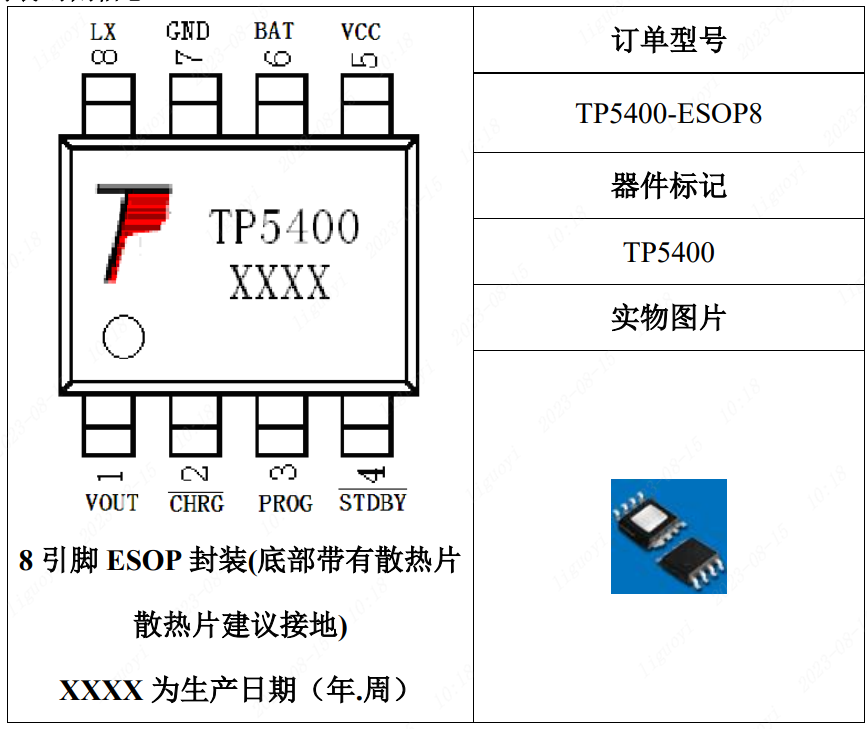
According to project requirements, we need to design a compact, battery-powered environmental instrument. Using a battery requires consideration of charging and discharging. This case uses the TP5400 lithium battery charging and boost control chip.
The TP5400 is a dedicated single-cell lithium-ion battery charger and constant 5V boost controller for power banks. The charging section integrates high-precision voltage and charging current regulators, pre-charge, charging status indication, and charging cutoff
functions , and can output a maximum charging current of 1A. The boost circuit uses a VFM switching DC/DC boost converter manufactured with CMOS technology, exhibiting extremely low no-load current. It features very low no-load power consumption (less than
10uA) and a boost output drive current capability of up to 1A. It requires no external buttons and is plug-and-play.
1.2 Application Circuit Design
The reference circuit in the TP5400 datasheet is as follows:

Pin Description
VOUT (Pin 1): Output voltage detection pin. Connects to the boost 5V output terminal.
CHRG (Pin 2): Charging status indication terminal with open drain output during charging. When the charger is charging the battery, the CHRG pin is pulled low by an internal switch, indicating that charging is in progress; otherwise, the CHRG pin is in a high-impedance state.
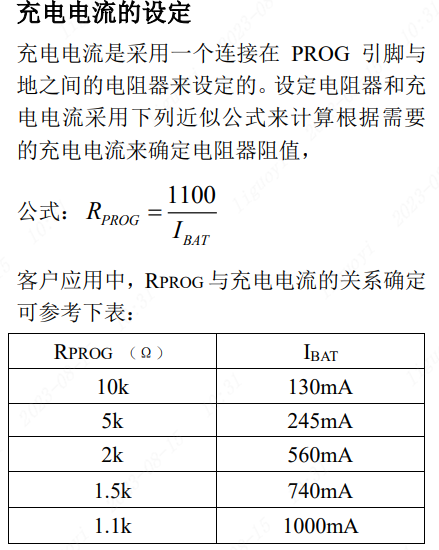
PROG (Pin 3): Charging current setting, charging current monitoring, and shutdown pin. Connecting a 1% accuracy resistor Rprog between this pin and ground sets the charging current (1.1K in a typical circuit sets a charging current of 1000mA). When charging in constant current mode, the voltage on this pin is maintained at 1V. The PROG pin can also be used to shut down the charger. Disconnecting the setting resistor from ground pulls the PROG pin high with an internal 2.5μA current. When the voltage on this pin reaches the 2.7V shutdown threshold, the charger enters shutdown mode, charging stops, and the input power current drops to 40μA. Reconnecting Rprog to ground restores the charger to normal operation.
TDBY (Pin 4): Battery charging complete indicator. When the battery is fully charged, STDBY is pulled low by an internal switch, indicating that charging is complete. Otherwise, the STDBY pin will be in a high-impedance state.
VCC (Pin 5): Charger input power voltage. Charging input power pin. Typical value is 5V, and it should be bypassed through at least one 10μF capacitor. When VCC drops to within 30mV of the BAT pin voltage, the TP5400 charging section enters stop mode.
BAT (pin 6): Charging current output. This pin provides charging current to the battery and regulates the final float voltage to 4.2V. A precision internal resistor divider on this pin sets the float voltage. In stop mode, this internal resistor divider is disconnected, and the internal power supply operates in boost mode.
GND (pin 7): Ground.
LX (pin 8): Output terminal of the internal power transistor in the boost circuit.
Based on the reference circuit, the following application circuit is derived:
battery voltage is BAT+, Type-C charging voltage is VCCIN, and VOUT is the 5V output voltage.
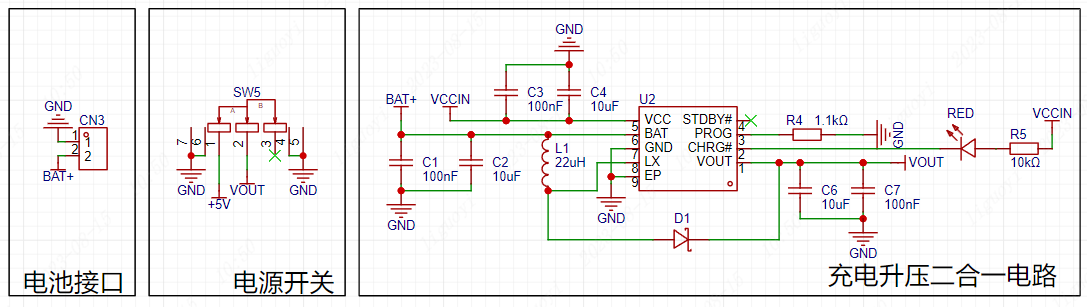
This circuit is the power supply section of our entire device, so it is recommended not to skimp on capacitors where necessary. In practical applications, the STDBY pin is unused. This pin is a charging completion indicator. During charging, a light (CHRG) illuminates to indicate that charging is in progress. Once charging is complete (STDBY), we can do nothing, as the charging light will turn off, indicating a full charge.
2. Temperature and Humidity Sensor Design
2.1 Introduction to Temperature and Humidity Sensors
Temperature and humidity sensors are devices used to measure ambient temperature and relative humidity. They typically consist of a sensing element, signal processing circuitry, and an output interface. Common sensing element technologies include thermistors, capacitive humidity sensors, and semiconductor sensors. Thermistors measure temperature based on the material's temperature sensitivity, while capacitive humidity sensors utilize the relationship between humidity and capacitance. Semiconductor sensors can measure both temperature and humidity, making them multifunctional sensors.
The signal processing circuit amplifies, filters, and linearizes the signal acquired by the sensing element, ensuring the accuracy and stability of the sensor output.
The output interface can be an analog signal interface or a digital signal interface, used to transmit the temperature and humidity data measured by the sensor to other devices for further processing or display.
This case uses the AHT21 temperature and humidity sensor. The AHT21, as a new generation of temperature and humidity sensor, sets a new standard in size and performance: it is embedded in a dual-in-line flat no-leads SMD package suitable for reflow soldering, with a bottom surface of 3x3mm and a height of 0.8mm. The sensor outputs a calibrated digital signal in standard I2C format.

2.2 Application Circuit Design
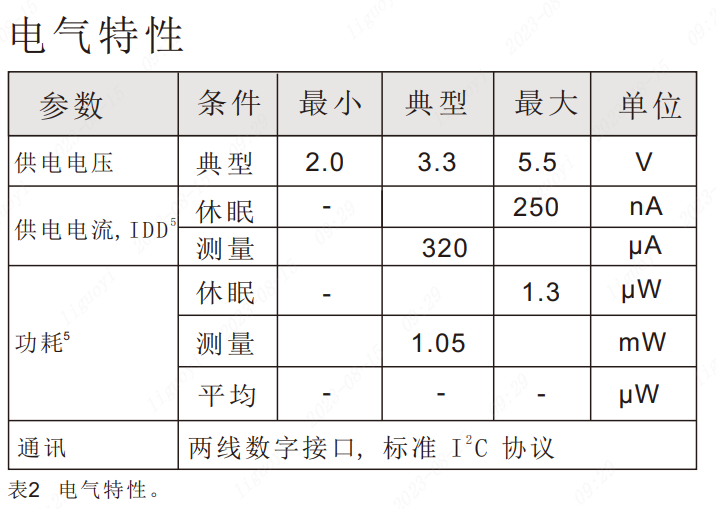
To design its circuit, we need to understand its electrical characteristics. See the figure below:
the input voltage is 2.0~5.5V, and the communication uses the IIC interface.
The datasheet provides two typical application circuits.
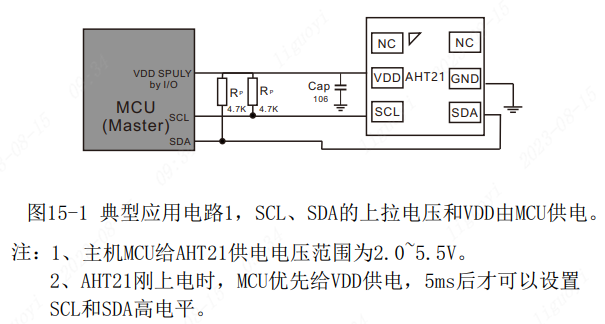
Referring to the typical circuits in the datasheet, we derive the following application circuit for our actual use. We use PD3 on the development board as the SCL interface of the IIC interface and PD6 as the SDA interface of the IIC interface.

3. Barometric Pressure Sensor Design
3.1 Introduction to Barometric Pressure Sensor
A barometric pressure sensor is a device used to measure atmospheric pressure. It converts atmospheric pressure into an electrical signal through a sensing element, which is then amplified, filtered, and linearized by a signal processing circuit, ultimately outputting a digital or analog signal related to air pressure.
Commonly used sensing element technologies include piezoresistive sensors (such as piezoelectric and resistive sensors), semiconductor sensors, and capacitive sensors.
Piezoresistive sensors: Piezoelectric sensors are based on the piezoelectric effect; changes in applied pressure result in changes in charge or voltage. Resistive sensors are based on the relationship between the resistance of a metallic material and the applied pressure. Both types of sensors indirectly measure air pressure by measuring changes in charge or resistance.
Semiconductor sensors: Semiconductor sensors utilize the relationship between the resistance of a semiconductor material and temperature and pressure. When the external air pressure changes, the resistance of the semiconductor material changes; measuring this change in resistance indicates the air pressure.
Capacitive sensors: Capacitive sensors utilize the relationship between capacitance, the size of the gap, and the dielectric constant of the medium; measuring changes in capacitance indicates changes in air pressure. They can directly measure air pressure with high accuracy. Barometric pressure
sensors are widely used in meteorological observation, climate research, air quality monitoring, aircraft navigation and altitude measurement, and barometric pressure control systems.
These sensors provide real-time and accurate barometric pressure data, helping people understand and predict weather changes and achieve precise altitude measurement and control.
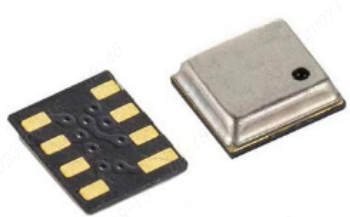
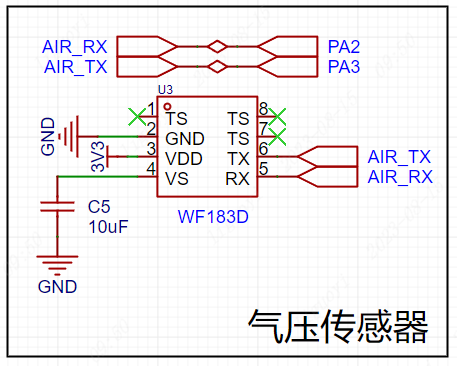
This case study uses the WF183D digital waterproof barometric pressure sensor. The WF183D is an economical digital pressure and temperature sensor that internally incorporates a MEMS pressure sensor, a high-resolution 24-bit ΔΣADC, and a DSP. The WF183D provides high-precision, calibrated digital pressure and temperature output via UART, with very simple communication connectivity.
Key features include
direct digital pressure and temperature readings,
operating voltage: 2.4V~3.6V,
pressure range: 0~180kPa (absolute pressure)
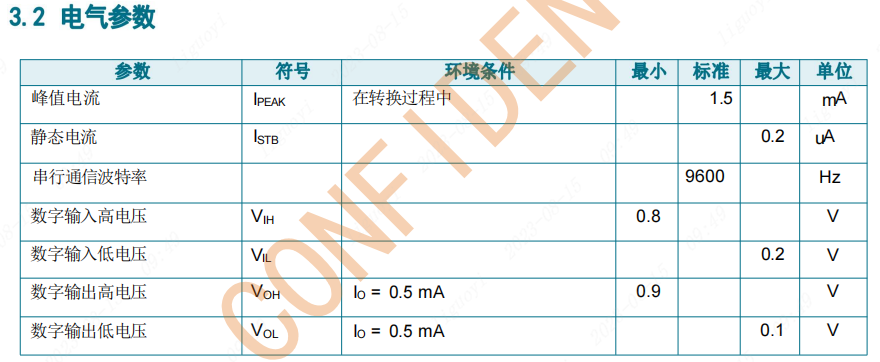
, operating current: 1.5mA
, and standby power consumption: < 2uA.

Other notes:
The product is pre-calibrated for pressure and temperature, allowing for plug-and-play operation without requiring further calibration by the customer.
Furthermore, the use of UART communication reduces the requirements for the MCU, lowering the overall cost for customers.
The WF183D has an IP65 waterproof rating, meeting the requirements of most waterproof products.
3.2 Application Circuit Design
The datasheet provides a typical circuit for this sensor.
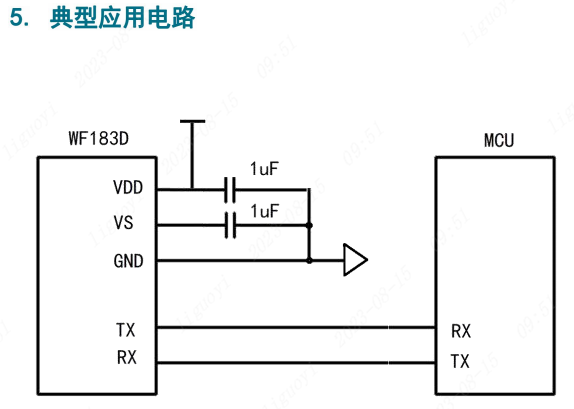
Since the sensor uses serial communication, we need to determine which serial port on the development board to use for communication. Referring to the GD32F470 datasheet, this case ultimately uses serial port 1 (TX=PA2, RX=PA3). The
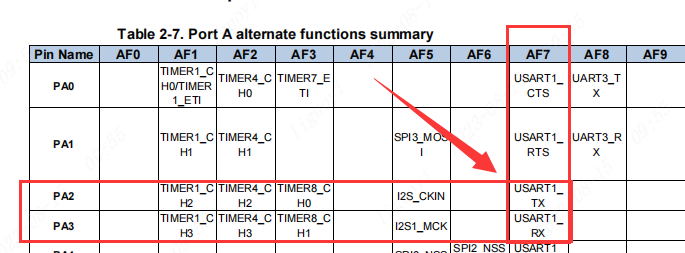
application circuit is as follows:
4. Hazardous Gas Sensor Design
4.1 Introduction to Hazardous Gas Sensors
Hazardous gas sensors are devices used to detect and monitor the concentration of harmful gases present in the environment. They are widely used in industrial safety, indoor air quality monitoring, and environmental pollution monitoring.
Hazardous gas sensors can detect and measure a variety of common harmful gases, including but not limited to carbon monoxide (CO), carbon dioxide (CO2), formaldehyde (HCHO), ammonia (NH3), hydrogen (H2), hydrogen sulfide (H2S), benzene (C6H6), nitrogen oxides (NOx), and ozone (O3).
The working principle of the sensor varies depending on the sensor type and the harmful gas being detected. Common sensor technologies include chemical sensors, electrochemical sensors, infrared sensors, and semiconductor sensors.
Chemical Sensors: Chemical sensors use specific chemical reactions to detect harmful gases. They typically contain a sensitive layer that reacts specifically with the target gas. When the target gas is present, the resistance, capacitance, color, or optical properties of the sensitive layer change, and the gas concentration is determined by measuring this change.
Electrochemical Sensors: Electrochemical sensors measure gas concentration based on the electrochemical reaction between the gas and electrodes. They typically contain electrodes that interact with the target gas. When the target gas enters the sensor, an electrochemical reaction occurs, generating a specific current or potential change, thus enabling measurement.
Infrared Sensors: Infrared sensors utilize the specific infrared absorption characteristics of gases to detect gas concentration. The sensor emits infrared radiation into the gas sample, and the concentration information of the target gas is obtained by measuring the transmitted or absorbed infrared light.
Semiconductor Sensors: Semiconductor sensors detect gas concentration by utilizing the principle that the electrical properties of semiconductor materials change in the presence of a target gas. When the target gas enters the sensor, the resistance or conductivity of the semiconductor material surface changes, thus measuring the gas concentration.
The accuracy, response time, sensitivity, and stability of harmful gas sensors are important factors to consider when selecting a sensor. Depending on the specific application
requirements , sensors can be used independently or in conjunction with monitoring systems for timely alarms, data logging, and remote monitoring.
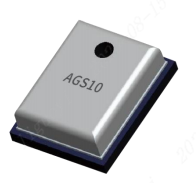
This case study uses the AGS10 TVOC sensor, a MEMS TVOC sensor with digital signal output. It features dedicated digital module acquisition technology and gas sensing technology, ensuring extremely high reliability and excellent long-term stability. It also boasts low power consumption, high sensitivity, fast response, low cost, and a simple drive circuit. The AGS10 is
primarily suitable for detecting various volatile organic gases, such as ethanol, ammonia, sulfides, benzene vapors, and other harmful gases, and can be applied in air purifiers, home appliances, and fresh air systems.
Sensor Characteristics :
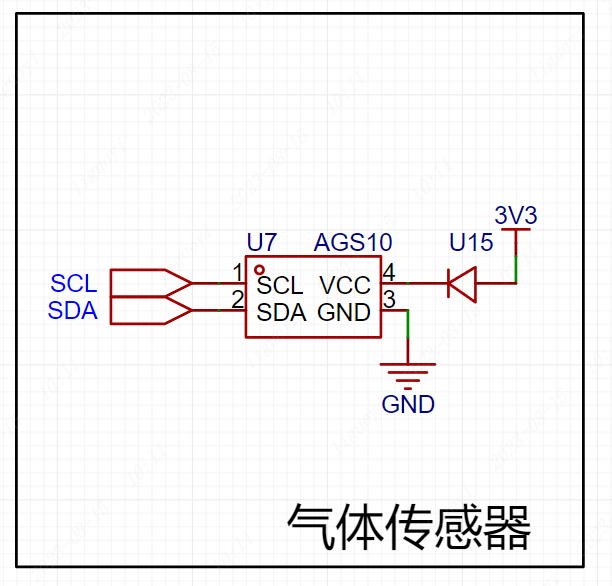
The sensor uses the standard IIC communication protocol, adaptable to various devices. The IIC physical interface includes two interfaces: a serial data signal (SDA) and a serial clock signal (SCL). During design, both interfaces need to be pulled up to VDD through resistors ranging from 1kΩ to 10kΩ.

4.2 Application Circuit Design
The sensor operates at 3V, while our voltage options are only 5V and 3.3V. A Schottky diode can be connected in series at the sensor's VCC pin. The voltage drop of a regular diode is between 0.6V and 1.7V, while that of a Schottky diode is typically between 0.15V and 0.45V. The gas sensor also uses an IIC interface. We know that the IIC protocol allows multiple devices to share a single IIC bus, provided their device addresses are different. Here, the IIC interface is connected to the IIC interface of the temperature and humidity sensor. Since these two sensors have different device addresses, they can directly use the same IIC interface.
The actual application circuit is as follows:
5. The circuit diagram of the ADC for power measurement
is as follows. Here, the ADC is measured by voltage division of resistors. Because the IO port can only be compatible with a maximum of 5V, exceeding 5V will burn out the IO port. The two resistors R30 and R18 are connected in series to reduce one component. Alternatively, a 20K resistor can be used directly. The value of the resistor can be calculated based on the IO port level. After voltage division, it should not exceed the voltage that the IO port can tolerate. Select a suitable value. Next, we will demonstrate how to convert the ADC value to the voltage value through calculation.
Premise: Assume that the ADC is 12-bit, and the battery power supply is at most 4.2V and at least 3.2V;
-------Knowing the voltage, find the ADC value-------
(1) The voltage ratio of the ADC terminal: 10K/(10K+10K)=0.5;
(2) When the battery power is at its highest, the voltage obtained by the voltage divider at the ADC terminal is:
0.5 - 4.2V = 2.1V. When the battery power is at its lowest, the voltage obtained by the voltage divider at the ADC terminal is:
0.5 - 3.2V = 1.6V. The
ADC value when the battery power is at its highest is: (2.1/3.3V) - 4095 = 2606. The ADC value when the battery power is at its lowest is: (1.6/3.3V ) - 4095 = 1613.
-------Calculate the voltage from the ADC
value------- Through the inverse operation of the above formula, we can know that the voltage value collected for any ADC value is: V_value = (ADC * 3.3) / 4095 Unit: V

6.1 Screen Introduction
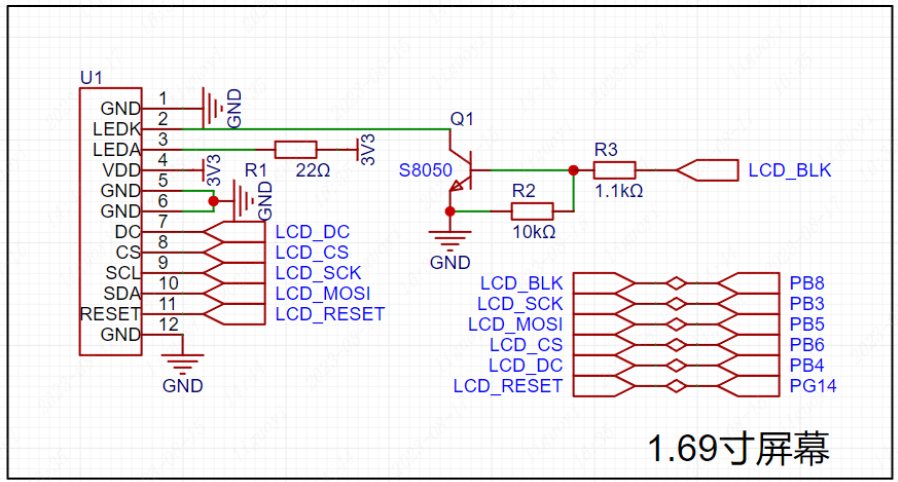
The screen uses a 1.69-inch IPS high-definition rounded corner screen with 240*280 pixels and SPI communication. A 1.69-inch screen is a common small-sized display screen, which refers to the diagonal size of the screen being 1.69 inches (about 4.29 cm). Although it is relatively small, it still has a wide range of uses and functions in some application areas. This screen has a higher pixel density (total pixels/size), resulting in finer image quality and fewer control I/Os, making the peripheral circuitry relatively simple.
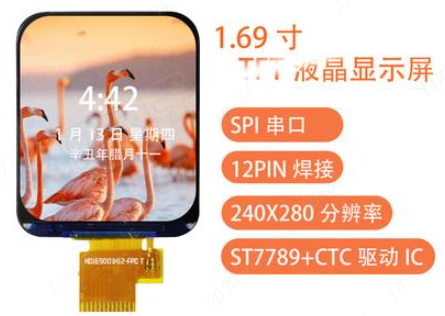
6.2 Application Circuit Design
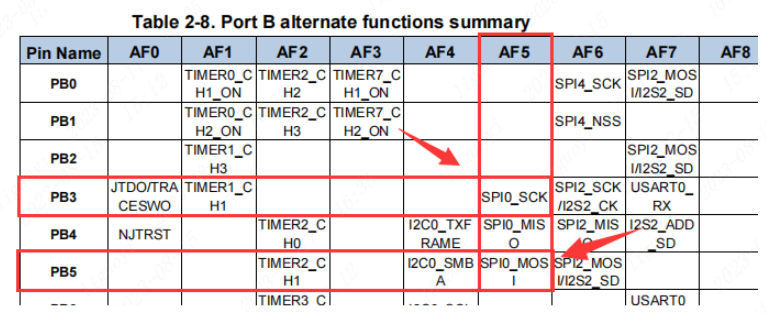
This screen uses SPI communication. To achieve faster refresh rates, we can connect to the hardware SPI pins when selecting the pins for the development board. In this case, we connect PB3 (SPI0_SCK) and PB5 (SPI0_MOSI).
7. Wireless Communication Interface Design
7.1 Introduction to the Wireless Communication Module
This case uses the NF-03 wireless module designed by Anxinke Technology. The NF-03 is a 5mW 2.4G transceiver module. A 2.4G module is used for wireless communication, enabling wireless data transmission and reception in the 2.4GHz band. This module typically consists of a wireless transceiver and related control circuitry, providing users with a convenient wireless communication solution.
Such modules typically have the following characteristics and functions:
2.4GHz Band: The 2.4GHz band is a commonly used wireless communication band with good penetration and long transmission distance, suitable for various wireless communication applications.
Integrated Transceiver Design: The integrated transceiver design enables the module to simultaneously send and receive data, providing a more convenient wireless communication solution.
High-Speed Data Transmission: 2.4G wireless transceiver modules typically have high data transmission rates, meeting the needs of most applications, such as transmitting audio, video, and images.
Low-Power Design: To extend battery life or reduce power consumption, these modules typically employ a low-power design to provide longer operating time.
Ease of Use: 2.4G wireless transceiver modules usually provide easy-to-use interfaces and protocols, facilitating user configuration and control.
Multiple Application Areas: These modules can be widely used in wireless remote control, wireless data transmission, wireless sensor networks, and other fields, providing stable and reliable wireless communication capabilities for various devices and systems. 7.2 Application Circuit Design
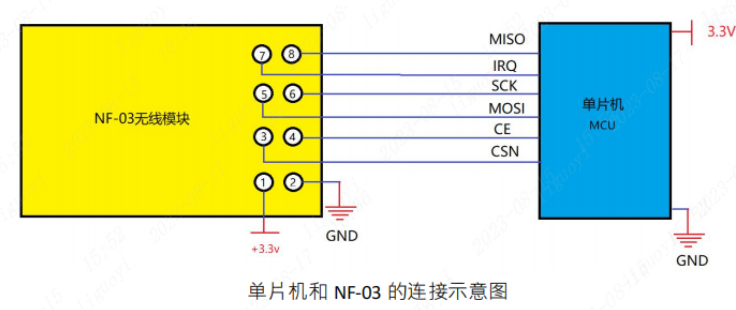
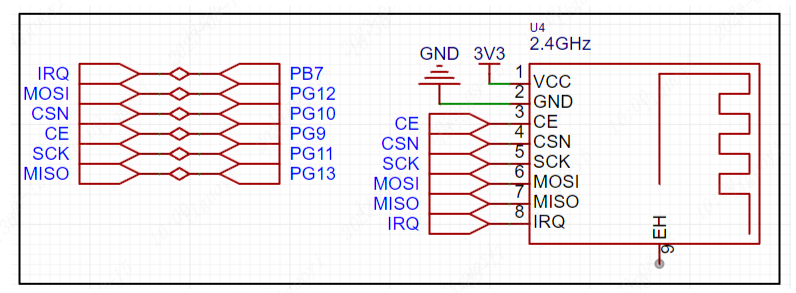
Module pins are as follows:

Note:
CE can be continuously connected to a high level, but the module must be set to power-down mode when writing to the register. It is recommended to connect the CE pin to the microcontroller's GPIO port;
IRQ can be left unconnected, and the interrupt status of the STATUS register can be obtained using SPI polling. However, it is recommended to use the microcontroller's external hardware interrupt, connecting the IRQ to the microcontroller's external trigger pin to trigger the microcontroller interrupt;
ensure good grounding with a large ground plane, low power supply ripple, and add filter capacitors as close as possible to the module's VCC and GND;
the reference circuit in the datasheet is as follows:
the actual application circuit
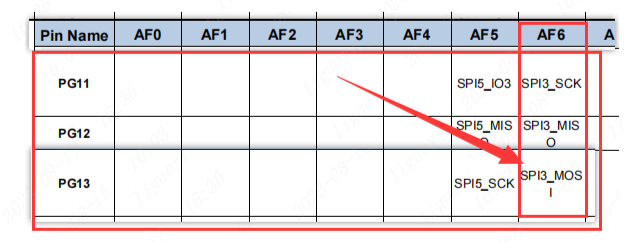
is as follows: This module uses SPI communication. To make the communication speed faster, when selecting the pins to connect to the development board, we can connect to the hardware SPI pins. In this case, PG11 (SPI3_SCK), PG12 (SPI3_MISO), and PG13 (MOSI) are connected.
8. NBIoT Module Interface Design
8.1 Introduction to NBIoT Module
The NBIoT (Narrowband Internet of Things) module is a hardware module specifically designed for narrowband Internet of Things (IoT) communication. It provides a power-saving, low-cost, long-distance communication solution suitable for Internet of Things (IoT) devices and applications.
The following are some of the main features and functions of the NBIoT module:
Narrowband Communication: The NBIoT module uses narrowband communication technology, which has the advantages of low power consumption and long communication distance. Narrowband communication technology can effectively solve the problems of power consumption and coverage limitations faced by IoT devices.
High Coverage: NB-IoT modules offer broad coverage in complex environments, including indoors, outdoors, and underground. They can penetrate walls and obstacles to achieve long-distance communication.
Low Power Design: NB-IoT modules are designed with power optimization in mind to extend device battery life. They employ a low-power mode, activating the wireless module only during data transmission and remaining in sleep mode at other times.
Data Transmission Security: NB-IoT modules provide secure data transmission guarantees. They support security mechanisms such as encryption and authentication to ensure the security of devices and communication data.
Wide Applications: NB-IoT modules can be applied to various IoT devices, such as smart cities, smart agriculture, smart homes, smart energy management, and smart transportation. They provide long-range, low-power, and low-cost communication solutions for these applications.
Compatibility: NB-IoT modules typically have good compatibility and can be integrated with other devices and systems. They support standard NB-IoT communication protocols, connecting and interacting with existing networks and platforms.
Note that using NB-IoT modules requires an IoT SIM card as the network source.
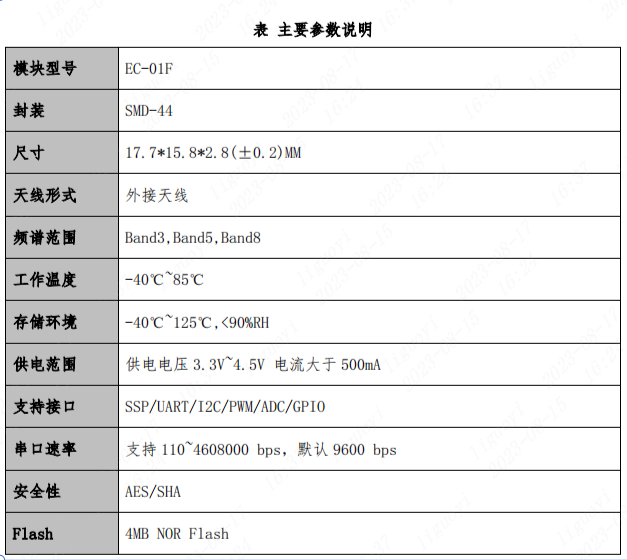
This case study uses the EC-01F, an NB-IoT module developed by Axiomtek. The NB-IoT portion uses the EC616S as its main chip. This chip is a highly integrated NB-IoT SoC, supports ultra-low power consumption, and fully supports the 3GPP Rel14 NB-IoT standard, making it a high-performance NB-IoT chip.

8.2 Application Circuit Design
The module's specifications do not include a complete application circuit. However, the official documentation provides a development board based on the EC-01F, and the schematic is open-source.
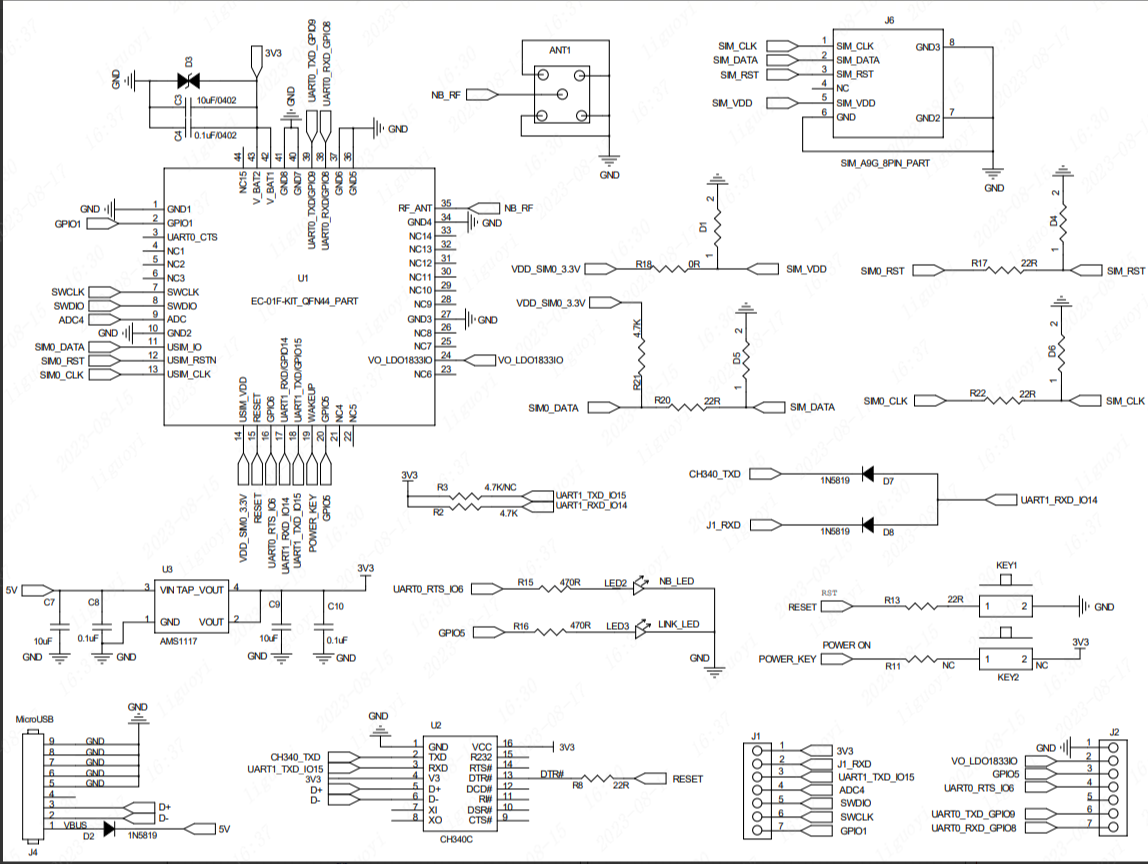
We discarded some unnecessary parts and redrawn the design. We only need the EC-01F, SIM card slot, and antenna mount. The module's power supply requires at least 500mA of current. The 3.3V on our LCSC Liangshanpai development board is derived from a DC-DC circuit, fully meeting the power requirements.
The following is the actual application circuit design:
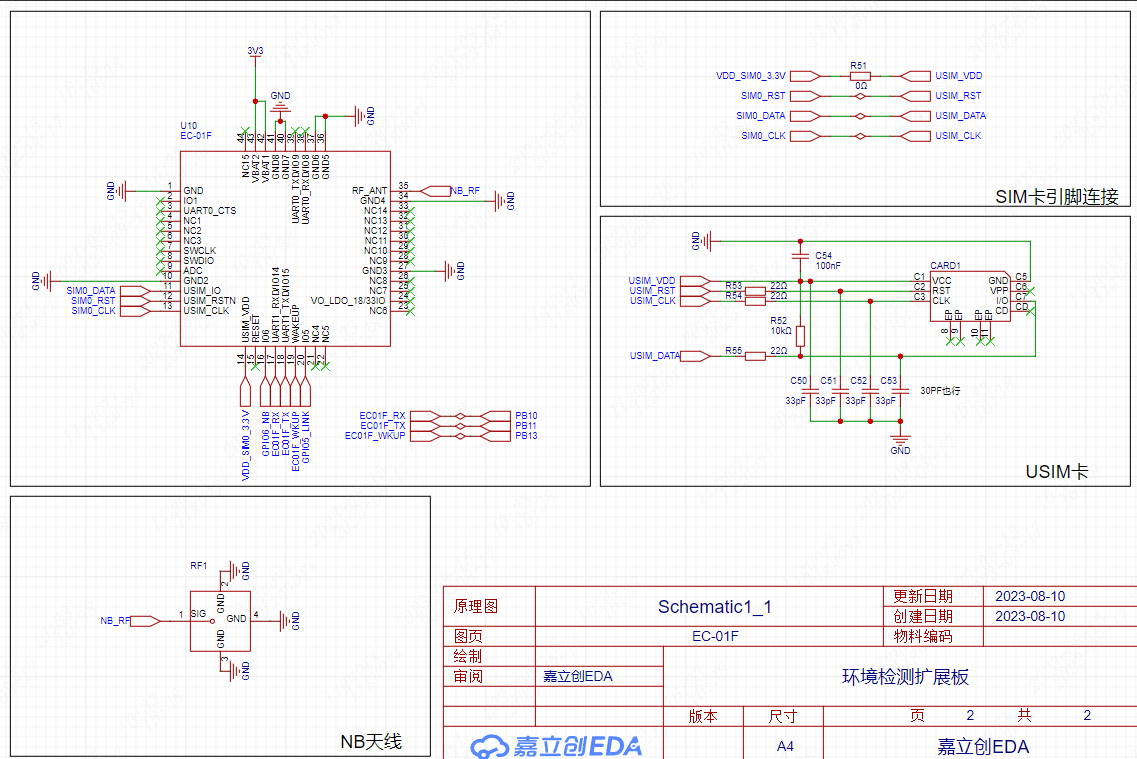
Note that
the 22Ω and 33pF resistors for the USIM card are mandatory; otherwise, it cannot be recognized! Please refer to the specifications for the rest.
For software updates, please see the link: https://lceda001.feishu.cn/wiki/DYKgw6VLai4bYikRh0Hc9wRGnFd?from=from_copylink


 京公网安备 11010802033920号

 PS2833-4-V