Video link for a whole-house environmental quality monitoring station based on ESP32-C3
:
JLCPCB ESP32 IoT Call for Entries – Whole-House Environmental Quality Monitoring Station Based on ESP32-C3
Project Introduction:
Sensors are a crucial component of smart homes. While various smart sensors are available on the market, they are typically closed-source. Therefore, I wanted to develop my own smart sensor. It can connect to Home Assistant and integrate with smart home systems like Mi Home. One sensor can be placed in each room, acting as an independent monitoring station to record environmental changes in each room and control individual air conditioners, air purifiers, curtains, and lights. Besides sensing traditional data, its most important feature is its compact size; it can be placed on a table, hung on a wall, or placed by the bedside. It also boasts long battery life, lasting up to half a month on a single charge.
Project Functionality
: The ESP32-C3 is a secure, stable, low-power, and low-cost IoT chip from Espressif Systems. It features a RISC-V 32-bit single-core processor and supports 2.4 GHz Wi-Fi and Bluetooth 5 (LE). Based on this, and paired with several peripheral sensor chips, our sensors can detect and upload the following key indoor environmental indicators:
temperature,
humidity ,
air pressure, estimated altitude,
PM.5 and PM10,
ambient light intensity,
and eTVOC (volatile organic compounds) .
In addition to the aforementioned sensors, the eTVOC monitoring station also has a series of locally interactive peripherals:
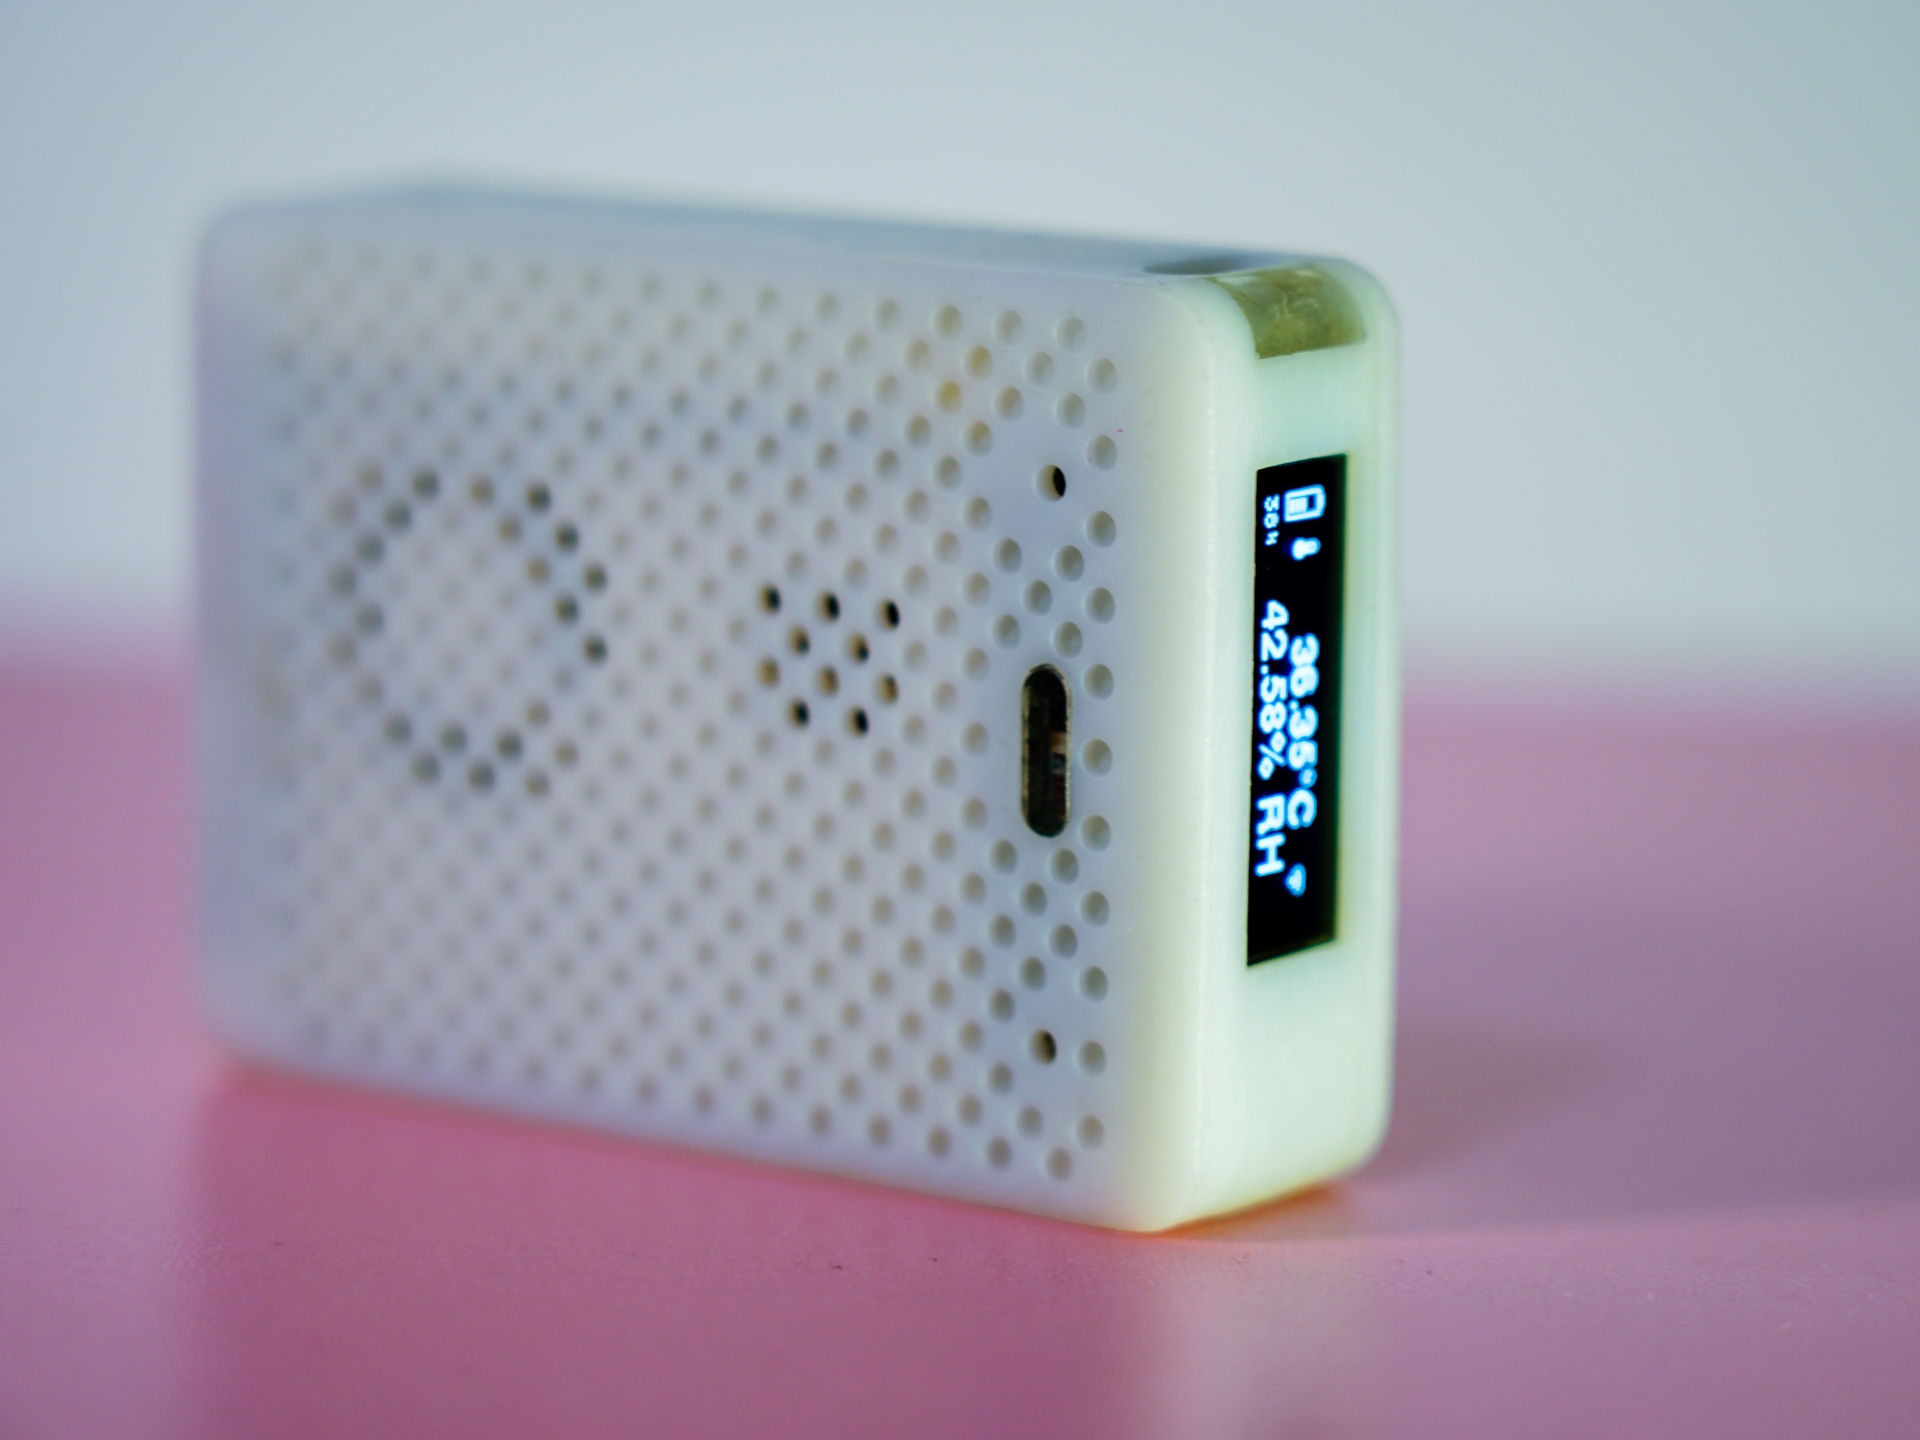
a 0.91-inch OLED screen that displays the station's battery level, time, signal strength, and information collected by each sensor;
a button for switching display pages and waking from sleep mode;
a set of three-color breathing lights to indicate battery charging, network connection status, and operating status;
a buzzer for issuing remote control prompts; and
a USB Type-C interface for charging and debugging. Since it's a
monitoring
station, measurement is its primary function. The performance indicators of the main measurement parameters are as follows:
Temperature measurement accuracy: ±0.5% (low power consumption operation)
; Humidity measurement accuracy: ±3%;
Air pressure measurement accuracy: ±0.5 hPa
; PM2.5 measurement
accuracy: ±10%; Ambient light measurement accuracy: ±0.5%;
TVOC measurement accuracy: 0.5 ppm
; Angle measurement accuracy: 0.1°
; Vibration measurement accuracy: 0.2 m/s².
The working environment requirements are as follows:
Working temperature range: -10℃ ~ 60℃;
Working humidity range: 0% ~ 99% (non-condensing);
Working pressure range: 300~1250 hPa (0 ~ 9000m @ 25℃)
; PM2.5 measurement range: 0-500 ug/m³
; Illuminance measurement range: 0~83865 Lux;
TVOC concentration range: 0~1000 ppm;
Angle measurement range: 0~360° (each axis)
; Vibration measurement range: ±40 m/s² (each axis).
The monitoring station's own parameters are as follows:
Dimensions: 70 × 50.1 mm. × 16 mm
Weight: 60 g
Battery Capacity: 500 mAh
Low Power Consumption: 22 days
WiFi Band: 2412~2484MHz
Hardware Description
This indoor monitoring station consists of the following main parts: 1) Main control board, 2) Sensor board, 3) FPC board, 4) Battery, 5) PM2.5 sensor module, 6) WiFi antenna, 7) Housing. The main control board circuit block diagram is shown in Figure 1, and the sensor board circuit block diagram is shown in Figure 2.

Figure 1--Main Control Board Circuit Block Diagram
All circuit designs of the main control board are basically based on the low power consumption design of ESP32-C3.
The Espressif Systems ESP32-C3 connects to a WiFi antenna for internet access and sleeps when inactive to reduce power consumption.
An on-chip ADC, along with I/O, collects battery voltage and provides charging alerts with very low power consumption via I/O control.
I2C connects to most sensors, controls the OLED screen and LED breathing light display, and manages sensor board status information via I/O expanders. The OLED screen's I2C is isolated from the bus, so disconnecting the OLED does not affect bus operation.
The serial port connects to the PM2.5 sensor module and reuses the infrared control and receiving modules; disconnecting the I/O when not in use results in almost no power consumption.
The USB port connects to a Type-C-16P interface, using built-in CDC and JTAG for downloading and debugging, as well as power supply and charging; disconnecting the I/O when not in use results in almost no power consumption.
GPIO manages the device's power supply, charging status, low-power control, peripheral reset, and button reading, with only a small amount of power consumption during control enable.
LEDC controls the buzzer output and consumes no power when not in use.

Figure 2 – Sensor Board Circuit Block Diagram.
Due to space constraints and the fact that the ESP32-C3 can only connect to a limited number of I/O interfaces, the sensor board is designed around the I/O expander, sharing the I2C bus and connecting to the motherboard via a 10-pin connector.
The I/O expander is used to collect interrupts from each sensor and control sensor power supply and signal switching, etc.;
the EEPROM is used to store calibration data and sensor hardware information, facilitating subsequent updates and backward compatibility with the sensor board;
the accelerometer/angular velocity sensor is used to detect the spatial position of the device and can control screen flipping and vibration detection;
the ambient light sensor can obtain indoor light intensity and control the display brightness of the device;
the temperature and humidity sensor can measure indoor temperature and humidity;
the barometer can measure indoor air pressure and temperature;
the TVOC sensor can measure indoor organic matter and carbon dioxide content;
the infrared transmitter is used for device remote control, and the infrared receiver can learn special remote control commands;
the PM2.5 module is relatively large and built into the casing, connecting to the sensor board and main control board via an FPC flexible cable.

Figure 3 – Main Control Board Power Block Diagram.
The power architecture design directly affects the low-power performance of the entire device. The selection principle prioritizes lower power consumption, and the wake-up and sleep currents for each circuit module are marked.
Battery management uses a charging chip with path management; part of the current from the USB input powers the battery, and part powers the system, extending battery life.
The main power supply is divided into three paths: one path goes to an ultra-low-power buck chip, converting it to 3.3V for the main system; the three-color LED driver chip can achieve self-low-power management and is directly connected to the main power path; the boost circuit is controlled and has a built-in output shutdown function, used to power the PM2.5 module.
The 3.3V power supply is also divided into three paths: one path is directly connected to the ESP32-C3, ensuring that the RTC clock always works even in sleep mode; the OLED screen power supply is controlled, only connected to the power supply when the display is woken up; most sensor connections are uncontrolled, as most have sleep or standby modes, and the infrared transceiver uses the same logic as the serial port, only powering on when the infrared function is used;
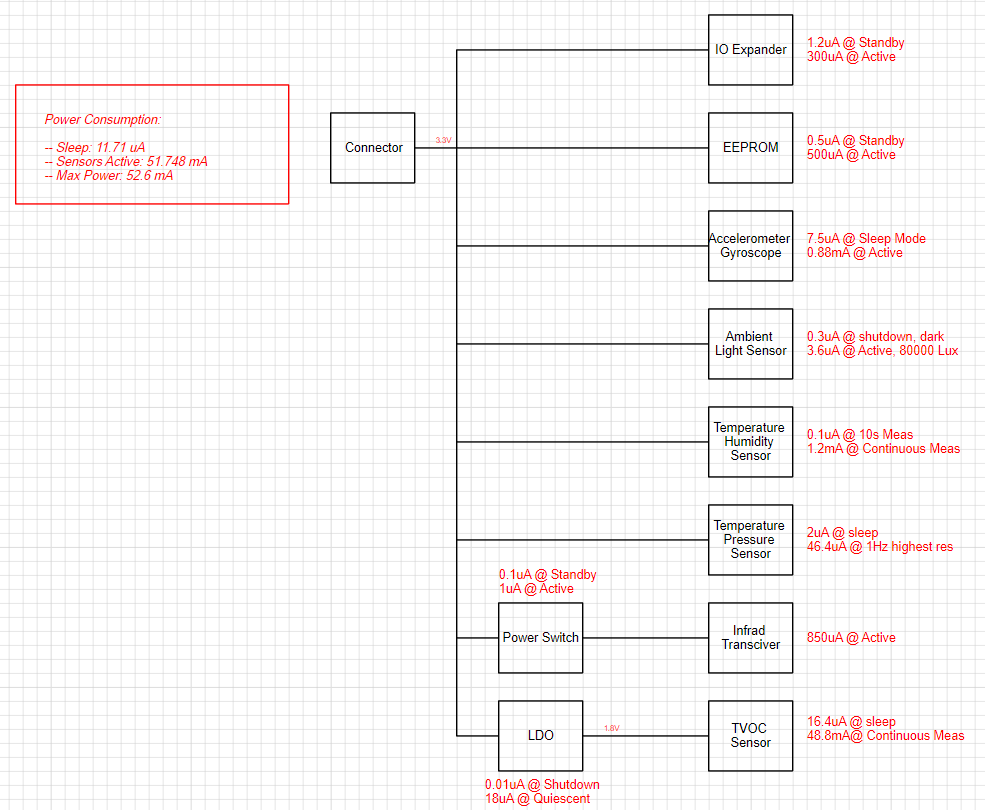
Figure 4 - Sensor Board Power Supply Block Diagram.
The TVOC sensors on the sensor board require 1.8V power supply and do not have sleep mode, so an LDO with enable is selected for controlled processing. In this way, the sensor board only requires 11.71uA when all sensors are in sleep mode, and consumes 52.6mA when all sensors are woken up.
Based on the current consumption of each circuit module, the following current budget table was obtained:

Figure 5 - System Current Budget Table
. Based on unattended use, we set the sleep time percentage to 99%, the sensor wake-up time (excluding PM2.5) to 0.9%, the wake-up time for all sensor modules to 0.09%, and the time for maximum WiFi transmission power consumption to 0.01%. This roughly calculates an average current of approximately 0.91mA. Thus, a small 500mAh lithium battery can last for nearly 23 days! If 10% of the battery is reserved for heartbeat wake-up, it's sufficient for 20 days of normal use.
Circuit fabrication:
First, thanks to JLCPCB for the coupons and fast prototyping, which greatly shortened the development cycle.
Due to time constraints, we had LCPCB SMT mount 5 components for this prototyping, which yielded excellent results, much better than hunching over to solder the board.
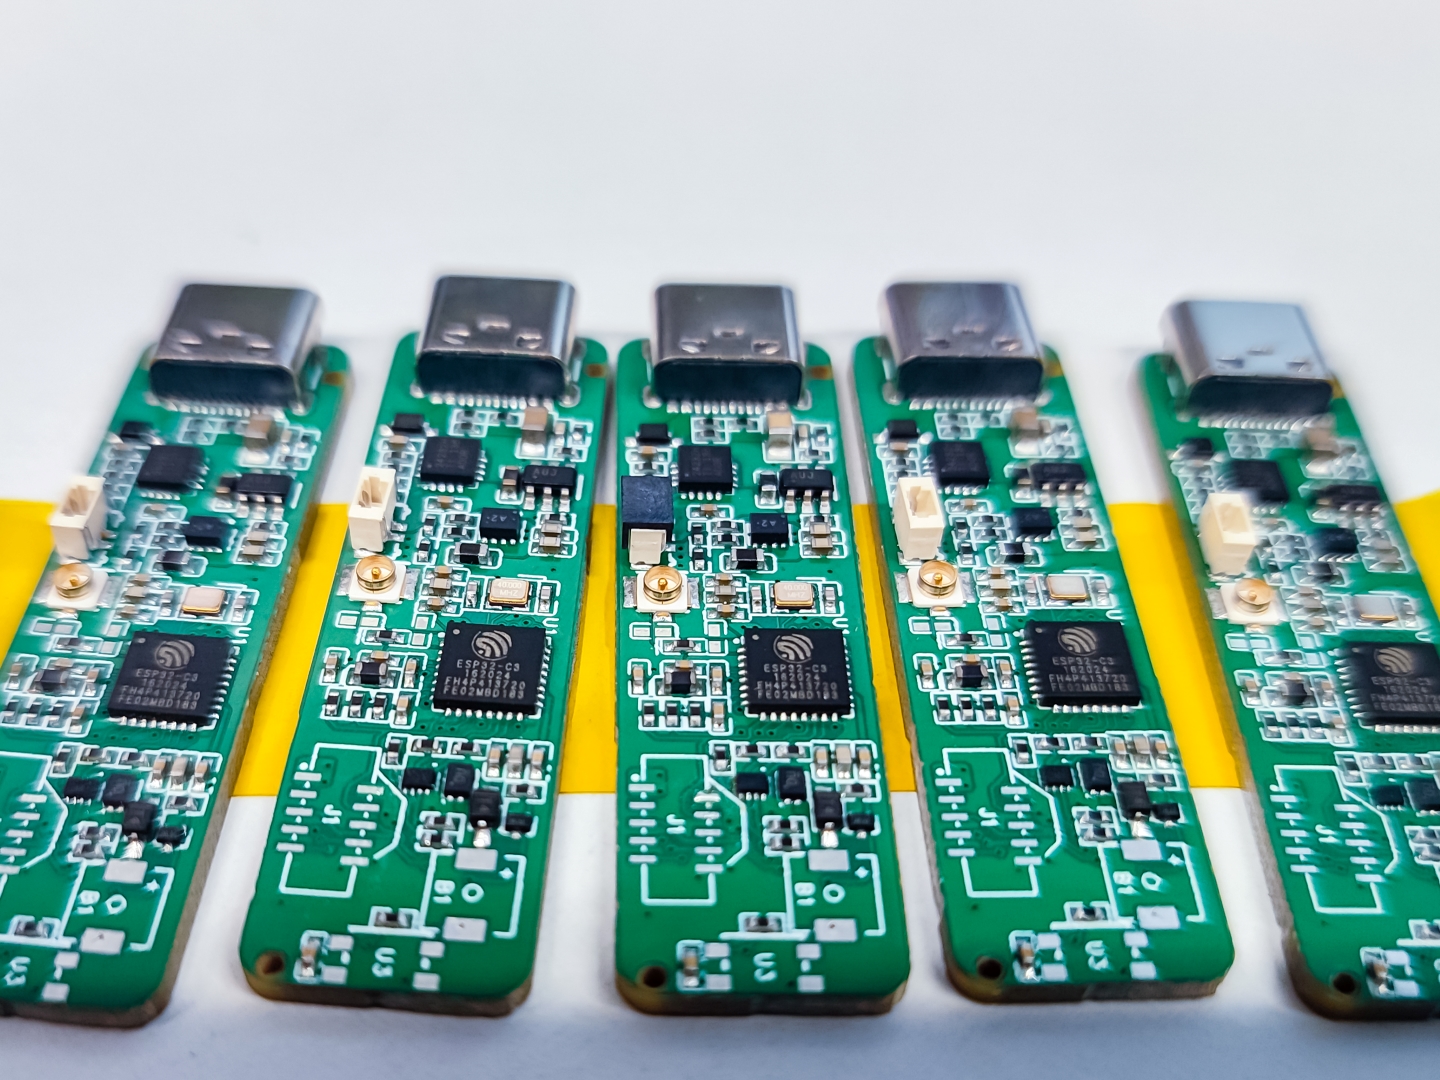
Figure 6 - Board returned from LCPCB SMT.
After adding the remaining missing components, the main control board is ready.
Since the sensor boards were too small to be mounted on the machine, we ultimately chose to create a stencil and solder them ourselves. The components are not difficult to solder, so no pictures are included. For those with the financial means, you can also get it done through JLCPCB.
LCPCB's one-stop service is excellent; with a coupon, the FPC sample printing is practically free, and it arrived quickly. I soldered the socket and tested it—perfect.
Then I bought a battery and FPC antenna from Taobao. Here's a family photo!
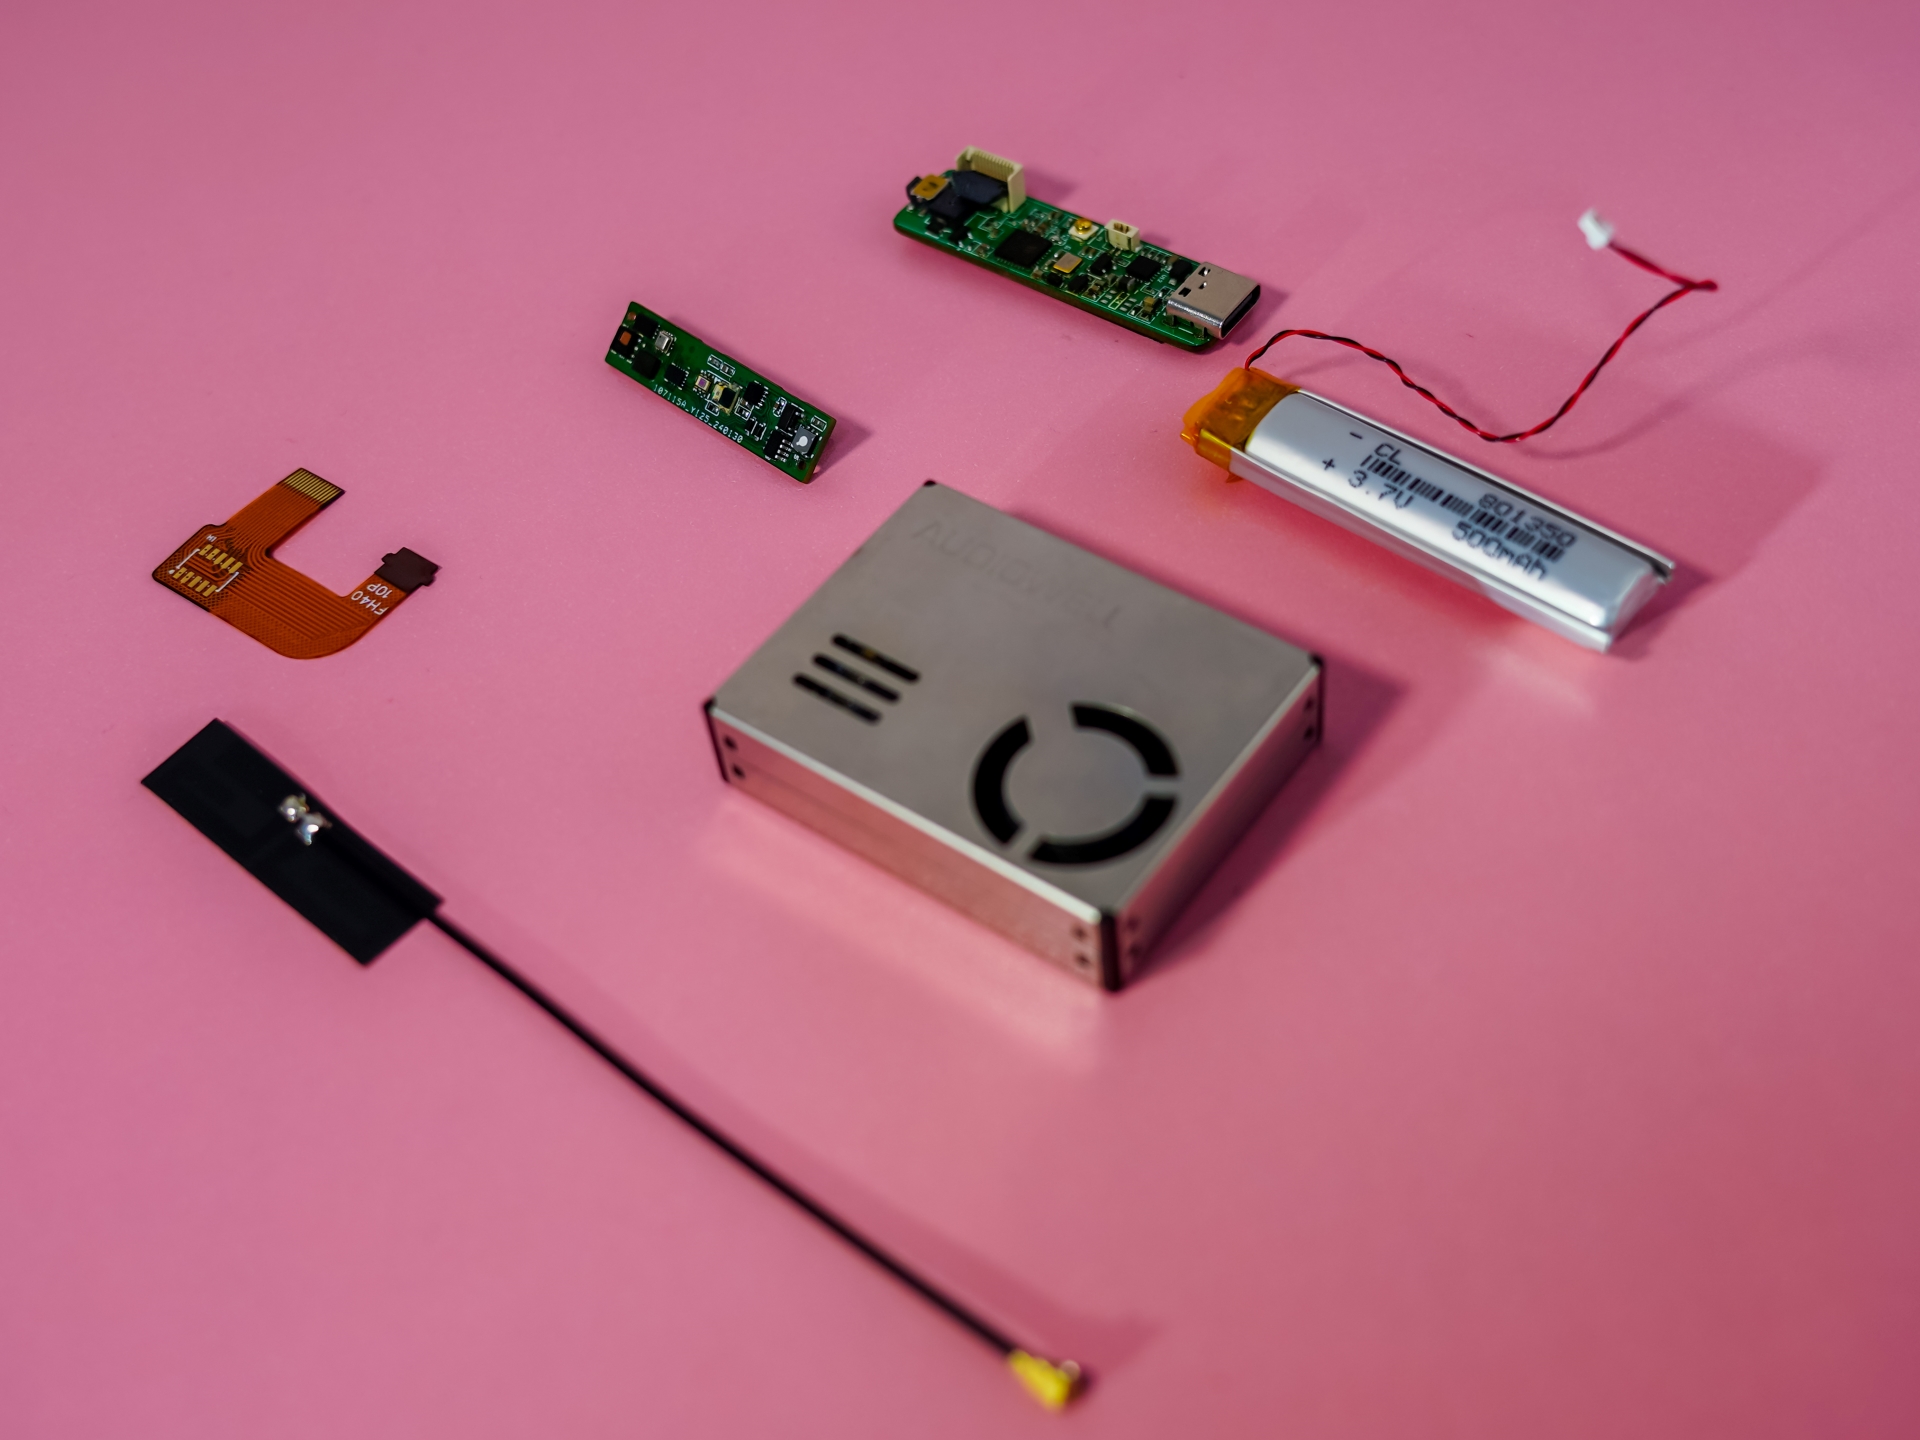
Figure 7—Hardware Family Photo. The structural components
for
the sensor were drawn in Fusion360 and printed by JLCPCB. A total of five shell parts were printed, including the main body, back cover, semi-transparent light window, transparent window, and buttons.
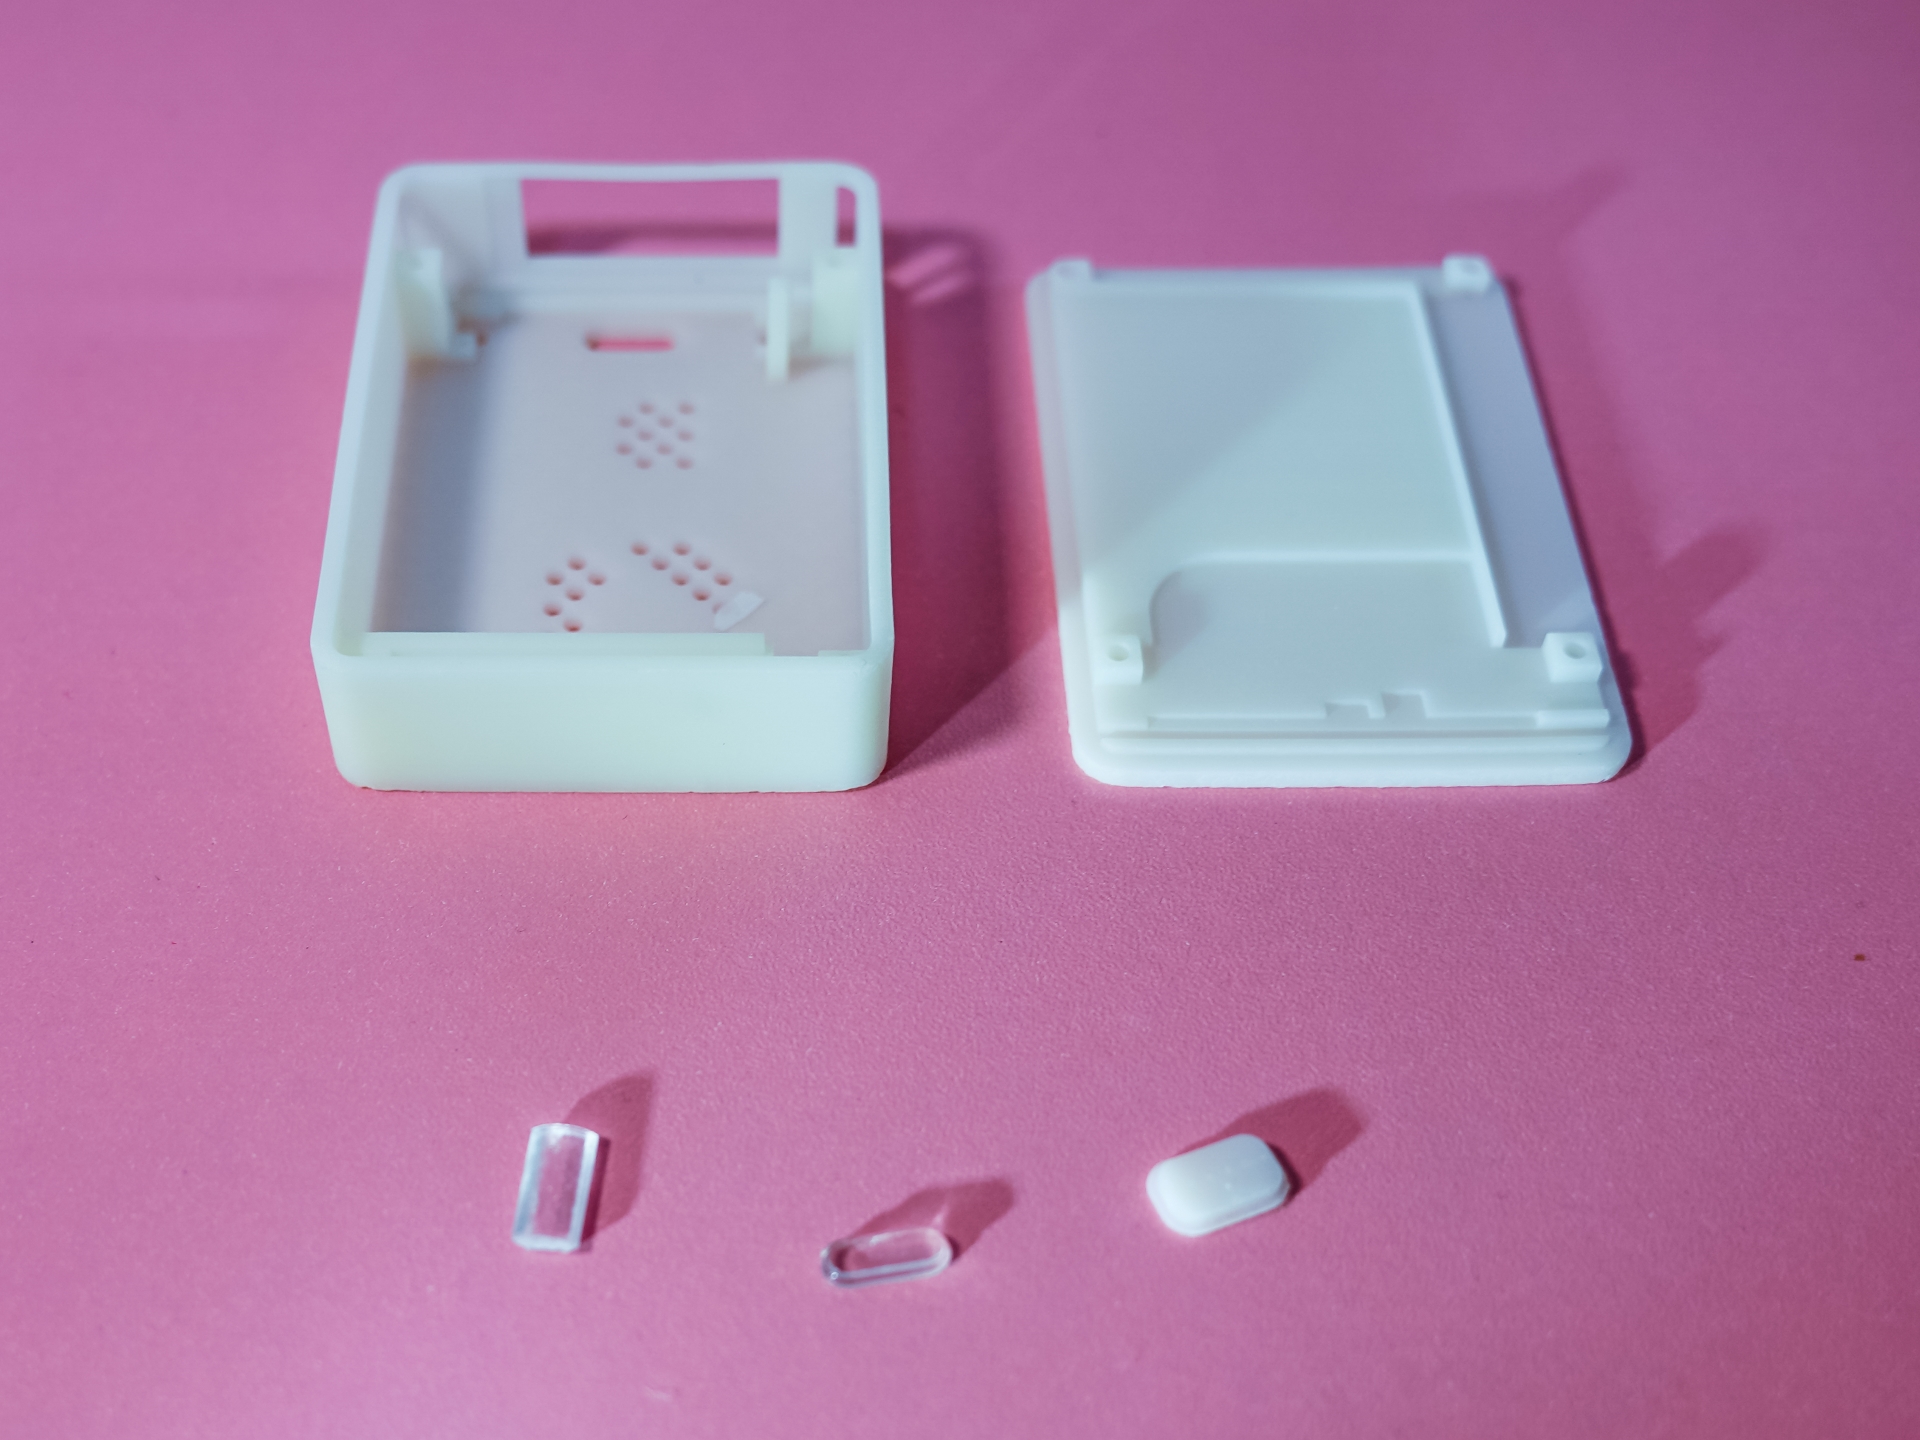
Figure 8—Structural Components Family Photo .
Assembly wasn't difficult. Insert the transparent parts into the main body, place the buttons in their corresponding holes, and you can easily install the motherboard by snapping it into the slot in the main body.
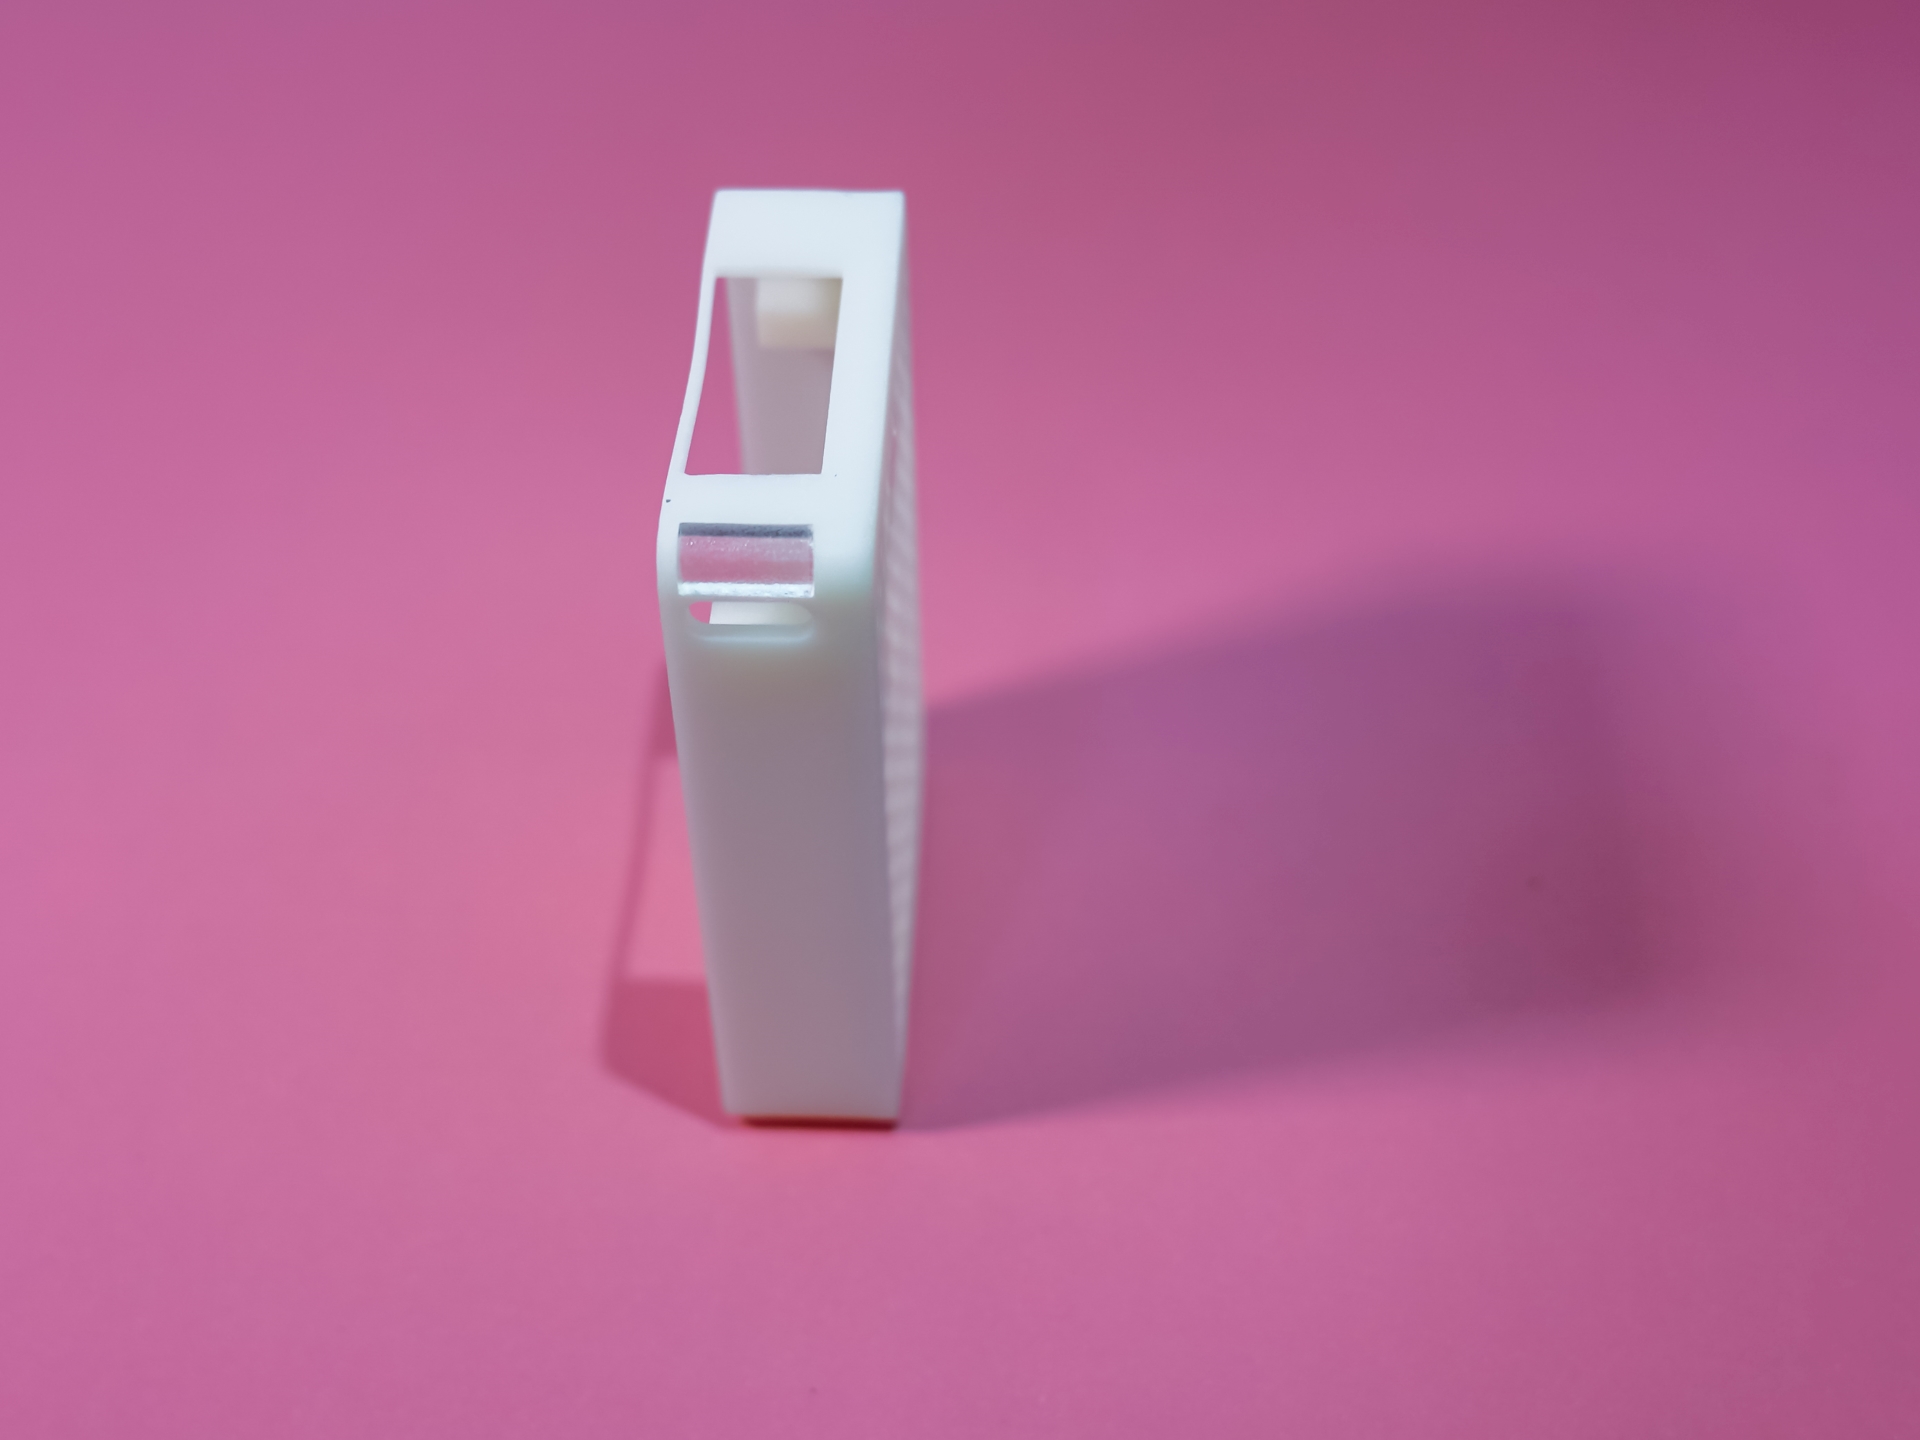
Figure 9—Semi-transparent Light Window Installation .
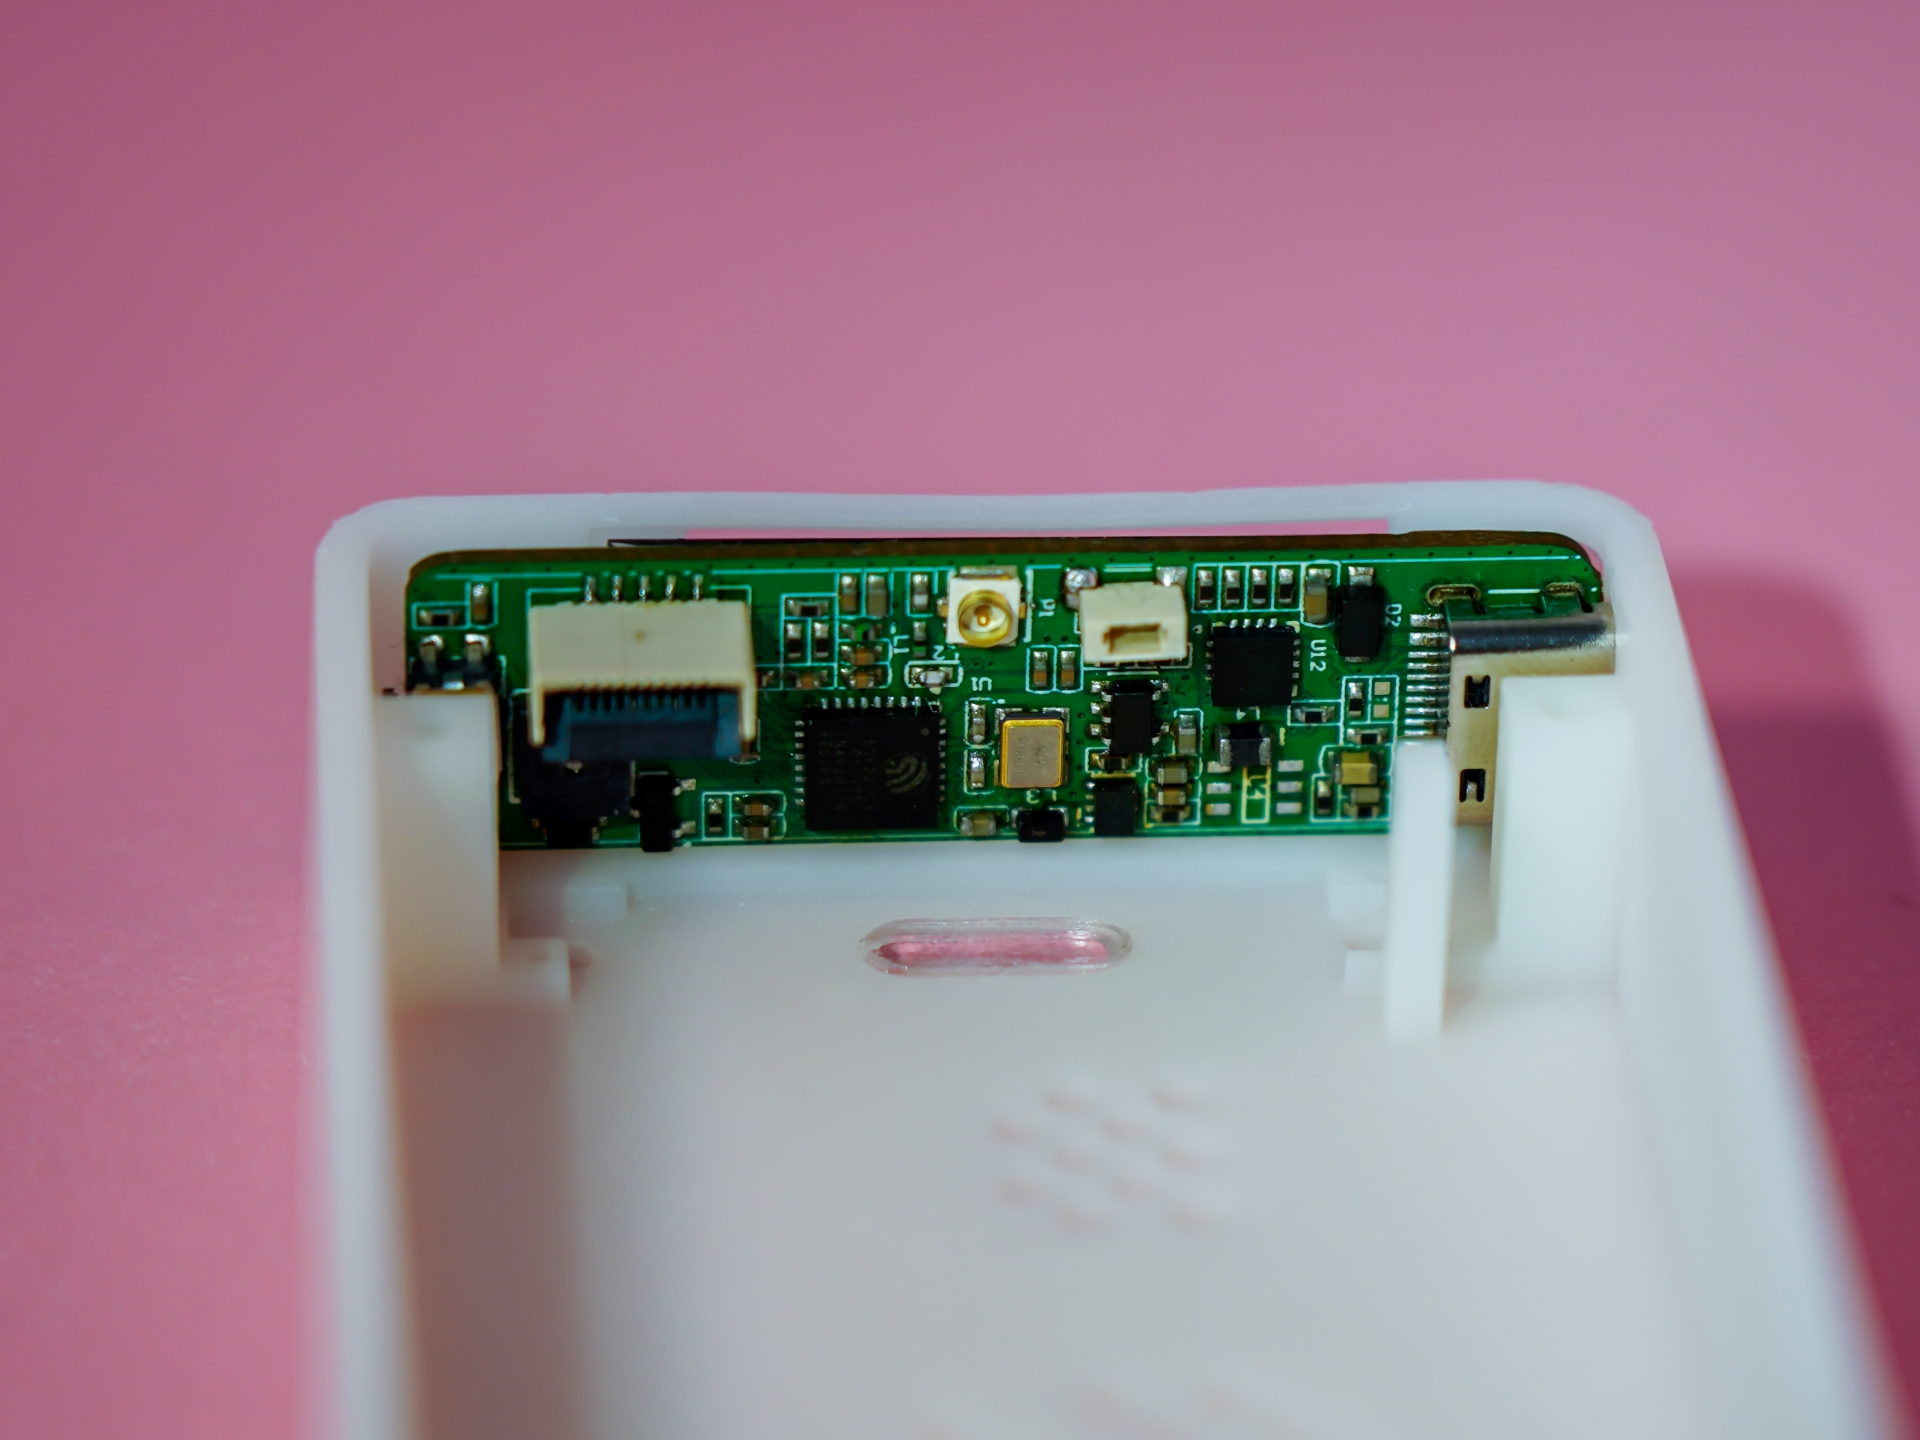
Figure 10—Window and Main Control Board Installation.
Then, I placed the PM2.5 sensor and sensor board inside. The sensor motherboard is secured to the bottom shell with M1 screws. The printing precision determines whether installation will be successful; if it's too tight, tighten it; if it's too loose… just loosen it a little, as long as the screws don't fall out.
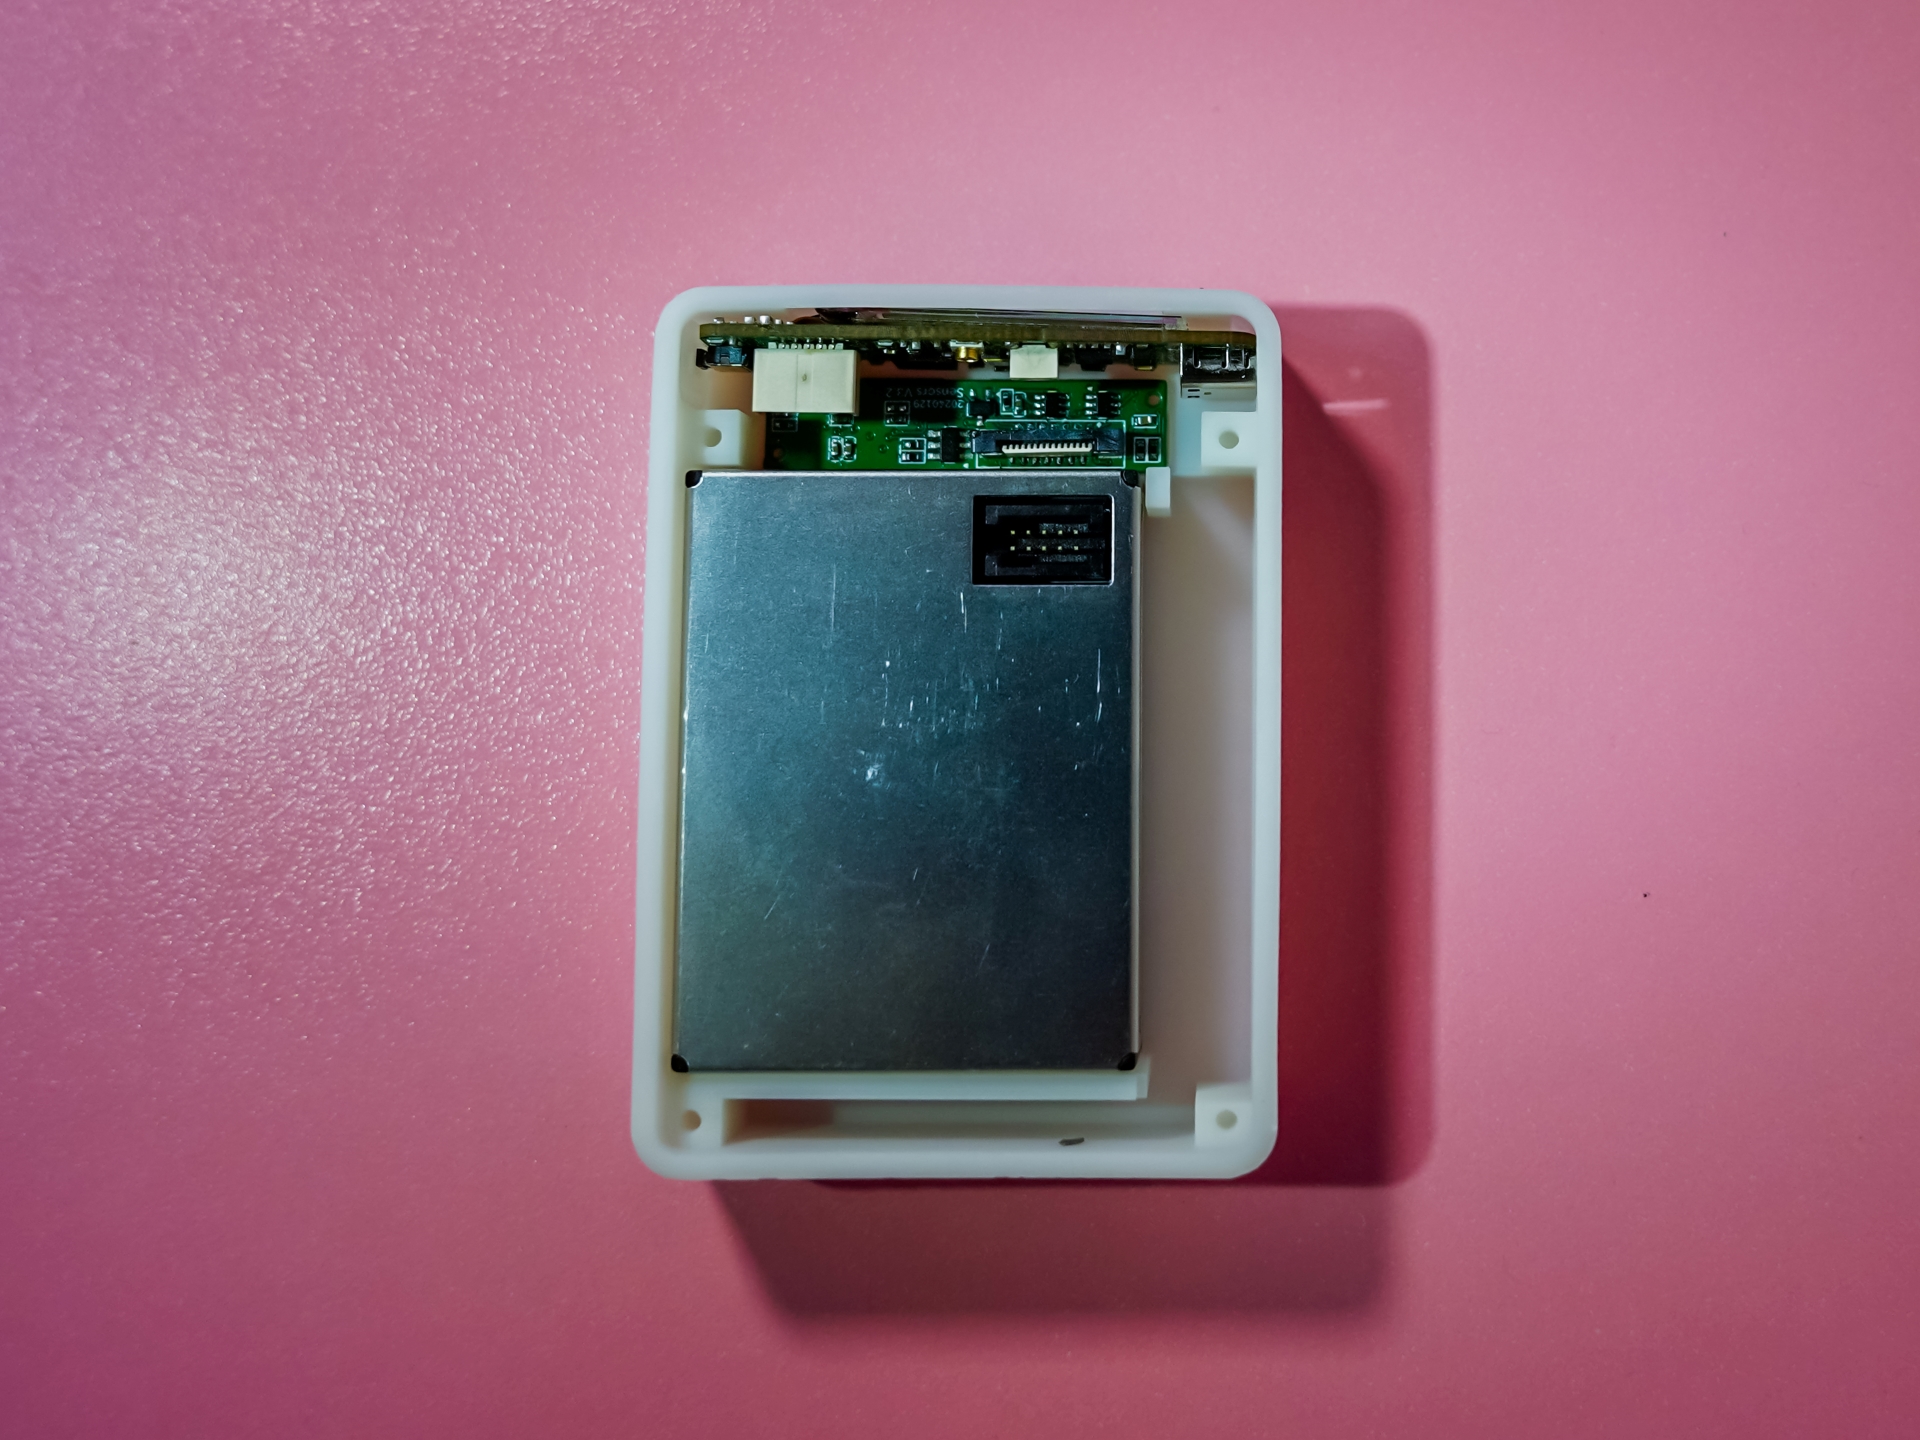
Figure 11 – PM2.5 Sensor and Sensor Board Installation:
Install the battery, FPC antenna, and FPC cable, tidy up the wiring. You can see that this small PM2.5 module already occupies 70% of the entire unit's area. With the battery and other components, the overall space is quite compact.
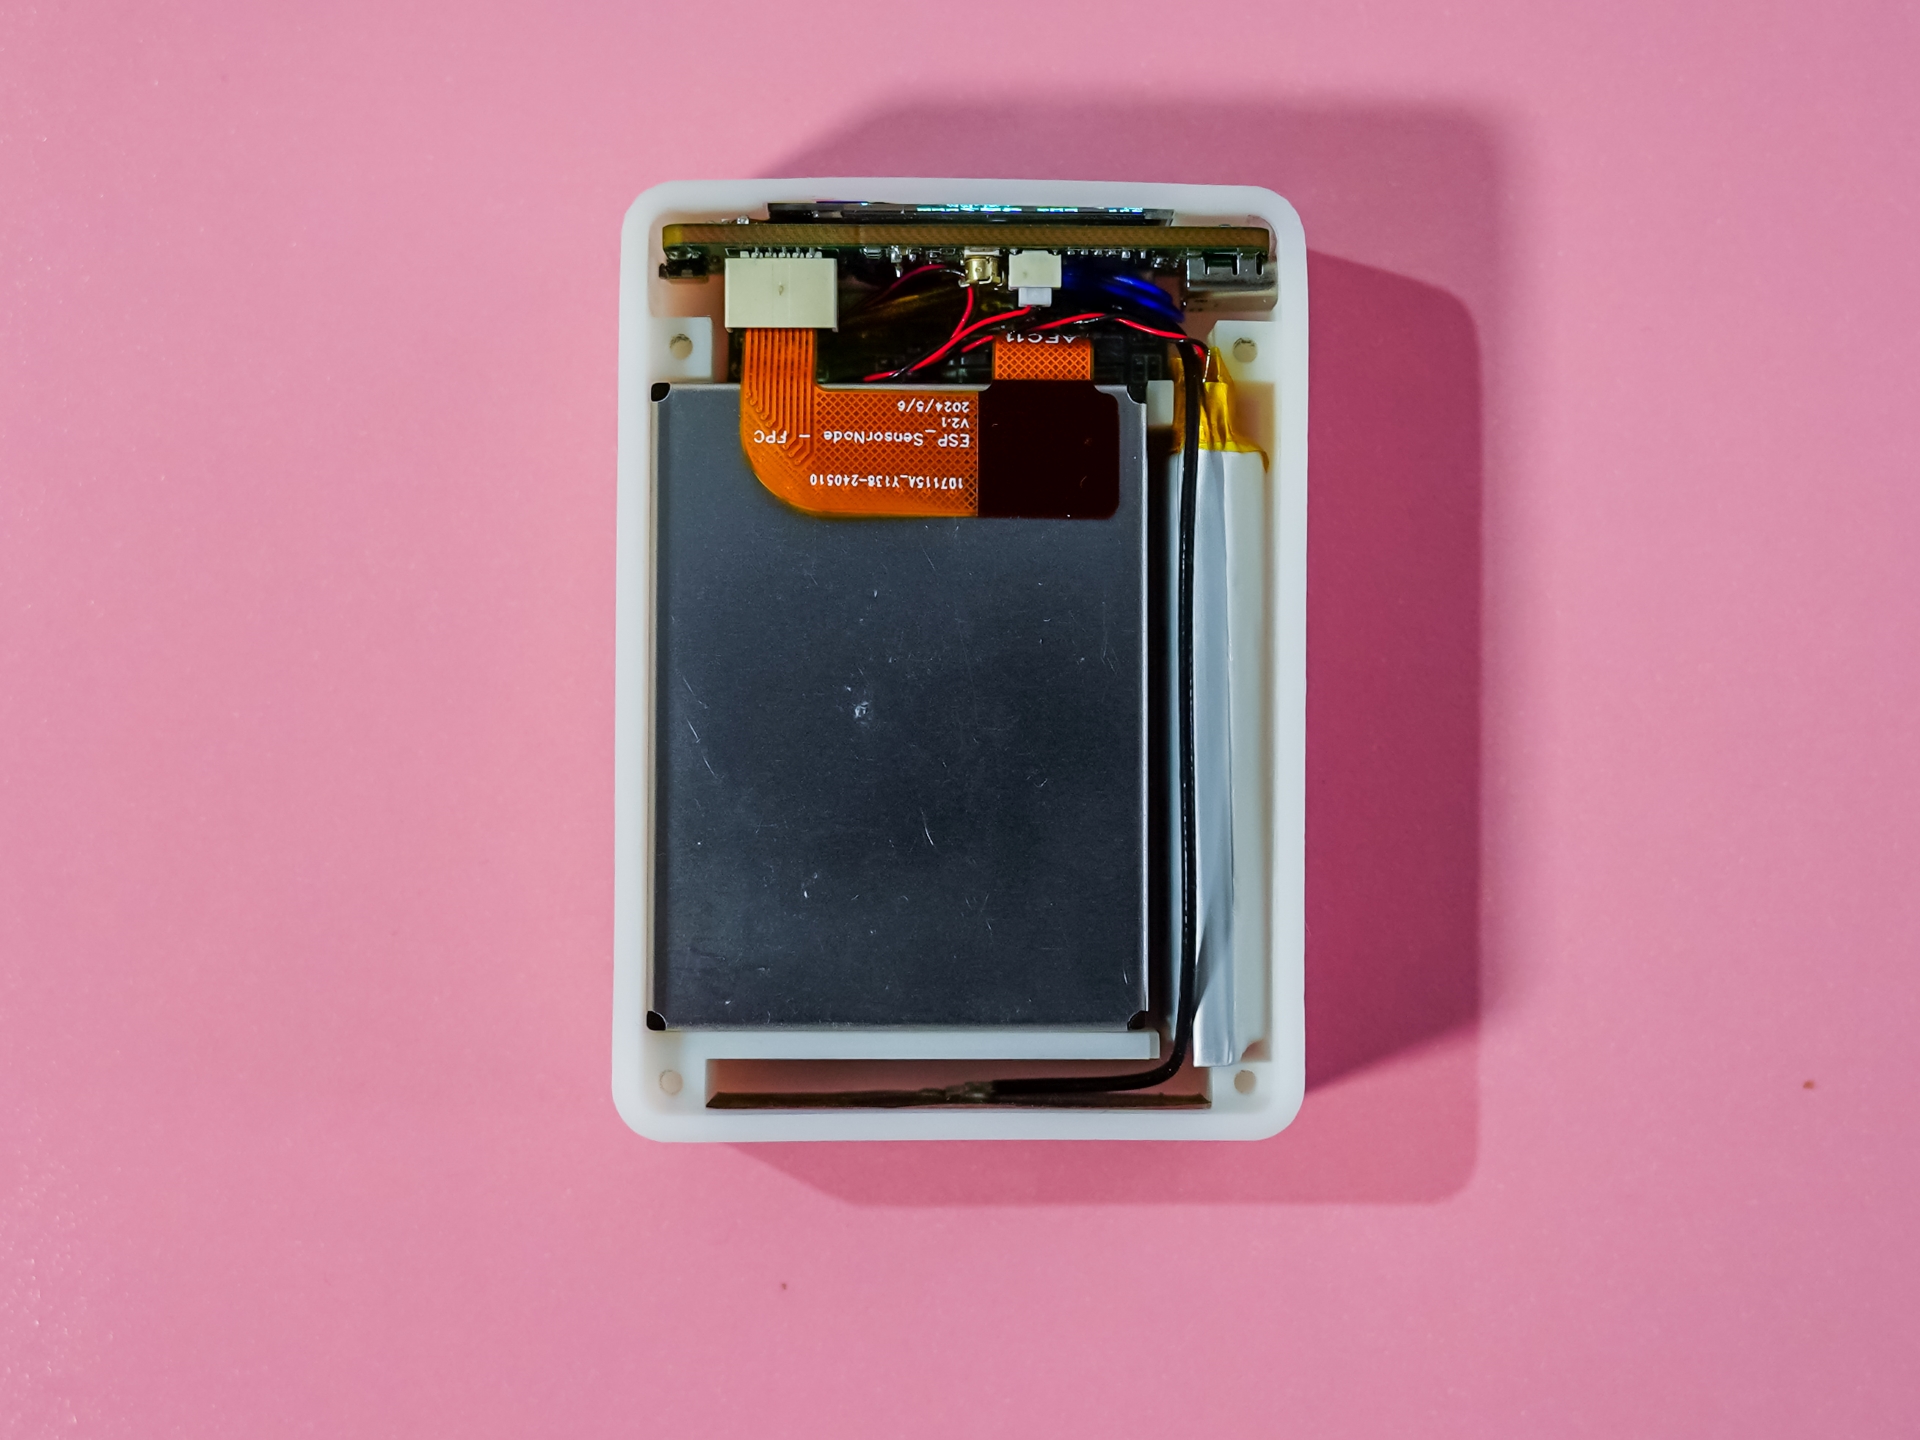
Figure 12 – Remaining Component Installation:
Finally, we put on the back cover and tighten the four M2 screws. Our smart monitoring station is now complete!

Figure 13 – Success!
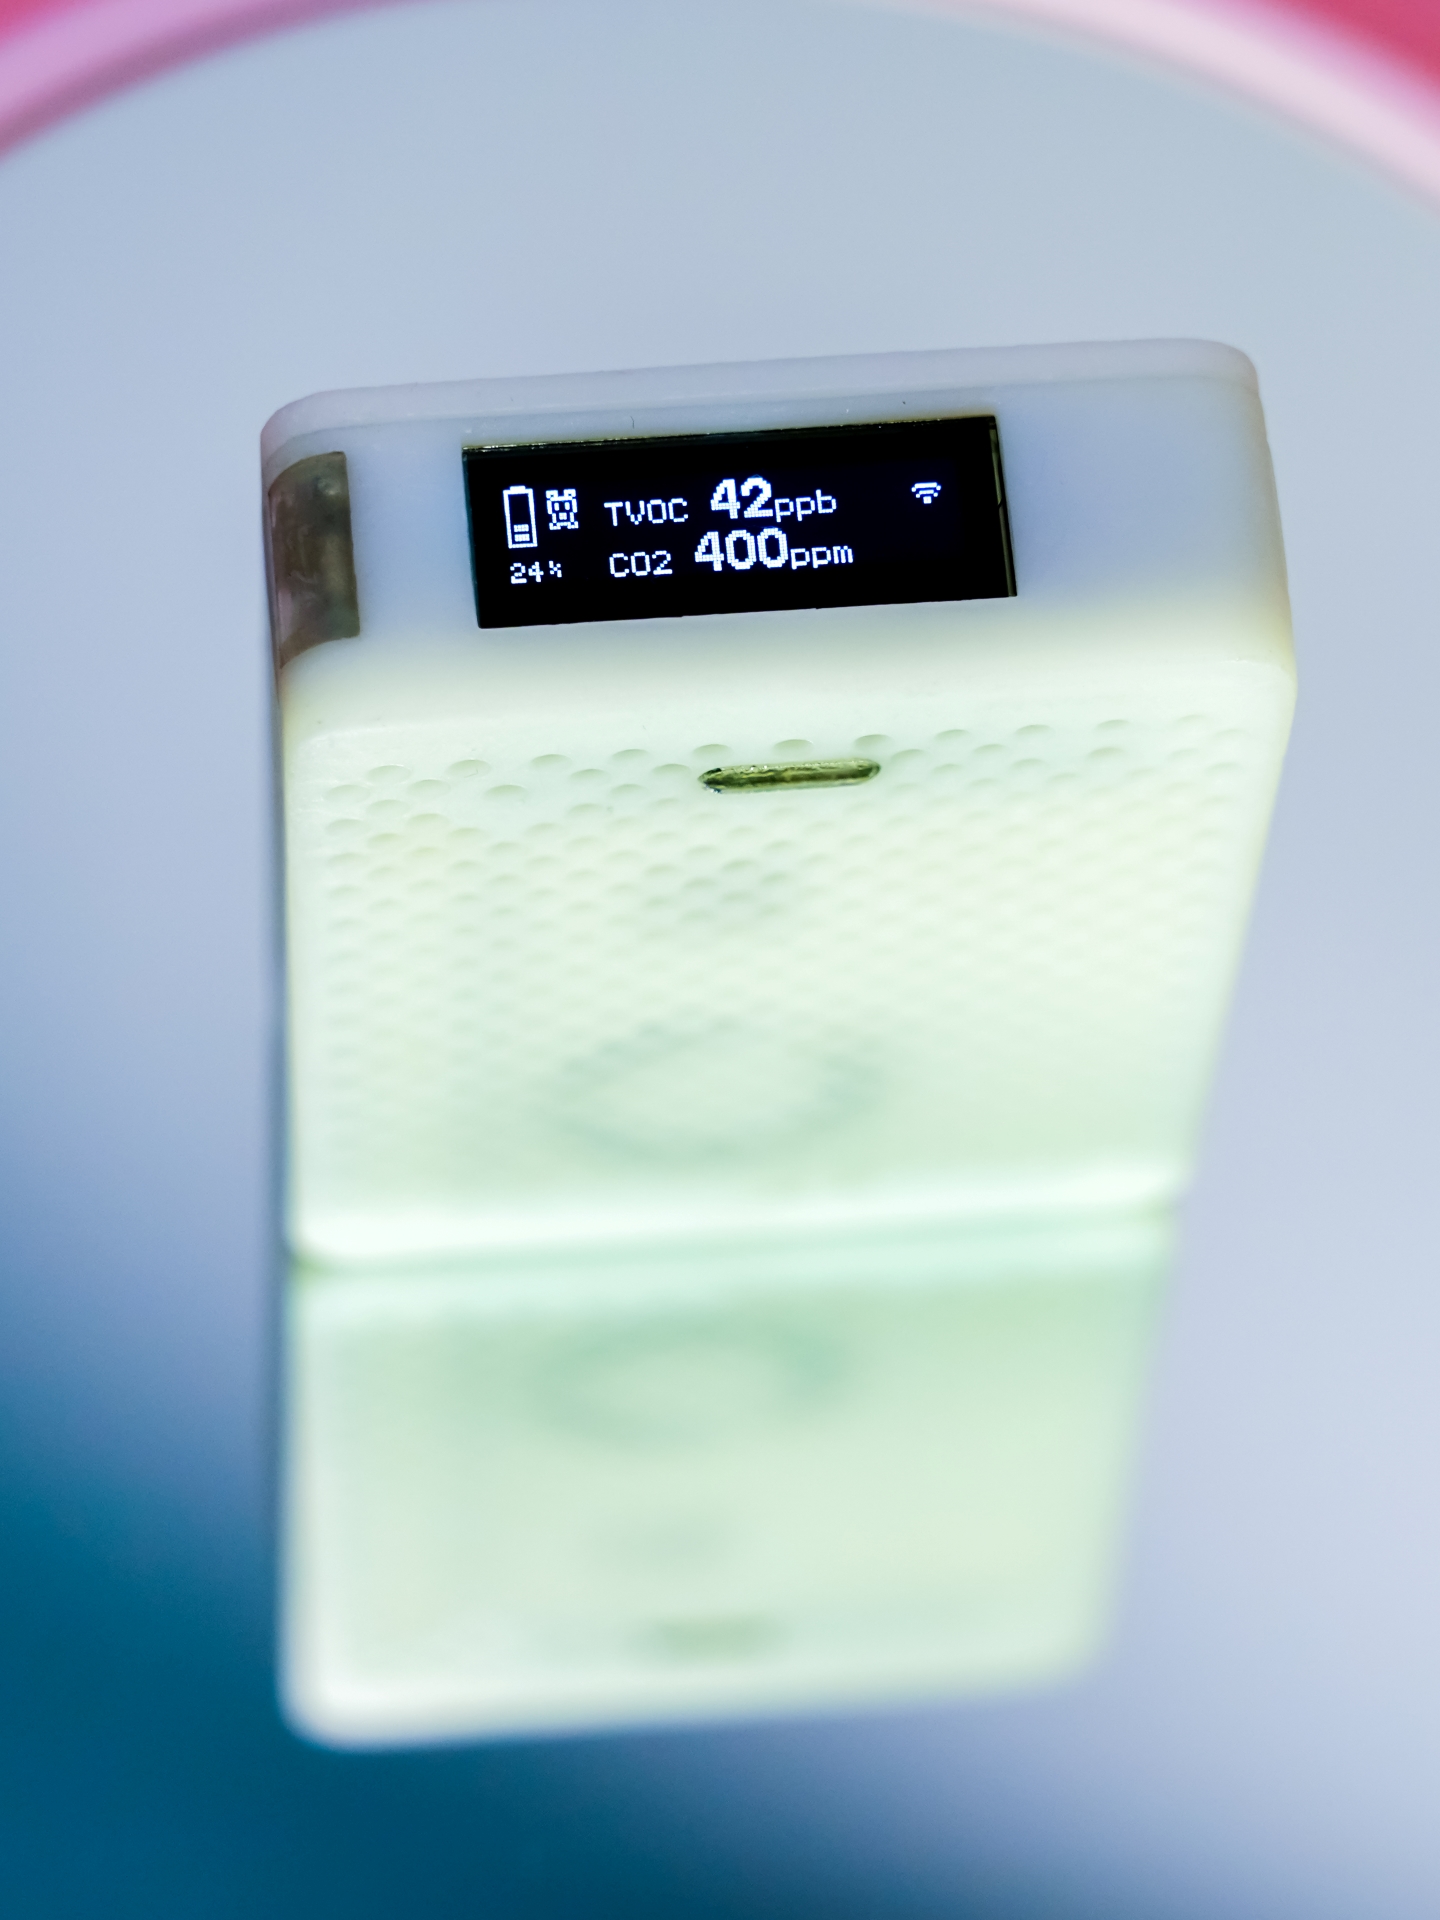
Figure 14 – Taking an Artistic Photo:
Software Design:
The software is designed based on PlatformIO and Arduino, currently written in bare metal. The block diagram is as follows:
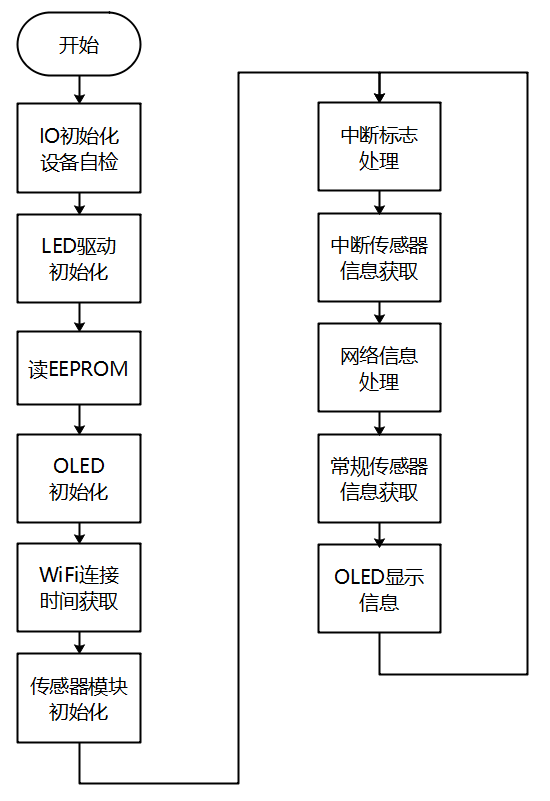
Figure 14 – Software Flowchart:
After waking up the device, the initialization process begins.
After completing IO initialization, the online status of each sensor is checked, and the cause of any errors is investigated to prevent subsequent crashes.
Next, the LED driver is initialized. The LED driver is an independently operating control chip; after receiving a control command, it doesn't need to occupy the CPU and can automatically complete the breathing light effect.
Calibration information and the list of mounted devices are read from the EEPROM. If a device doesn't match the online sensor, the corresponding initialization is skipped and won't be called again later.
The OLED initialization is determined based on the power status; if the user wakes it up by pressing a button, initialization is performed.
Next, WiFi connection and network time synchronization are performed. The network connection hasn't been optimized yet; the SSID and password need to be written before compilation.
Once everything is ready, each sensor module is initialized, and calibration parameters are written.
The loop first handles interrupt flags and retrieves information from the corresponding sensors, such as temperature and humidity sensors and light sensors.
After handling the interrupt, network information and general sensor information are read, and finally displayed on the OLED or sent to the HA.
The low-power section still needs improvement and some optimization is required.
For program burning, a USB Type-C cable can be used to connect to a computer, compile in VSCode, and then upload to start working.
In closing,
I'd like to thank Espressif Systems and JLCPCB for their generous support of this event, which allowed group members to benefit and provided an opportunity for everyone to create something interesting and exchange ideas.
The event was short-lived, and as a full-time office worker, I only had two or three hours a day to work on it. The project progressed with some setbacks, and I frantically worked on it for the last two days. Many details remain unresolved, and I'll continue to refine it. I humbly request the help of all the experts...


 京公网安备 11010802033920号

 RB201
RB201