I. Project Introduction
: This section introduces team members, school information, and awards.
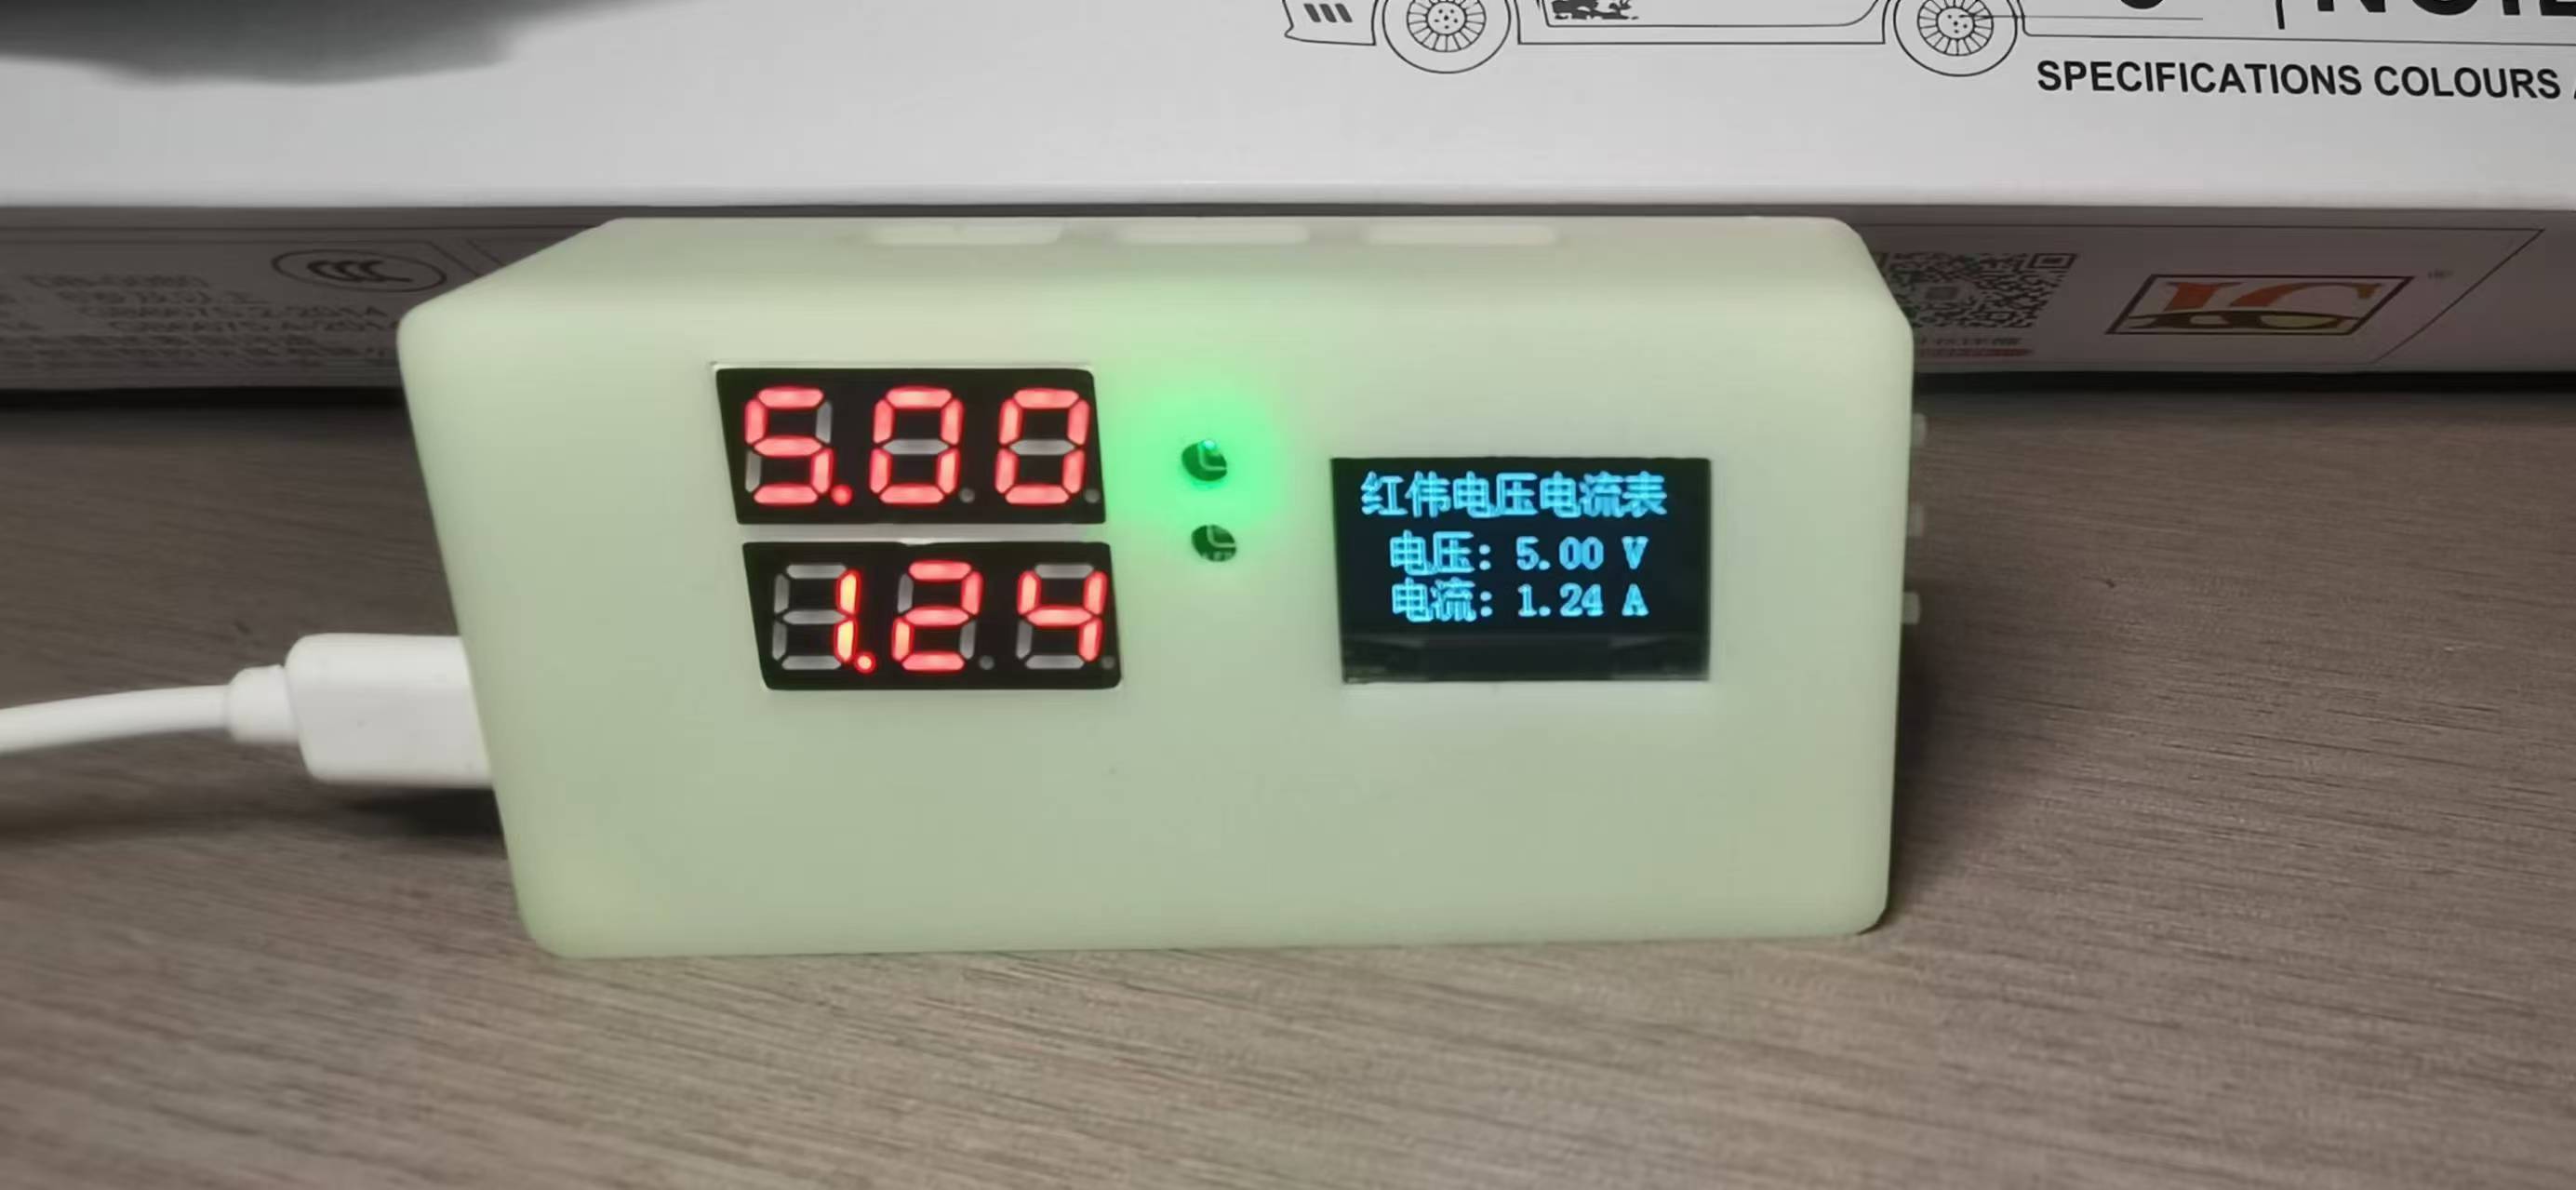
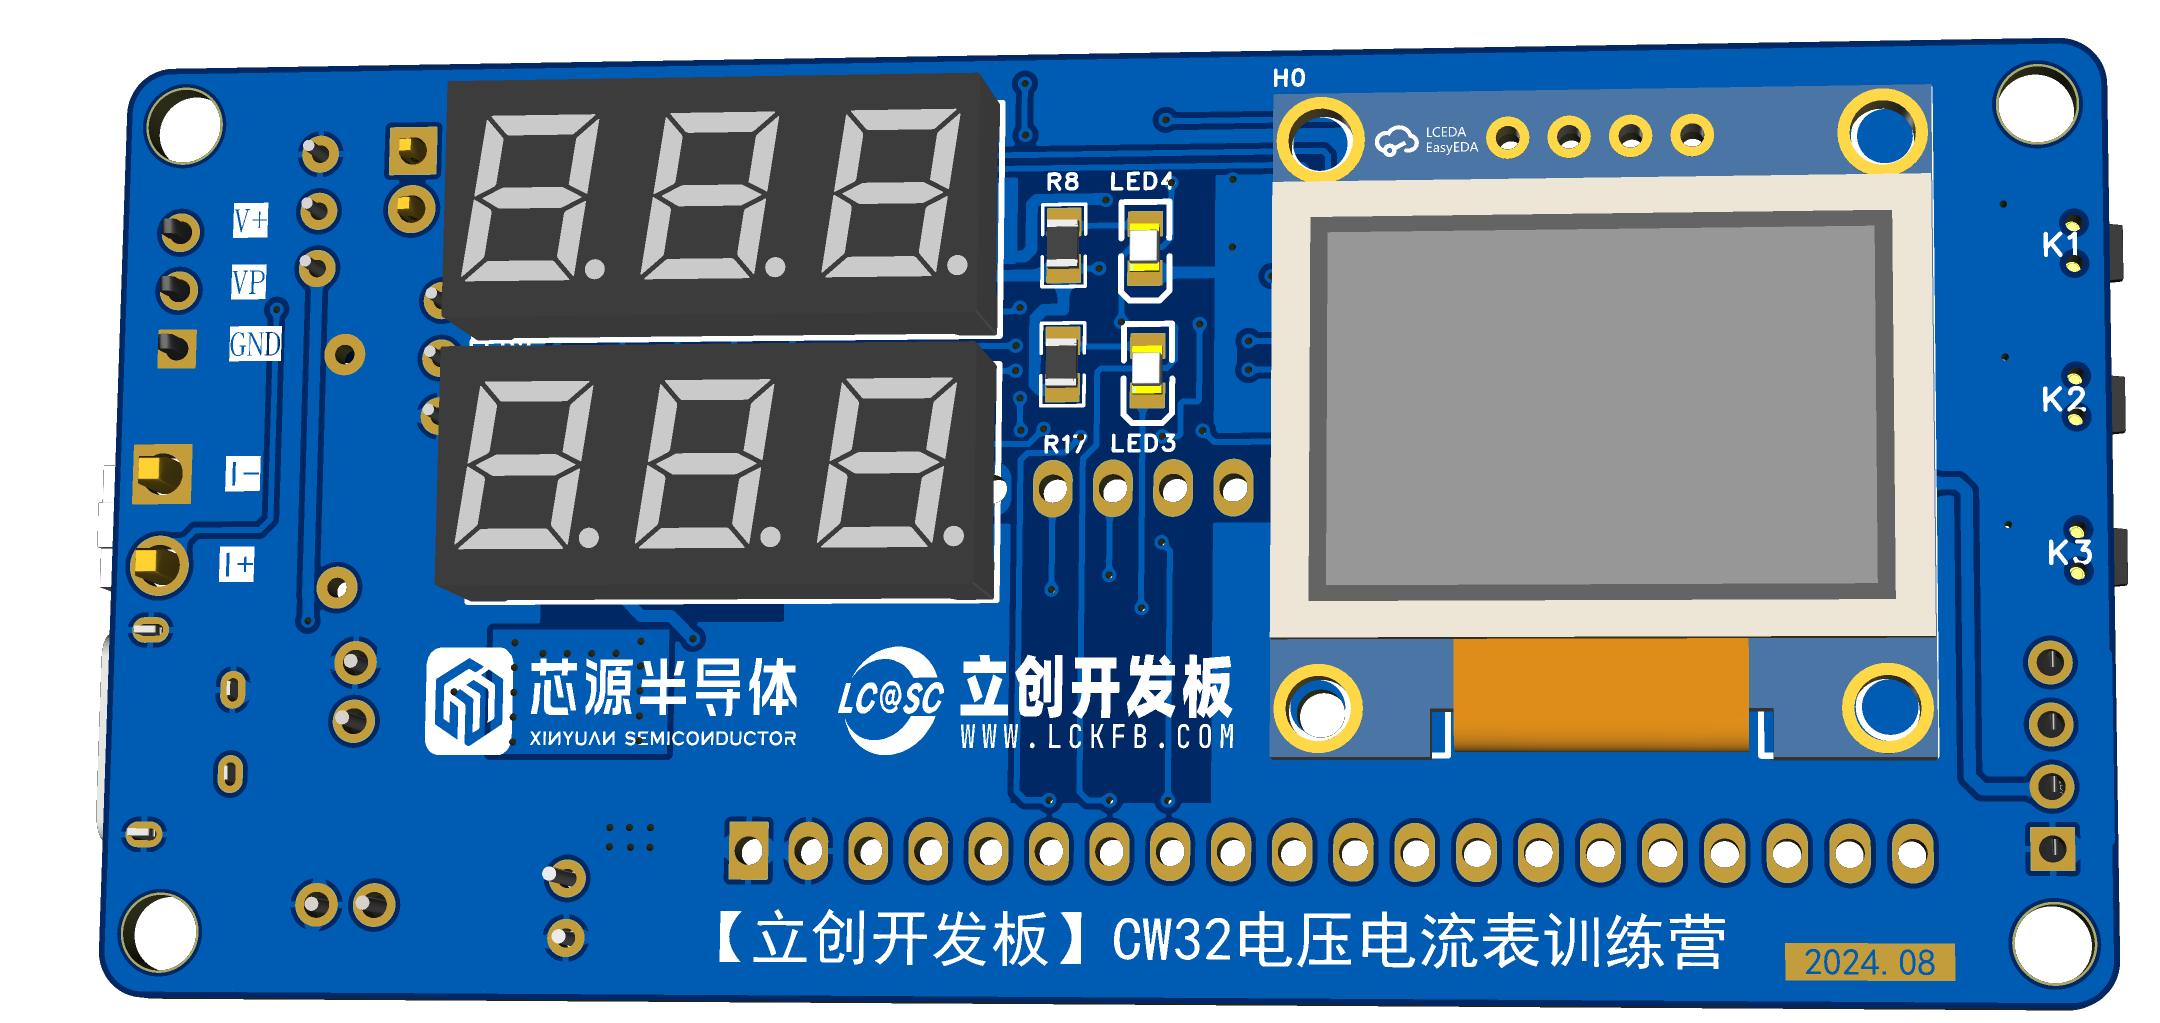
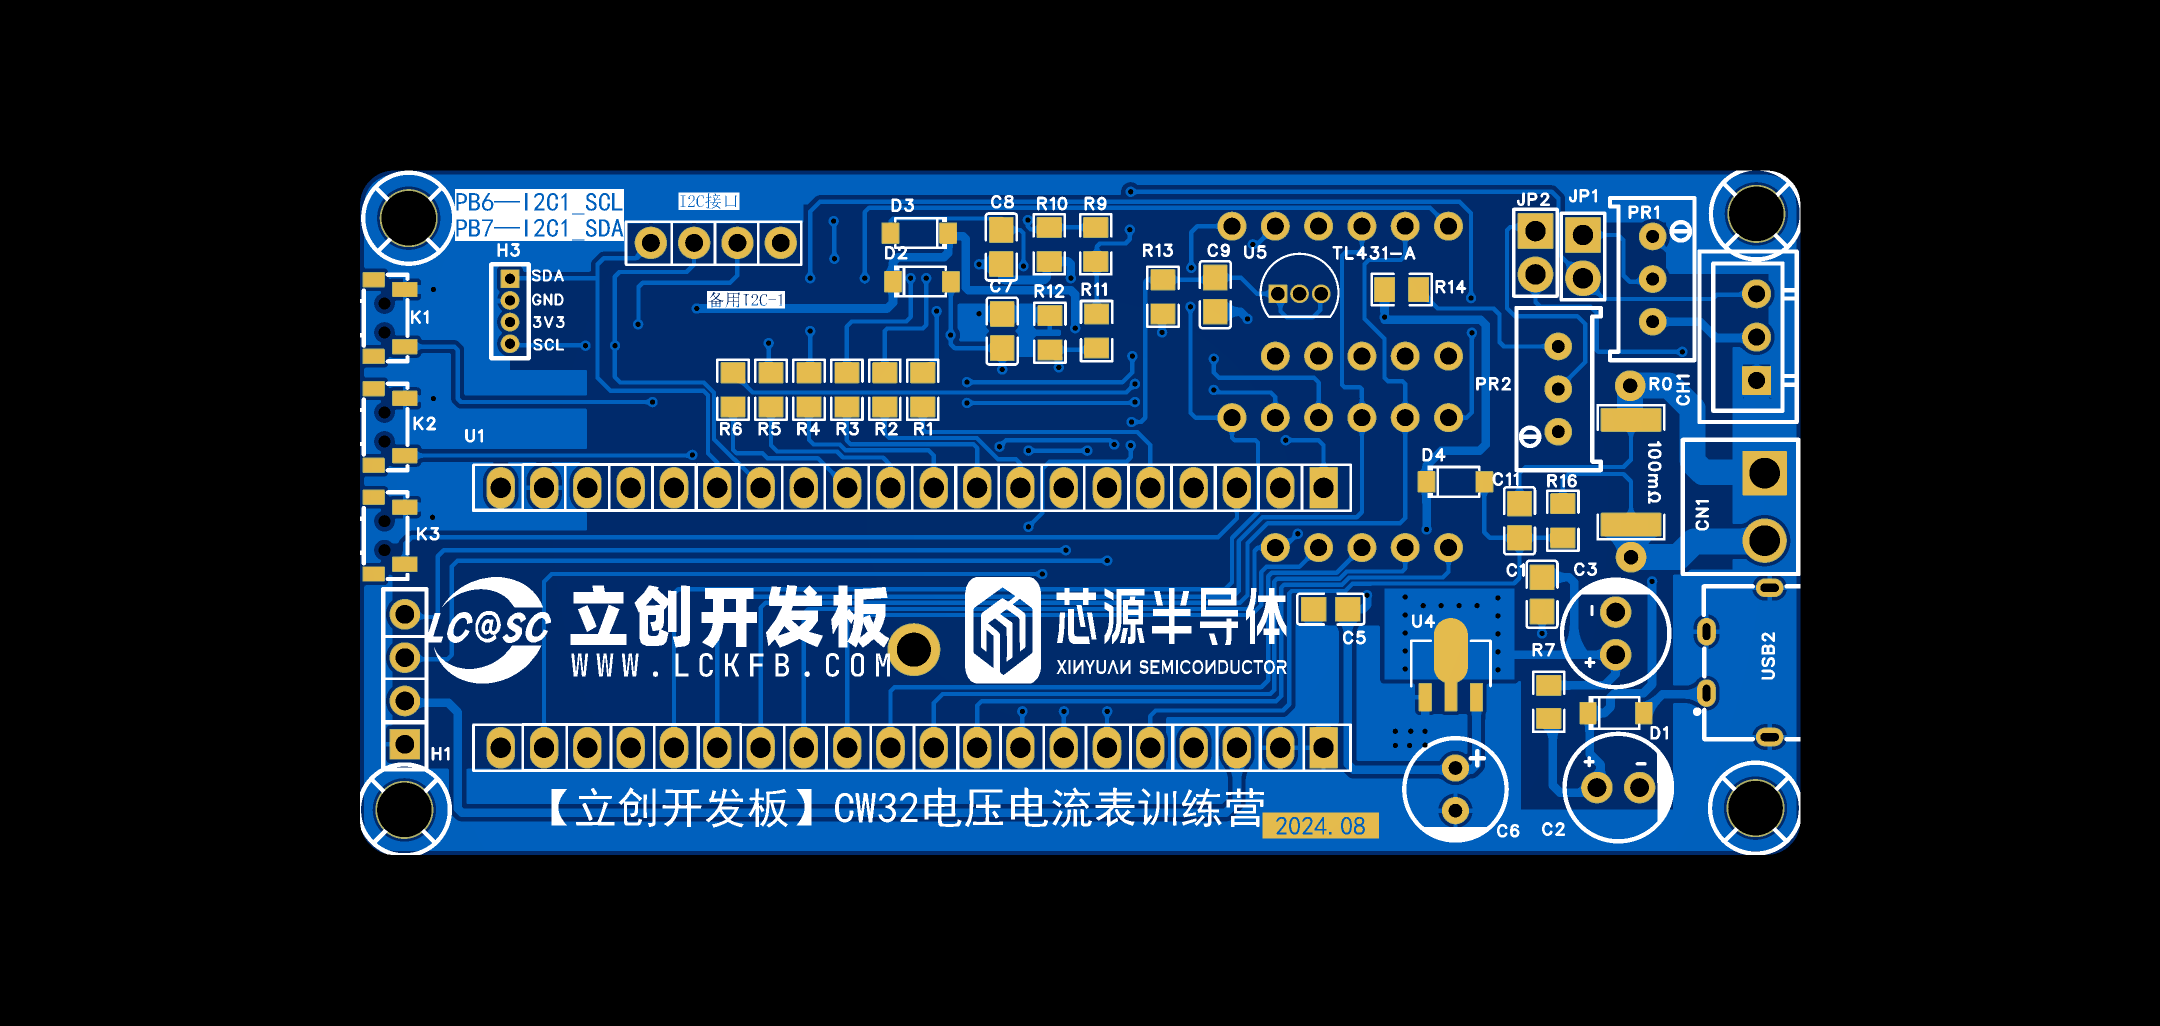
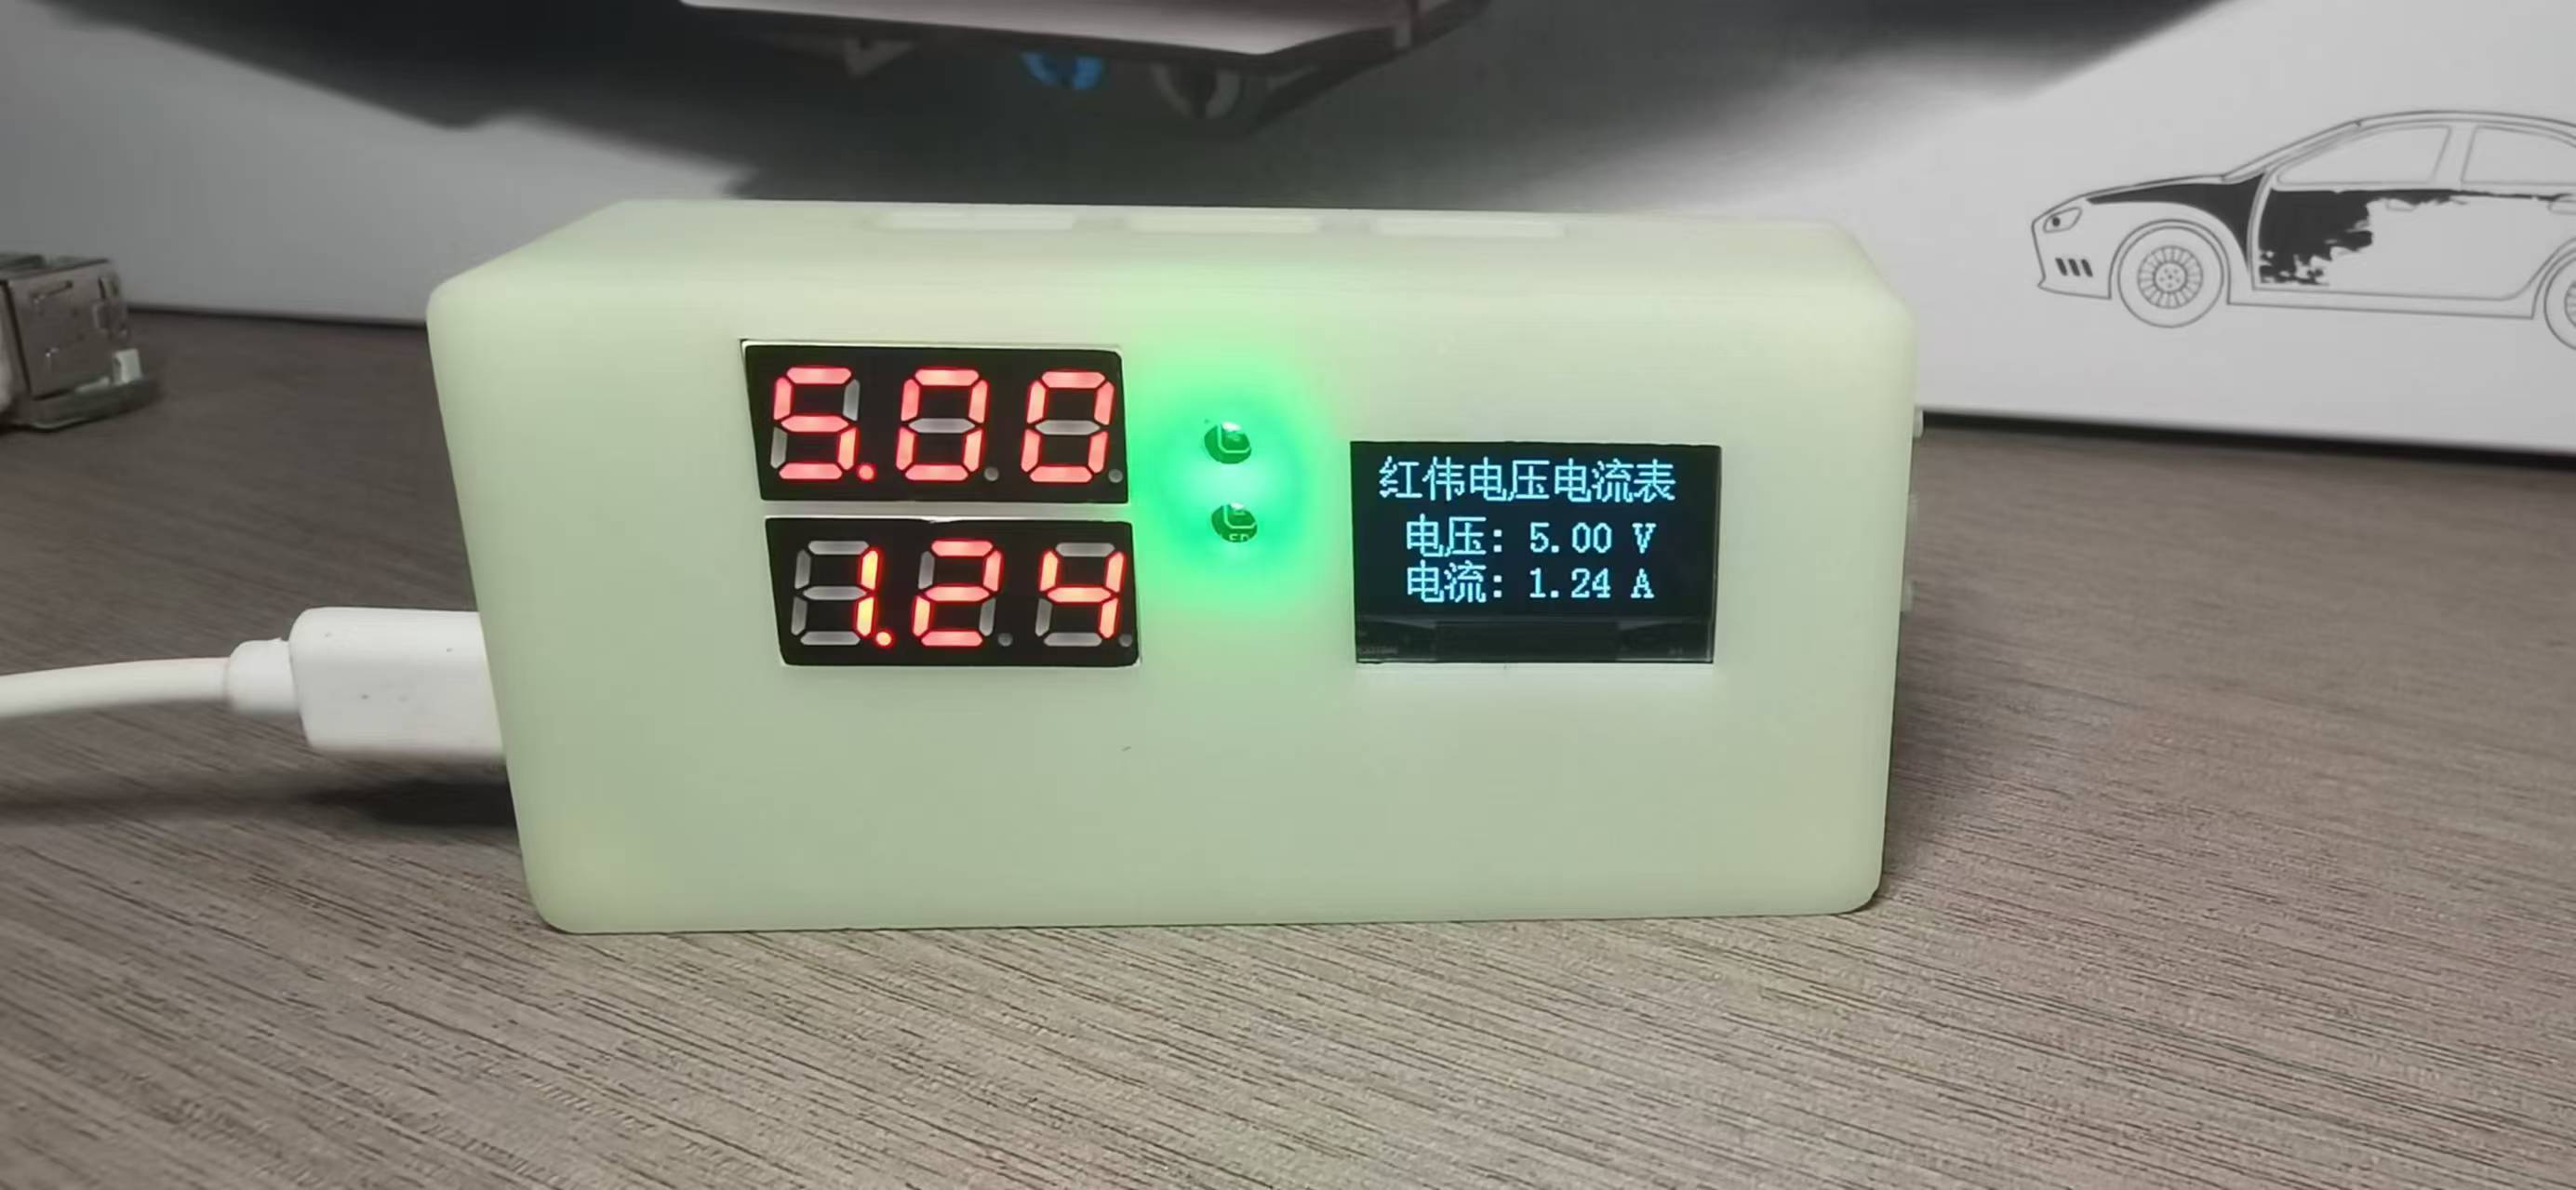
This project uses the LCSC CW32F030C8T6 development board (core board) as the main controller, capable of measuring voltage from 0-30V and current from 0-3A. The entire project was completed under the guidance of a teacher. However, to apply the project practically, I switched to surface-mount components to reduce size. I also added a 0.96-inch OLED screen for practicing related drivers.
II. Design Summary

III. Hardware Circuit Composition
1. Power Supply Circuit:

This project uses an LDO as the power supply. Considering that most voltmeter products are used in industrial scenarios with 24V or 36V power supplies, this project selected the SE8550K2, which has a maximum input voltage of 40V. The main reason for not using a DC-DC buck converter to handle large voltage differences is to avoid introducing DC-DC ripple interference during the design process; a secondary reason is to reduce project costs.
2. MCU Selection Analysis:
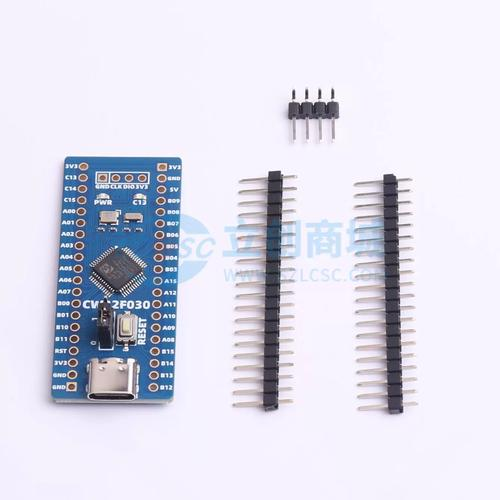
This project uses the LCSC CW32F030C8T6 development board (core board) as the main controller. From the perspective of training engineers, the correct selection of the main controller is crucial, as it relates to the overall advantages of the project.
3. Voltage Sampling Circuit:
This project uses a voltage divider circuit to achieve high voltage acquisition. The design can acquire a voltage of 100V, but the current configuration allows for a voltage range of 0-30V.

The voltage divider resistors are designed to be 220K+10K, resulting in a voltage division ratio of 22:1 (ADC_IN11).
5. Digital Tube Driver:
This project uses digital tubes as the display unit.
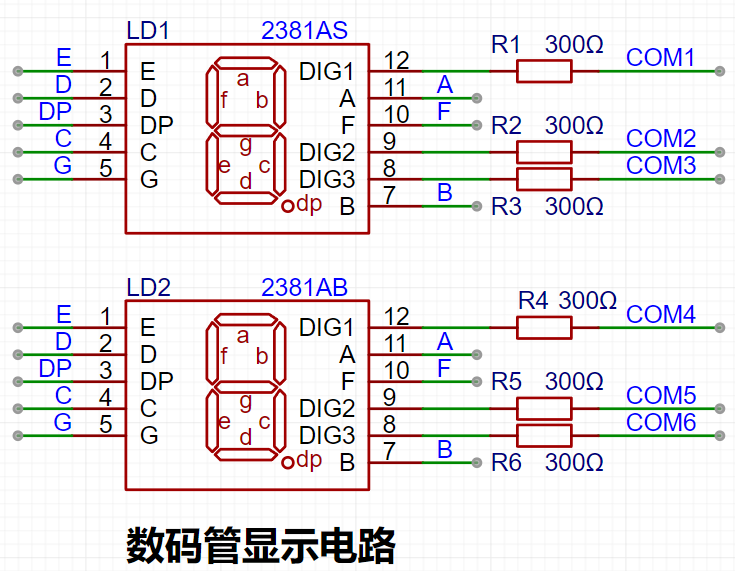
Two 0.28-inch three-digit common-cathode digital tubes are used as display devices. Compared to displays, digital tubes offer better visibility in complex environments. Depending on the actual usage environment, smaller current-limiting resistors can be used to achieve higher brightness. Furthermore, digital tubes have better mechanical properties and are not as easily damaged by external forces as displays. They are widely used in industrial and other applications requiring stable and reliable operation. From a development learning perspective, it's easier to learn electronic measurement principles and related development in a more targeted way.
In this project, after actual testing, the current-limiting resistors (R1~R6) of the digital tube were configured to 300Ω. The corresponding brightness, whether for red or blue digital tubes, had good recognition and the brightness was soft and not dazzling.
Strictly speaking, the current-limiting resistors should be added to the segments; adding them to the digits would affect the display effect. In our actual design, we added them to the digits to save a few resistors, but the impact on the display was not significant. So we added them to the digits for convenience.
6. Indicator Lights
This project additionally designed a power indicator light and an IO working indicator light.
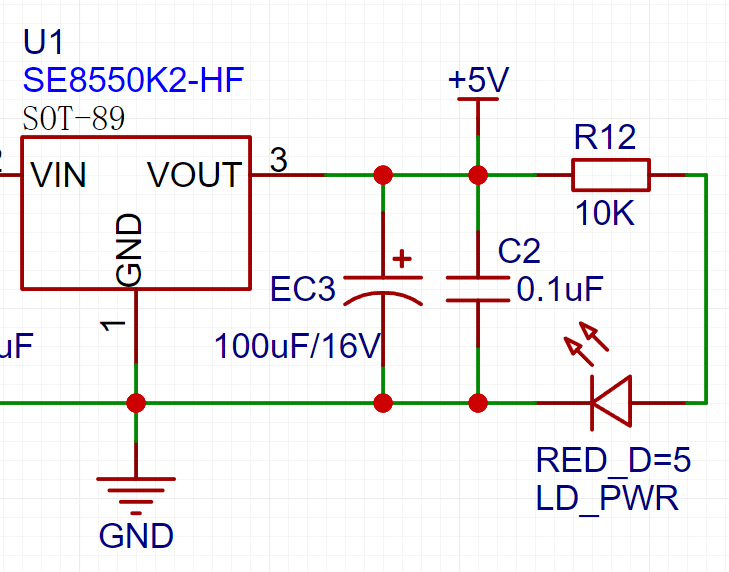
LD_PWR is the power working indicator light . For the

IO working indicator light,
since the chip I/O often has a greater current sinking capability than a current pulling capability, LED1 is designed to be active low (on). To reduce the current consumption of the LED, some LED brightness was sacrificed, the number of component parameters was reduced, and the current-limiting resistor for the LED was selected as 10K.
Taking the F5 white LED plug-in used in this project as an example, the table below shows its electrical parameters. As can be seen from the table, the current-limiting resistor must be set to ensure the current is within 20mA. (This can be calculated using Ohm's Law.)
7. Button Circuit Design:

There are various design methods for the button control circuit. Thanks to the CW32's internal I/O ports which can be configured with pull-up and pull-down resistors, the button control circuit on the chip's periphery does not require configuration. One end of the button is connected to the MCU's I/O, and the other end is grounded. When the button is pressed, the I/O is pulled low.
8. TL431 Circuit Design for Voltage Measurement and Calibration:
This project adds an additional TL431 circuit to provide a 2.5V reference voltage. This can be used to provide an external voltage reference for the chip to calibrate the AD converter. From a product design perspective, due to the CW32's inherent ADC performance advantages, this circuit is not necessary. This circuit is designed on the development board for learning related application principles.

Since I personally use the TL431 TO-92 package from Youtai Semiconductor, and its product manual is in English, I have found the Chinese manual for the TL431 product from TI to facilitate everyone's learning and understanding. The Kelvin connection method for
current sampling resistors
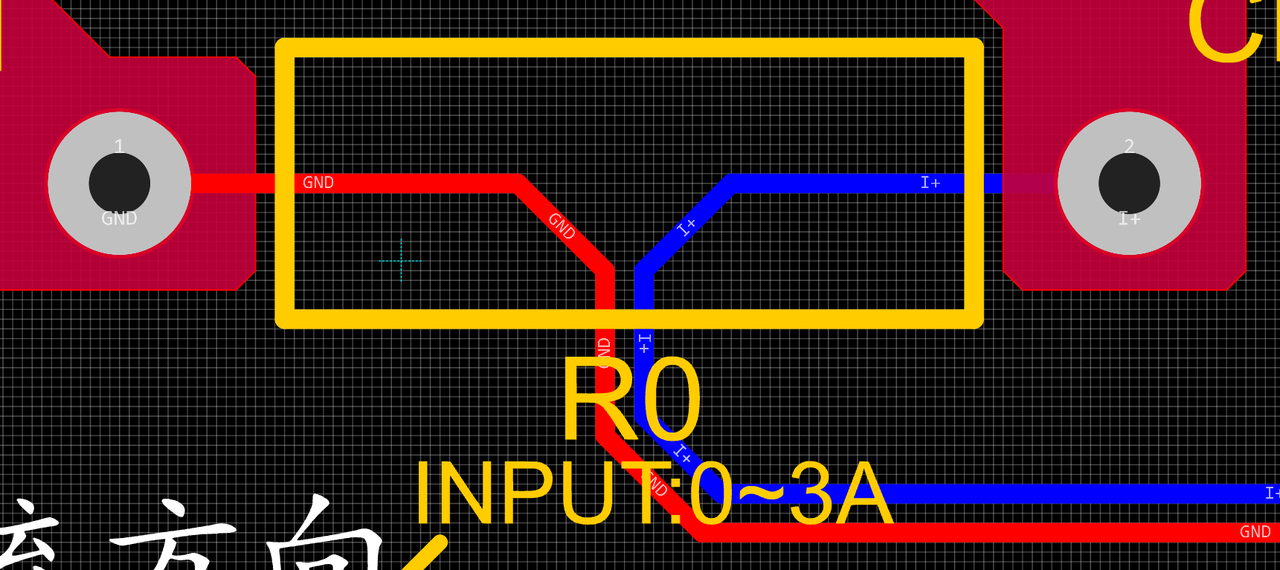
eliminates the influence of line resistance and contact resistance on the measurement results. In high-precision sampling applications, there are also dedicated four-wire sampling resistors available, which will not be discussed in this article.
Silkscreen printing and processes:
Silkscreen printing on general PCBs is sprayed on, so when the font size is small and the line width is thick, blurring may occur, leading to unclear markings. It is recommended to choose a reasonable silkscreen font size and line width, as different silkscreen fonts have different effects. Choosing a suitable font will result in better printing performance at the same line width and font size.
Considerations for DRC design:
Power supply traces should be as wide as possible, approximately between 20 and 60 mils.
Ordinary signal lines: around 10 mils.
ADC signal traces: 10 mils or 8 mils. Too wide a trace may affect signal integrity when the line is too long.
Since high-speed circuit design is not involved, the 3W principle is not emphasized here.
Standardize component pin spacing: Use imperial units, utilize EDA software's grid and grid layout effectively, and arrange component positions and traces logically.
9. Software Design:
The concept of calibration
: Calibration is the process of compensating for instrument system errors by measuring the deviation of a standard, thereby improving the accuracy and precision of the instrument or system. To improve the measurement accuracy and precision of voltmeters and ammeters, voltage and current measurements need to be calibrated.
The common calibration principle is as follows:
Assume a sampling system where the AD section can obtain digital quantities, corresponding to physical quantities such as voltage (or current).
If an AD value point Xmin is calibrated at the "zero point" and an AD value point Xmax is calibrated at the "maximum point", according to the principle that "two points form a straight line", a straight line connecting the zero point and the maximum point can be obtained. The slope k of this line is easy to find. Then, by applying the equation of the straight line to solve for each point X (AD sample value), the physical quantity (voltage value) corresponding to the AD value can be obtained:

The slope k in the figure above is:
k = (Ymax - Ymin) / (Xmax - Xmin)
(because the first point is the "zero point", Ymin = 0 above).
Therefore, the physical quantity corresponding to the AD value at any point in the figure above is:
y = k × (Xad - Xmin) + 0.
The above algorithm only performs calibration between the "zero point" and the "maximum point". If the intermediate AD sample value is used, it will bring a large error in the corresponding physical quantity. The solution is to insert more calibration points.
As shown in the figure below, four calibration points (x1, y1), (x2, y2), (x3, y3), and (x4, y4) are inserted respectively.

This will result in a "reflection line" (equivalent to segmented processing) instead of a straight line. If we want to solve for the voltage value corresponding to the point Xad between x1 and x2:
y = k×(Xad – X1) + y1.
As can be seen from the above, the more "calibration points" are inserted in the middle, the higher the "accuracy" of the physical value obtained.
When measuring voltage and current, a voltage and current calibration board or multimeter can be used to calibrate the collected voltage and current. The more calibration points, the more accurate the measurement.
The example program uses three calibration points: 0V, 5V, and 15V for voltage, and 0A, 0.5A, and 1.5A for current.
The main program code is as follows:
int main()
{
RCC_Configuration(); //System clock 64M
KEYGPIO_Init();
GPIO_WritePin(CW_GPIOC,GPIO_PIN_13,GPIO_Pin_RESET);
Seg_Init();
Btim1_Init();
ADC_init();
read_vol_cur_calibration();
ComputeK();
while(1)
{
if(BrushFlag==1)
{
DisplayBuff();
BrushFlag=0;
}
if(timecount>= 300) //Change the digital tube display value every 300ms//
{
timecount=0;
Volt_Cal();
BrushFlag=1;
} }
}
The
calibration code calculates the slope function as follows:
void ComputeK(void)
{
K=(Y15-Y05);
K=K/(X15-X05);
KI=(IY15-IY05);
KI=KI/(IX15-IX05);
}
The calibration storage function is as follows:
void save_calibration(void)
{
uint16_t da[5];
da[0]=0xaa;
da[1]=X05;
da[2]=X15;
da[3]=IX05;
da[4]=IX15;
flash_erase();
flash_write(0,da,5);
}
The timer BTIM1 handles key detection and response, and the code is as follows:
void BTIM1_IRQHandler(void)
{
static uint32_t keytime=0,keytime2=0,keytime3=0,ledcount=0;
/ USER CODE BEGIN /
if (BTIM_GetITStatus(CW_BTIM1, BTIM_IT_OV))
{
BTIM_ClearITPendingBit(CW_BTIM1, BTIM_IT_OV);
Get_ADC_Value();
ledcount++; //LED flashing
if(ledcount>=1000)
{PC13_TOG();ledcount=0;}
timecount++;
Dis_Refresh();//Scanning display of digital tube
if(GPIO_ReadPin(CW_GPIOB,GPIO_PIN_12)==GPIO_Pin_RESET)
{
keytime++;
if(keytime>=100 )
{
keytime=0; //Switch mode
Mode++;
if(Mode>=5)Mode=0;
BrushFlag=1; //Update digital tube
}
}
else keytime=0;
if(GPIO_ReadPin(CW_GPIOB,GPIO_PIN_13)==GPIO_Pin_RESET&&Mode!=0)
{
keytime2++;
if(keytime2>=100 )
{
keytime2=0; //Switch mode
if(Mode==1)
{
X05=Mean_Value_Filter(Volt_Buffer,ADC_SAMPLE_SIZE);
save_calibration();ComputeK();Volt_Cal();BrushFlag=1;Mode=0; } if ( Mode
==
2 ) { IX05=Mean_Value_Filter(Curr_Buffer,ADC_SAMPLE_SIZE); save_calibration();ComputeK();Volt_Cal();BrushFlag=1;Mode=0; }
if(Mode==4)
{
IX15=Mean_Value_Filter(Curr_Buffer,ADC_SAMPLE_SIZE);
save_calibration();ComputeK();Volt_Cal();BrushFlag=1;Mode=0;
}
}
}
else keytime2=0;
if(GPIO_ReadPin(CW_GPIOB,GPIO_PIN_13)==GPIO_Pin_RESET)
{
keytime3++;
if(keytime3>=100 )
{
keytime3=0; //Switch mode
Mode=0;
BrushFlag=1; //Update digital tube
}
}
else keytime3=0;
}
/ USER CODE END /
}
The calibration operation method of this experiment
This example uses key operation for calibration. The specific operation method is as follows:
Define 5 working modes. The K1 key is used to switch the display mode. The K2 key sets the parameter value of the corresponding mode and saves it to FLASH. The K3 key returns to mode 0.
Mode 0: Displays normal voltage and current values (the upper row of digital tubes displays the voltage value in .V or .V automatically, the lower row displays the current value in _.**A).
Mode 1: 5V voltage calibration setting. The upper row of digital tubes displays 5.05. The lower row displays the current voltage value in _.V or ._V. In this mode, the multimeter should be set to 5.00V when measuring the measured position. Pressing the K2 key will calibrate the current value to 5V.
Mode 2: 15V voltage calibration setting. The upper row of digital tubes displays 5.15. The lower row displays the current voltage value in _.V or ._V. In this mode, the multimeter should be set to 15.0V when measuring the measured position. Pressing the K2 key will calibrate the current value to 15V.
Mode 3: 0.5A current calibration setting. The upper row of digital tubes displays A.0.5. The lower row displays the current current value in _.**A. Pressing the K2 key sets the current value to 0.5A.
Mode 4: Current calibration value setting of 1.5A. The upper row of the digital tube displays A.1.5. The lower row displays the current value *.**A. Pressing the K2 key sets the current value to 1.5A.
The OLED driver is ported from the official STM32 driver.
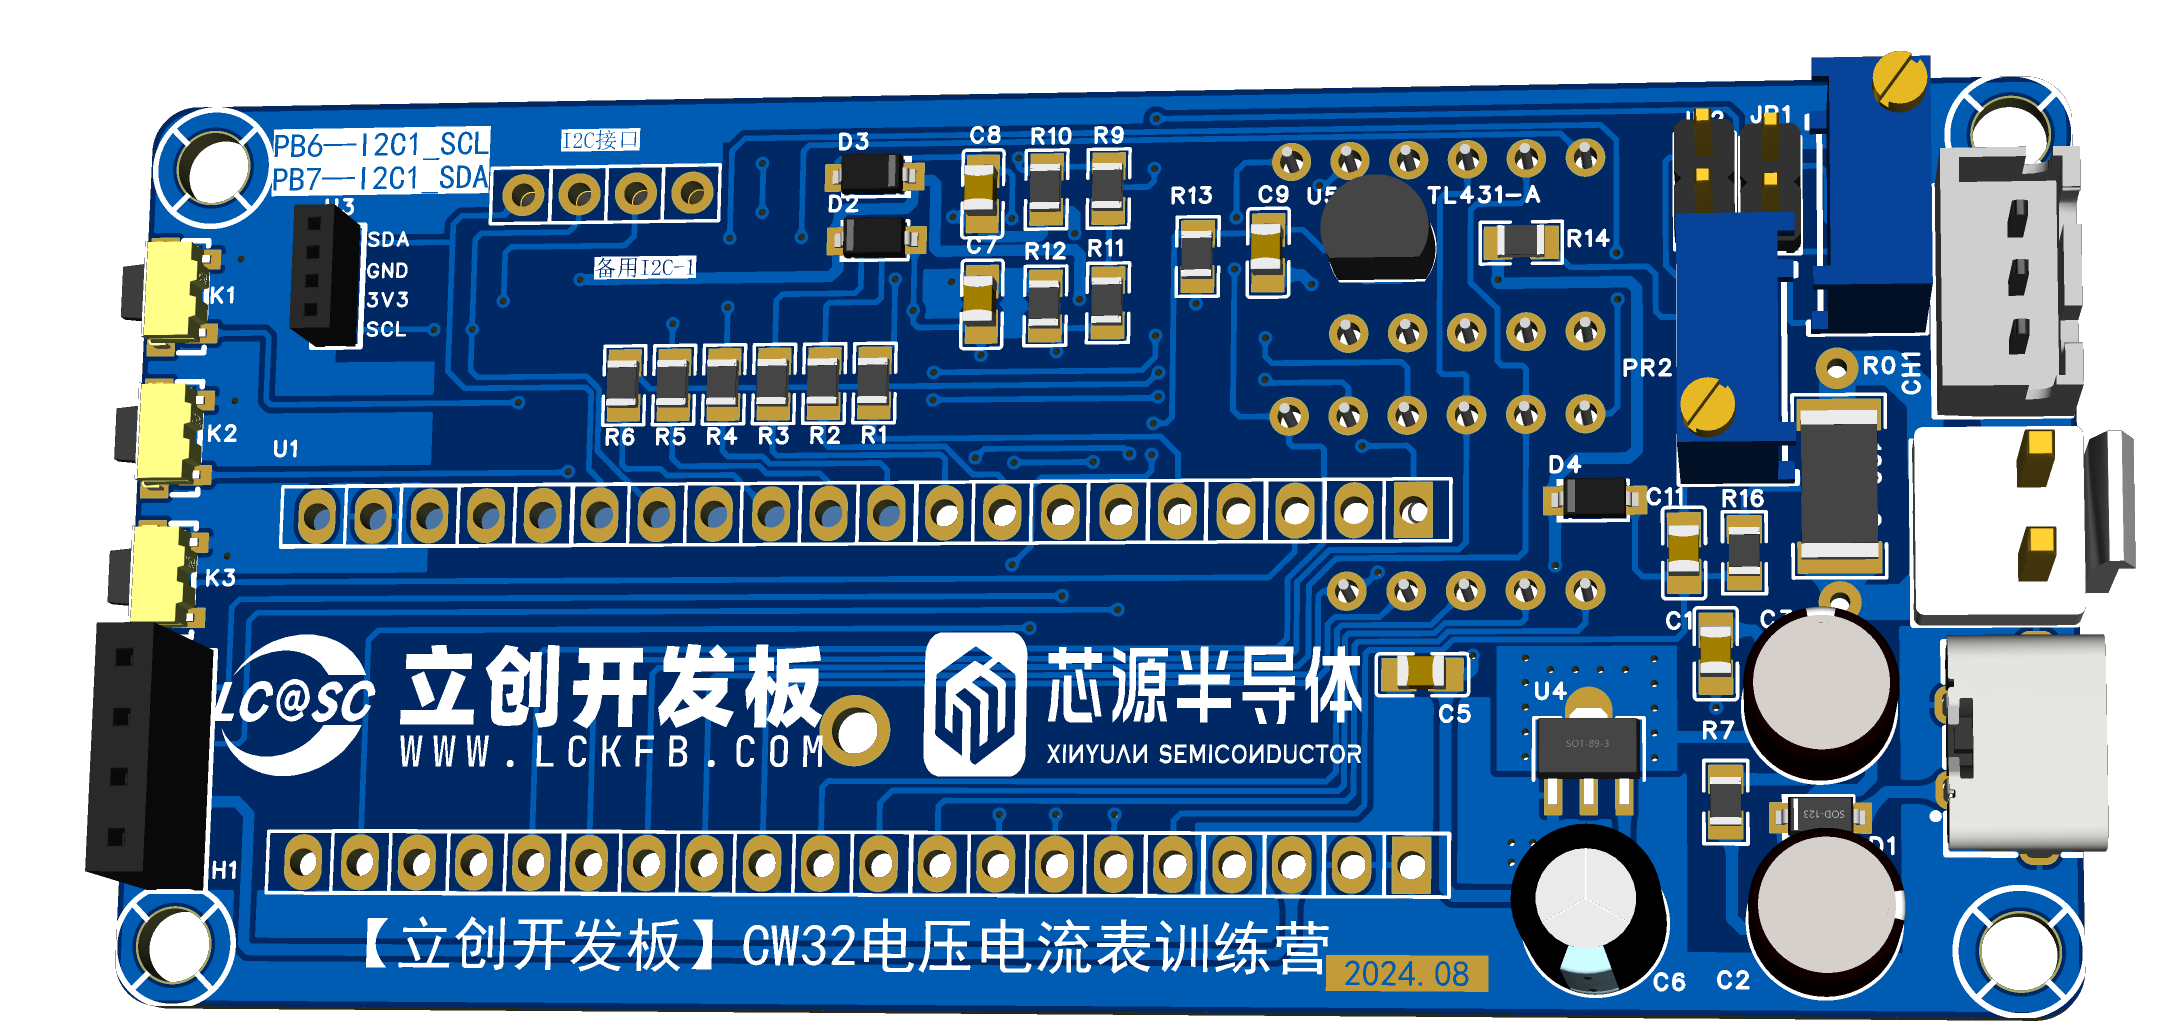
IV. Physical Display
Tips: Physical images of the product are provided, and descriptions can be added to the images.

V. Demonstration Video
Instructions: You can upload the demonstration video as an attachment. The maximum attachment size is 50MB. Files larger than 50MB can be hosted on other cloud storage services or video websites. Simply include the link here
to share the file via Baidu Cloud: 491292eb35e36b6b1565d40b016a3314.mp4
Link: https://pan.baidu.com/s/1g8N8Ge65_mZaopK0wWEnvw?pwd=u4kf
Extraction code: u4kf
[LCSC 2024 Training Camp—Voltage and Ammeter - Bilibili] https://b23.tv/zAOqoew
VI. Attachment Content
Instructions: Entries must upload all project-related program attachments to an open-source platform or personal code storage cloud. Attachments are limited to a maximum size of 50MB (please do not upload to the LCSC workspace, as there are restrictions). Attachments should be named as follows:
Attachment 1:
Attachment 2: XXXX
File shared via Baidu Cloud: CW32 Voltage and Current Meter
Link: https://pan.baidu.com/s/1AYnp2DNXCV2-ZYN46ntgkA?pwd=l0dq
Extraction Code: l0dq


 京公网安备 11010802033920号

 Am27C1024-90DC5B