Design Background:
An ADC (Analog-to-Digital Converter) is an indispensable key component in electronic systems. It converts continuous analog signals into digital signals, enabling digital processing and analysis. ADCs play a crucial role in signal conversion, measurement and data acquisition, control system input, and communication and signal processing. Their widespread application promotes the intelligent and precise control of electronic equipment across various industries, and is one of the key factors driving modern technological progress.
Digital voltmeters and ammeters combine ADC technology with circuit measurement principles, accurately converting analog voltage and current signals into digital displays for easy reading and analysis by electronic engineers. This device not only improves the accuracy and efficiency of circuit measurements but also helps engineers better understand circuit behavior, serving as a powerful tool for electronic design and troubleshooting, and playing a vital supporting role in the work of electronic engineers. In product applications, digital voltmeters ensure the accuracy and safety of circuit design, while also providing strong support for product quality control and subsequent maintenance.
This project is the final result of participating in the LCSC & CW32 voltmeter and ammeter training camp. This
project's functional
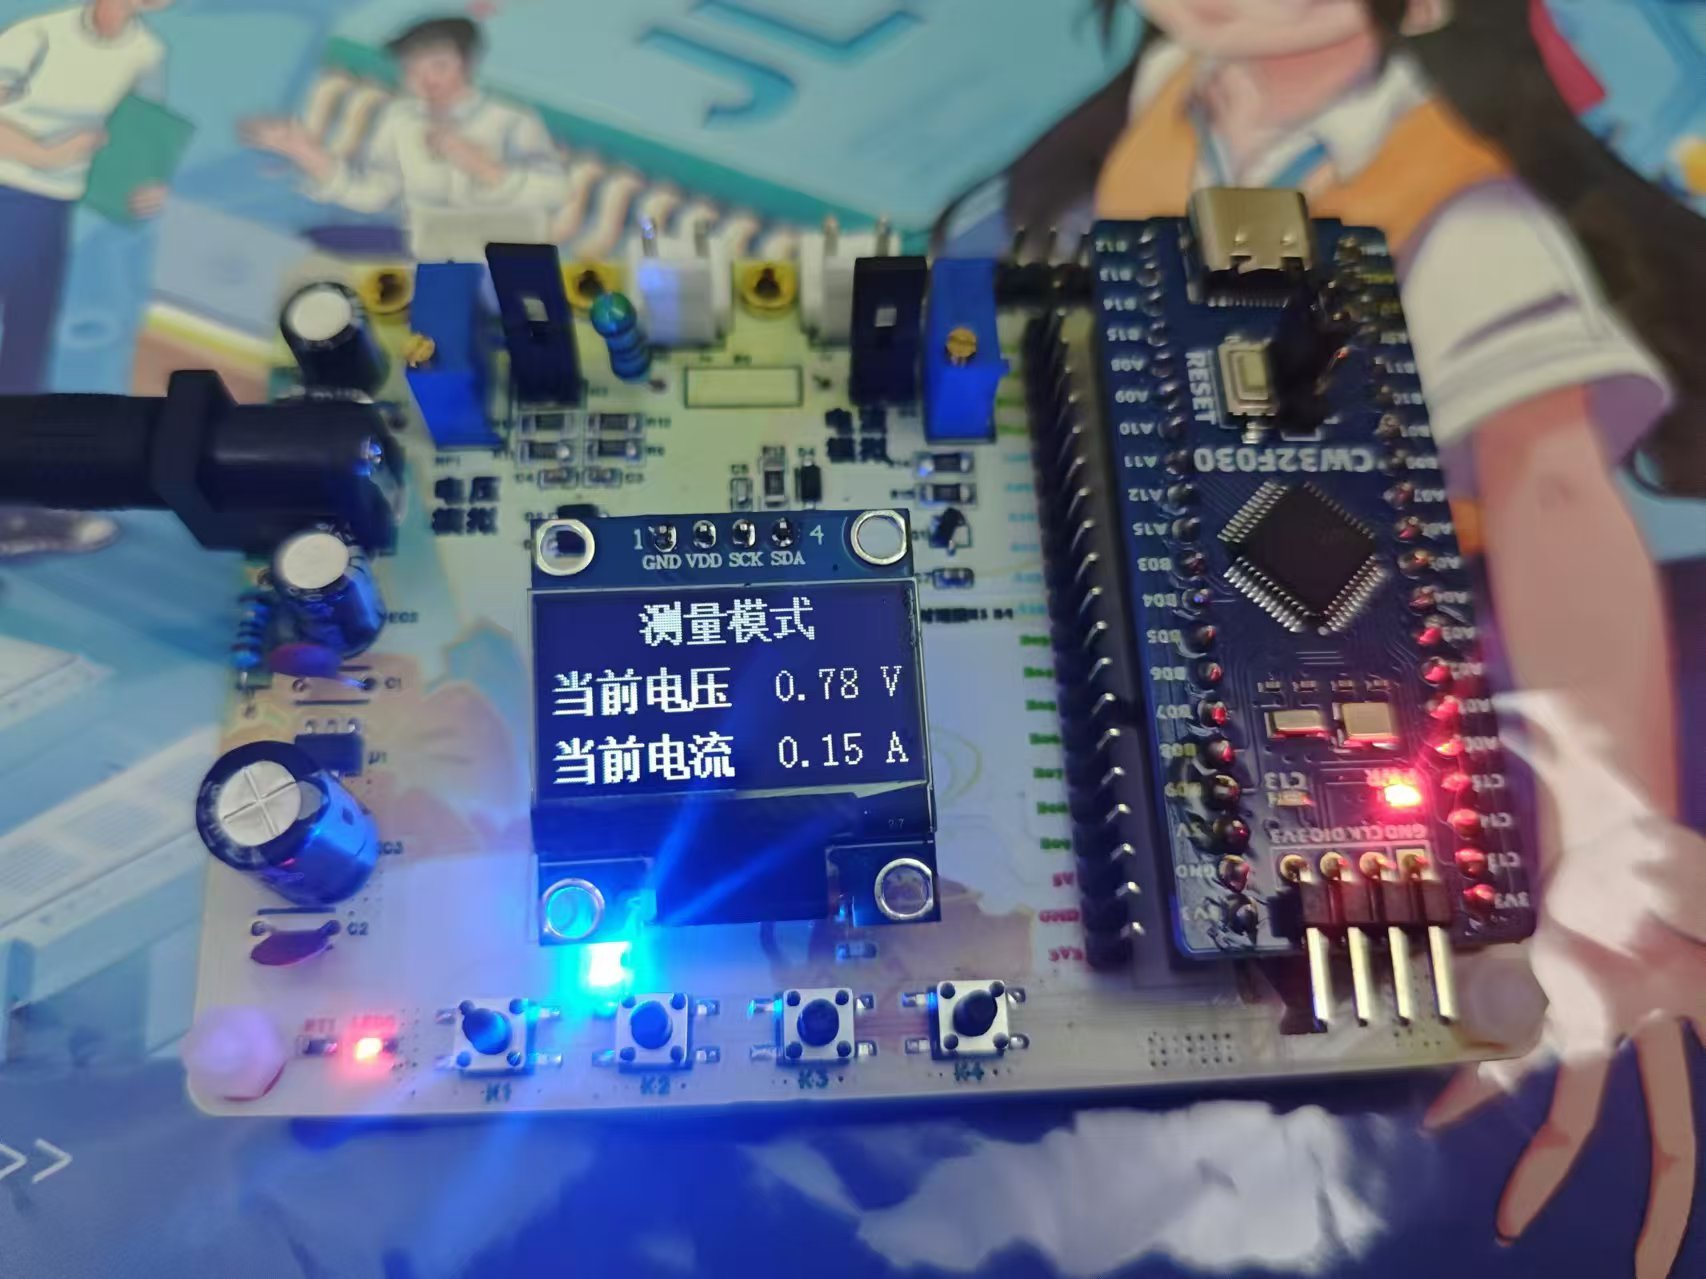
design is based on the LCSC CW32F030C8T6 development board, featuring a digital voltage and current meter. It has four independent buttons with functions for: switching modes, calibration, returning to the main interface (measurement mode), and resetting. It can perform wide-range voltage measurement (0-34.5V) and current measurement (0-3A), with an accuracy of two decimal places. Multi-stage calibration improves measurement accuracy. Two LEDs use different flashing patterns to distinguish the working status and indicate calibration completion. A 0.96-inch OLED screen displays the voltage and current measurement results in real time.
Project Parameters:
This design uses the SE8550K2 LDO chip with a maximum input voltage of up to 40V as the power supply chip. This considers both the high supply voltage and avoids the ripple interference introduced by the DC-DC converter, while also reducing costs.
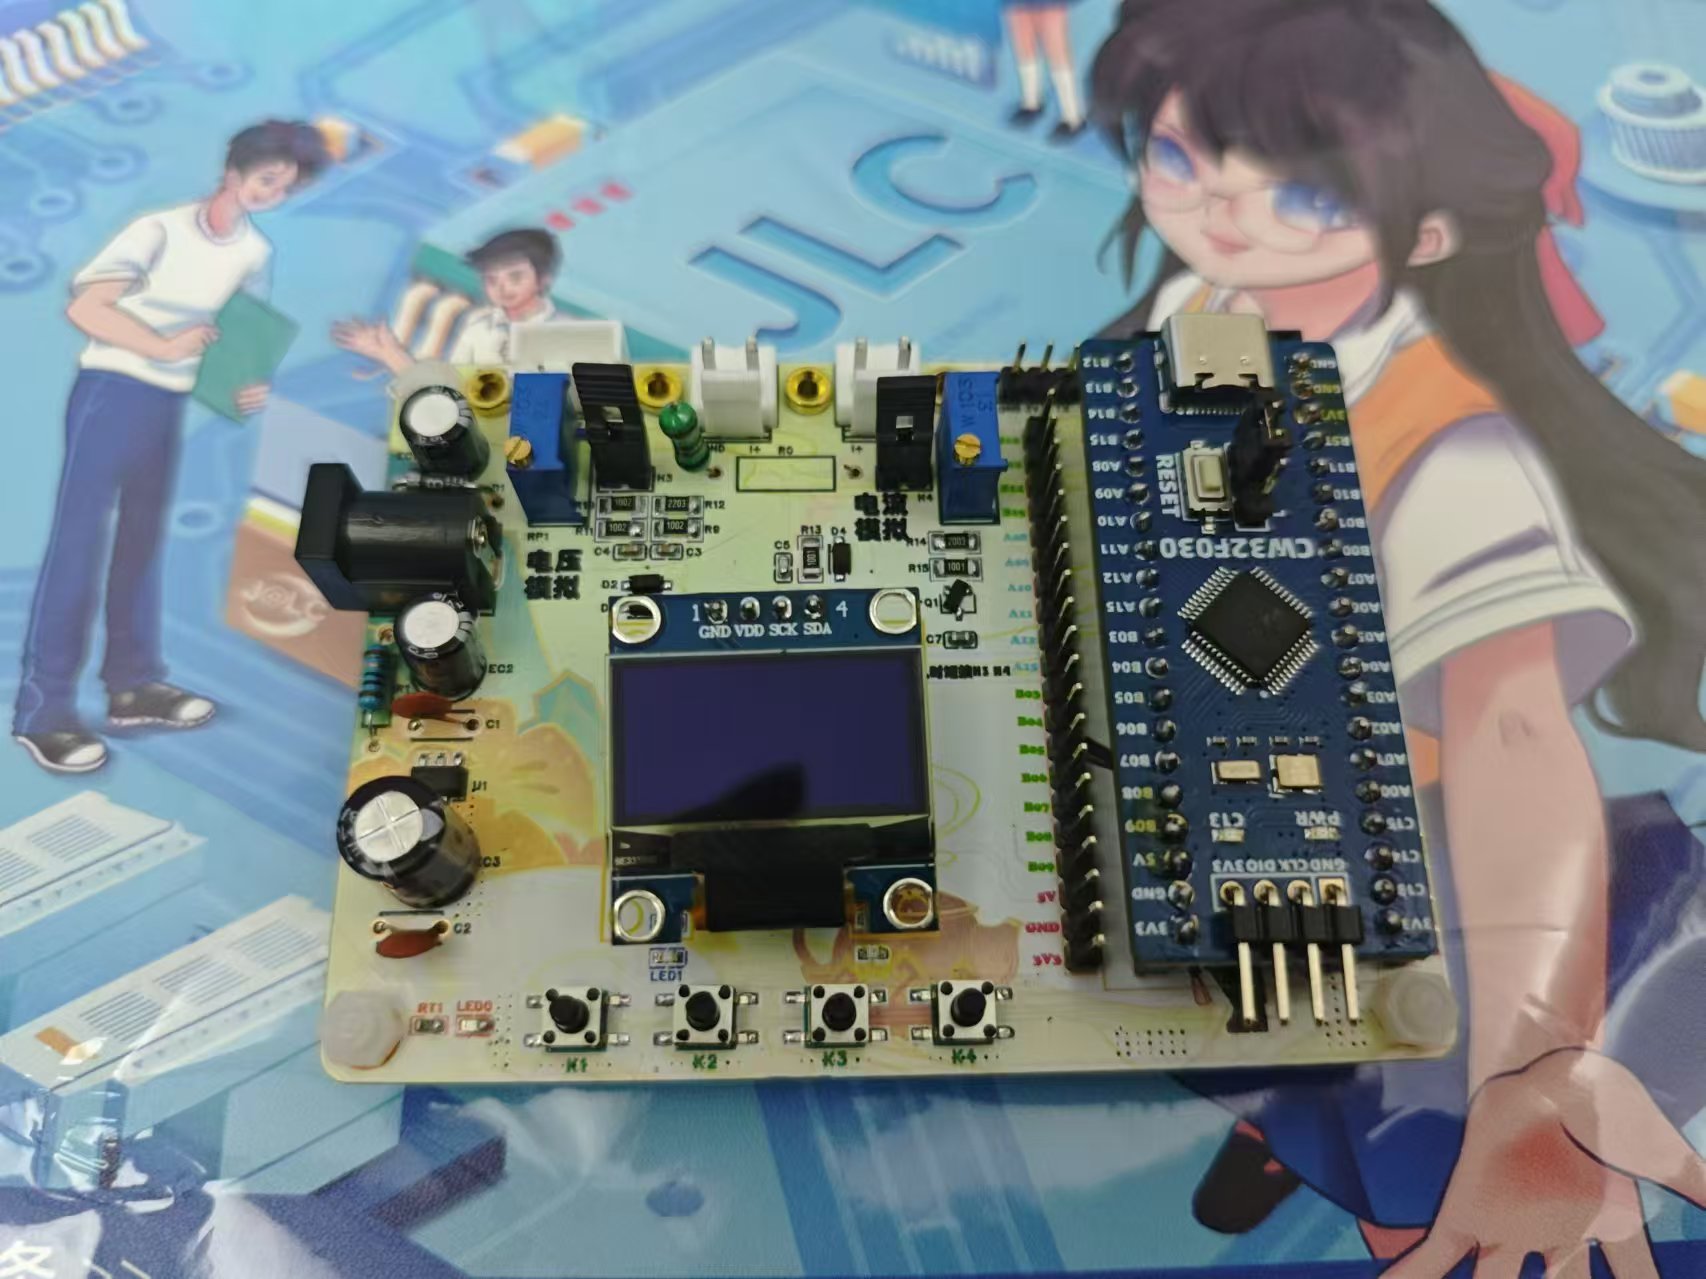
The LCSC CW32F030C8T6 development board is selected as the control board, which features a wide operating voltage range, strong anti-interference capabilities, and a better ADC—a 12-bit high-speed ADC—along with multiple Vref reference voltages.
This design uses a 0.96-inch OLED display module, showing the current mode at the top and the current voltage and current measurement results or calibration target below.
When the mode is switched or the calibration is completed, a corresponding LED lights up or flashes to remind the user.
A voltage and current analog test circuit is designed for easy learning and debugging.
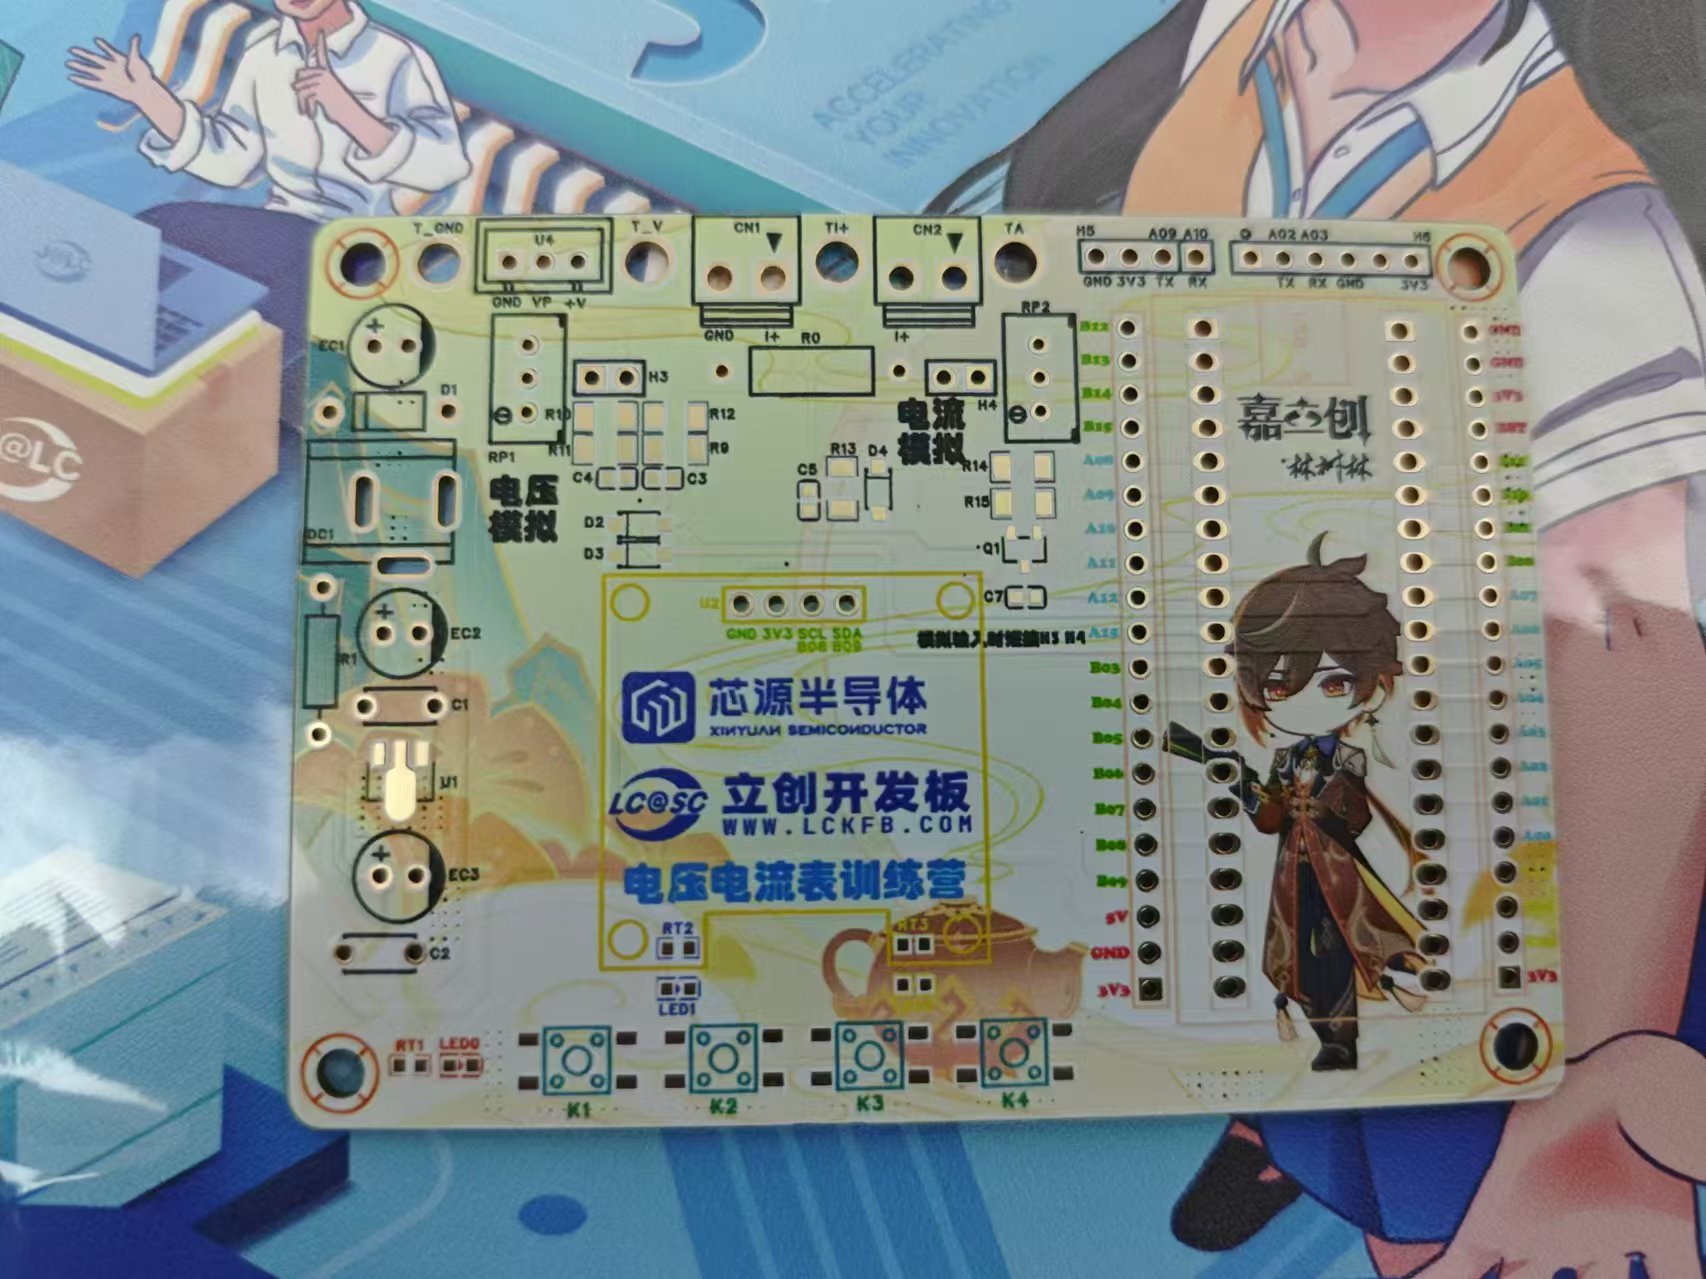
Hardware Design:
1. Power Supply Circuit

: The DC-005 interface is used as the power input port. The SE8550K2 LDO (low dropout linear regulator) with a maximum input voltage of up to 40V is selected as the power supply, capable of stably outputting 5V voltage.
2. Voltage Sampling Circuit:
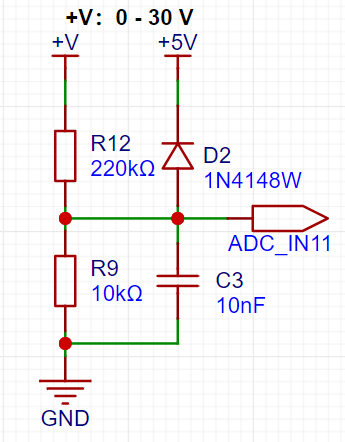
The voltage divider resistors in this project are designed to be 220K+10K, therefore the voltage division ratio is 22:1 (ADC_IN11). With an ADC reference voltage of 1.5V, the maximum measurable voltage is 34.5V (1.5V * 23).
3. Current Sampling Circuit:
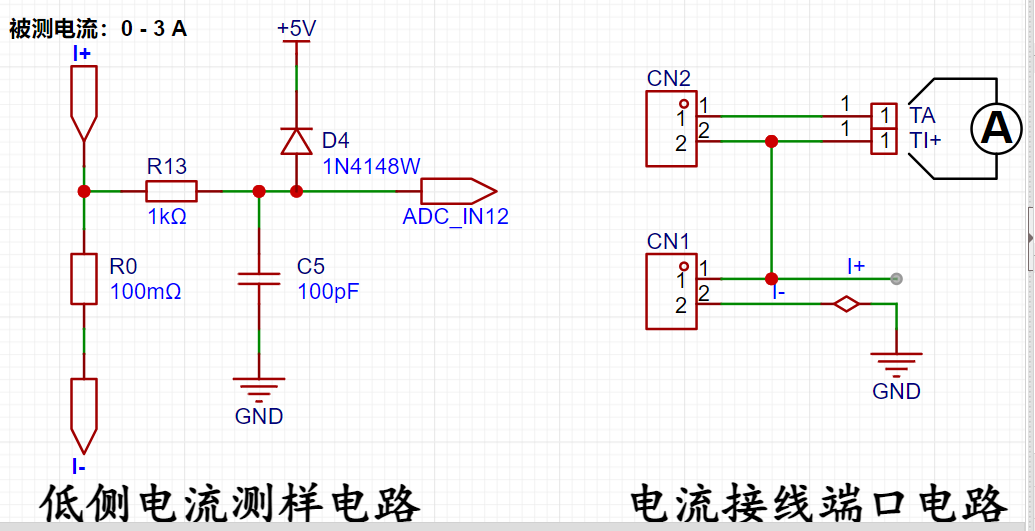
This project uses a low-side current sampling circuit for current detection. The low-side of the sampling circuit shares a common ground with the development board's meter interface. The sampling resistor (R0) in the circuit is 100mΩ, and the maximum sampling current is 3A. By measuring the voltage across the sampling resistor (ADC_IN12), the corresponding current is calculated. When the current through the sampling resistor is 10mA, the voltage across the resistor is measured as 1mV.
4. Voltage and Current Simulation:
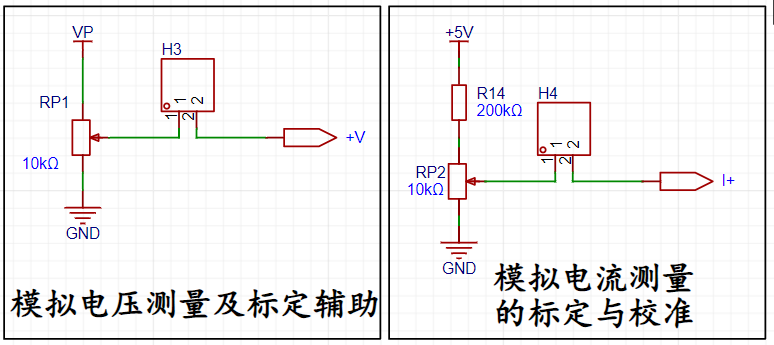
The official example code for this project includes analog measurement and calibration circuits for voltage and current. Since no adjustable power supply is available in this project, all learning, testing, and calibration are performed on analog circuits. Voltage and current measurements are both achieved by collecting the corresponding voltage values and calculating the results using a circuit. Therefore, in the analog circuit, a potentiometer is used to simulate the measurement.
Software Design
1. Buttons:
This project uses a state machine button scanning method. A timer periodically checks the status of the corresponding I/O port of each button. Because there is a time interval between each detection, the influence of button bounce is avoided, achieving debouncing functionality. When the program detects a button press, it enters the next working state "PRESSED_READY". After
one time period (10~20ms), it checks again. If a button press is confirmed, the situation is assessed and relevant functions are executed. If no button press is detected, it indicates a bounce, a false detection, and the program returns to the "IDLE" state. Simultaneously, the use of structures enables independent button detection, making the code more concise.
Button Functions:
K1: Switch Mode:
Mode 0: Voltage and Current Measurement Simultaneously ; Mode
1:
Voltage 5V Calibration; Mode 2: Voltage 10V Calibration;
Mode 3: Current 0.5A (corresponding to 0.05V voltage divider on the analog circuit);
Mode 4: Current 1.5A (corresponding to 0.15V voltage divider on the analog circuit).
K2: Execute the calibration process in calibration mode. After completing the current calibration, the green LED changes from flashing to solid light as a reminder.
K3: Return to Mode 0 (Measurement Mode).
K4: Reset Calibration Data.
`void k1_function(void);
void
k2_function(void); void k3_function(void);
void k4_function(void);
// Define a function type
typedef void (*Function)(void);
typedef struct
{
GPIO_TypeDef *port; // GPIO port corresponding to the button
uint16_t pin; // Pin corresponding to the button
unsigned char mode; // Button state
Function keyFunction; // Function pointer corresponding to the short press function
} key_GPIO;` //Key corresponding IO port information
key_GPIO key[4] = { {GPIO_K1,PIN_K1,0,k1_function},
{GPIO_K2,PIN_K2,0,k2_function},
{GPIO_K3,PIN_K3,0,k3_function},
{GPIO_K4,PIN_K4,0,k4_function}};
volatile unsigned char key_flag = 0;
/**
* @brief key scan function
* @param void
* @return void
*/
void key_scan(void)
{
if(key_flag == 1)
{
key_flag = 0;
unsigned char i = 0;
for(i = 0;i<4;i++)
{
switch(key[i].mode)
{
case 0:
if(GPIO_ReadPin(key[i].port,key[i].pin) == GPIO_Pin_RESET)key[i].mode = 1;
break;
case 1:
if(GPIO_ReadPin(key[i].port,key[i].pin) == GPIO_Pin_RESET)
{
key[i].mode = 2;
key[i].keyFunction();
}
else key[i].mode = 0;
break;
case 2:
if(GPIO_ReadPin(key[i].port,key[i].pin) == GPIO_Pin_SET)key[i].mode = 0;
break;
} }
}
}
2.
Filtering
Mean filtering, also known as linear filtering, mainly uses the neighborhood averaging method. The basic principle of linear filtering is to replace the pixel values in the original image with the mean. That is, for the current pixel (x, y) to be processed, a template is selected, which is composed of several of its nearest neighbor pixels. The mean of all pixels in the template is calculated, and then this mean is assigned to the current pixel (x, y) as the gray level g(x, y) of the processed image at that point, i.e., g(x, y) = ∑f(x, y)/m, where m is the total number of pixels in the template, including the current pixel.
This is originally a method of digital image processing, but it can also be used for ADC sampling data of digital voltage and current meters. Twenty ADC sampling values are selected and stored in an array. Then, the maximum and minimum values in the array are removed, and the average is taken. The resulting value is displayed as the result. This can obtain more accurate and less volatile data.
void Get_ADC_Value(void)
{
static uint8_t adc_count = 0; // Define static local variable
ADC_GetSqr0Result(&Voltage_Buffer_High[adc_count]); // Get the raw sampled value of the ADC
ADC_GetSqr1Result(&Current_Buffer_Num[adc_count]); // Get the raw sampled value of the ADC
adc_count++;
if(adc_count >= ADC_SAMPLE_SIZE) // After sampling 20 times, start from 0 again
{
adc_count = 0;
}
}
uint32_t Mean_Value_Filter(uint16_t *value, uint32_t size) // Mean filter
{
uint32_t sum = 0;
uint16_t max = 0;
uint16_t min = 0xffff;
int i;
for(i = 0; i < size; i++) // Traverse the array to find the maximum and minimum values
{
sum += value[i];
if(value[i] > max)
{
max = value[i];
}
if(value[i] < min)
{
min = value[i];
}
}
sum -= max + min; // Subtract the maximum and minimum values and then calculate the average
sum = sum / (size - 2);
return sum;
}
3. Calibration
Calibration is the process of compensating for instrument system errors by measuring the deviation of a standard, thereby improving the accuracy and precision of the instrument or system. To improve the measurement accuracy and precision of voltmeters and ammeters, calibration is necessary.
The common calibration principle is as follows:
Assume a sampling system where the AD section can obtain digital quantities, corresponding to physical quantities such as voltage (or current).
If an AD value point Xmin is calibrated at the "zero point" and an AD value point Xmax is calibrated at the "maximum point", according to the principle that "two points form a straight line", a straight line connecting the zero point and the maximum point can be obtained. The slope k of this line is easy to find. Then, by applying the equation of the straight line to solve for each point X (AD sample value), the physical quantity (voltage value) corresponding to the AD value can be obtained:
The slope k in the figure above is:

k = (Ymax - Ymin) / (Xmax - Xmin)
(because the first point is the "zero point", Ymin = 0 above).
Therefore, the physical quantity corresponding to the AD value at any point in the figure above is:
y = k × (Xad - Xmin) + 0.
The above algorithm only performs calibration between the "zero point" and the "maximum point". If the intermediate AD sample value is used, it will bring a large error in the corresponding physical quantity. The solution is to insert more calibration points.
As shown in the diagram below, four calibration points (x1, y1), (x2, y2), (x3, y3), and (x4, y4) are inserted.

This results in a line that is no longer a straight line, but rather a "reflected line" (equivalent to segmented processing). To calculate the voltage value corresponding to a point Xad between x1 and x2:
y = k × (Xad – X1) + y1.
It can be seen that the more calibration points inserted, the higher the accuracy of the physical value.
When measuring voltage and current, a voltage and current calibration board or a multimeter can be used to calibrate the collected voltage and current. The more calibration points, the more accurate the measurement.
//5V and 10V calibration
unsigned int X05=0;
unsigned int X10=0;
unsigned int Y10=10;
unsigned int Y05=5;
float K; //Slope//0.5A
and 1.5A calibration
unsigned int IX05=0;
unsigned int IX15=0;
unsigned int IY15=150;
unsigned int IY05=50;
float KI; //Slope
/******************************************************************
* Function Name: ComputeK
* Function Description: Calculates the slope
* Function Parameters: None
* Function Return: None
* Author:
* Remarks: None
******************************************************************/
void ComputeK(void)
{
K=(Y10-Y05);
K=K/(X10-X05);
KI=(IY15-IY05);
KI=KI/(IX15-IX05);
}
void data_refresh(void)
{
float t,KT1;
if(data_refresh_flag == 1)
{
data_refresh_flag = 0;
Voltage_Buffer = Mean_Value_Filter(Voltage_Buffer_High,ADC_SAMPLE_SIZE);
Current_Buffer = Mean_Value_Filter(Current_Buffer_Num,ADC_SAMPLE_SIZE);
if(Voltage_Buffer>=X05)
{
t=Voltage_Buffer-X05;
Voltage_Buffer=(K*t+Y05)*1000;}
else
{
KT1=5000;
KT1=KT1/X05;
Voltage_Buffer=KT1*Voltage_Buffer;
}
// Round
if(Voltage_Buffer % 10 >= 5)
{
Voltage_Buffer = Voltage_Buffer / 10 + 1; //10mV unit
}
else
{
Voltage_Buffer = Voltage_Buffer / 10;
}
if(Current_Buffer>=IX05)
{
t=Current_Buffer-IX05;
Current_Buffer=(KI*t+IY05)*10;
}
else
{
KT1=500;
KT1=KT1/IX05;
Current_Buffer=KT1*Current_Buffer;
}
if(Current_Buffer % 10 >= 5)
{
Current_Buffer = Current_Buffer / 10 + 1;
}
else
{
Current_Buffer = Current_Buffer / 10;
}
oled_disp(Voltage_Buffer,Current_Buffer);
/*
R = 100mr
10ma = mv/R/10=mv/0.1/10 = mv
*/
}
}
Physical diagram
of voltage and current measurement demonstration.
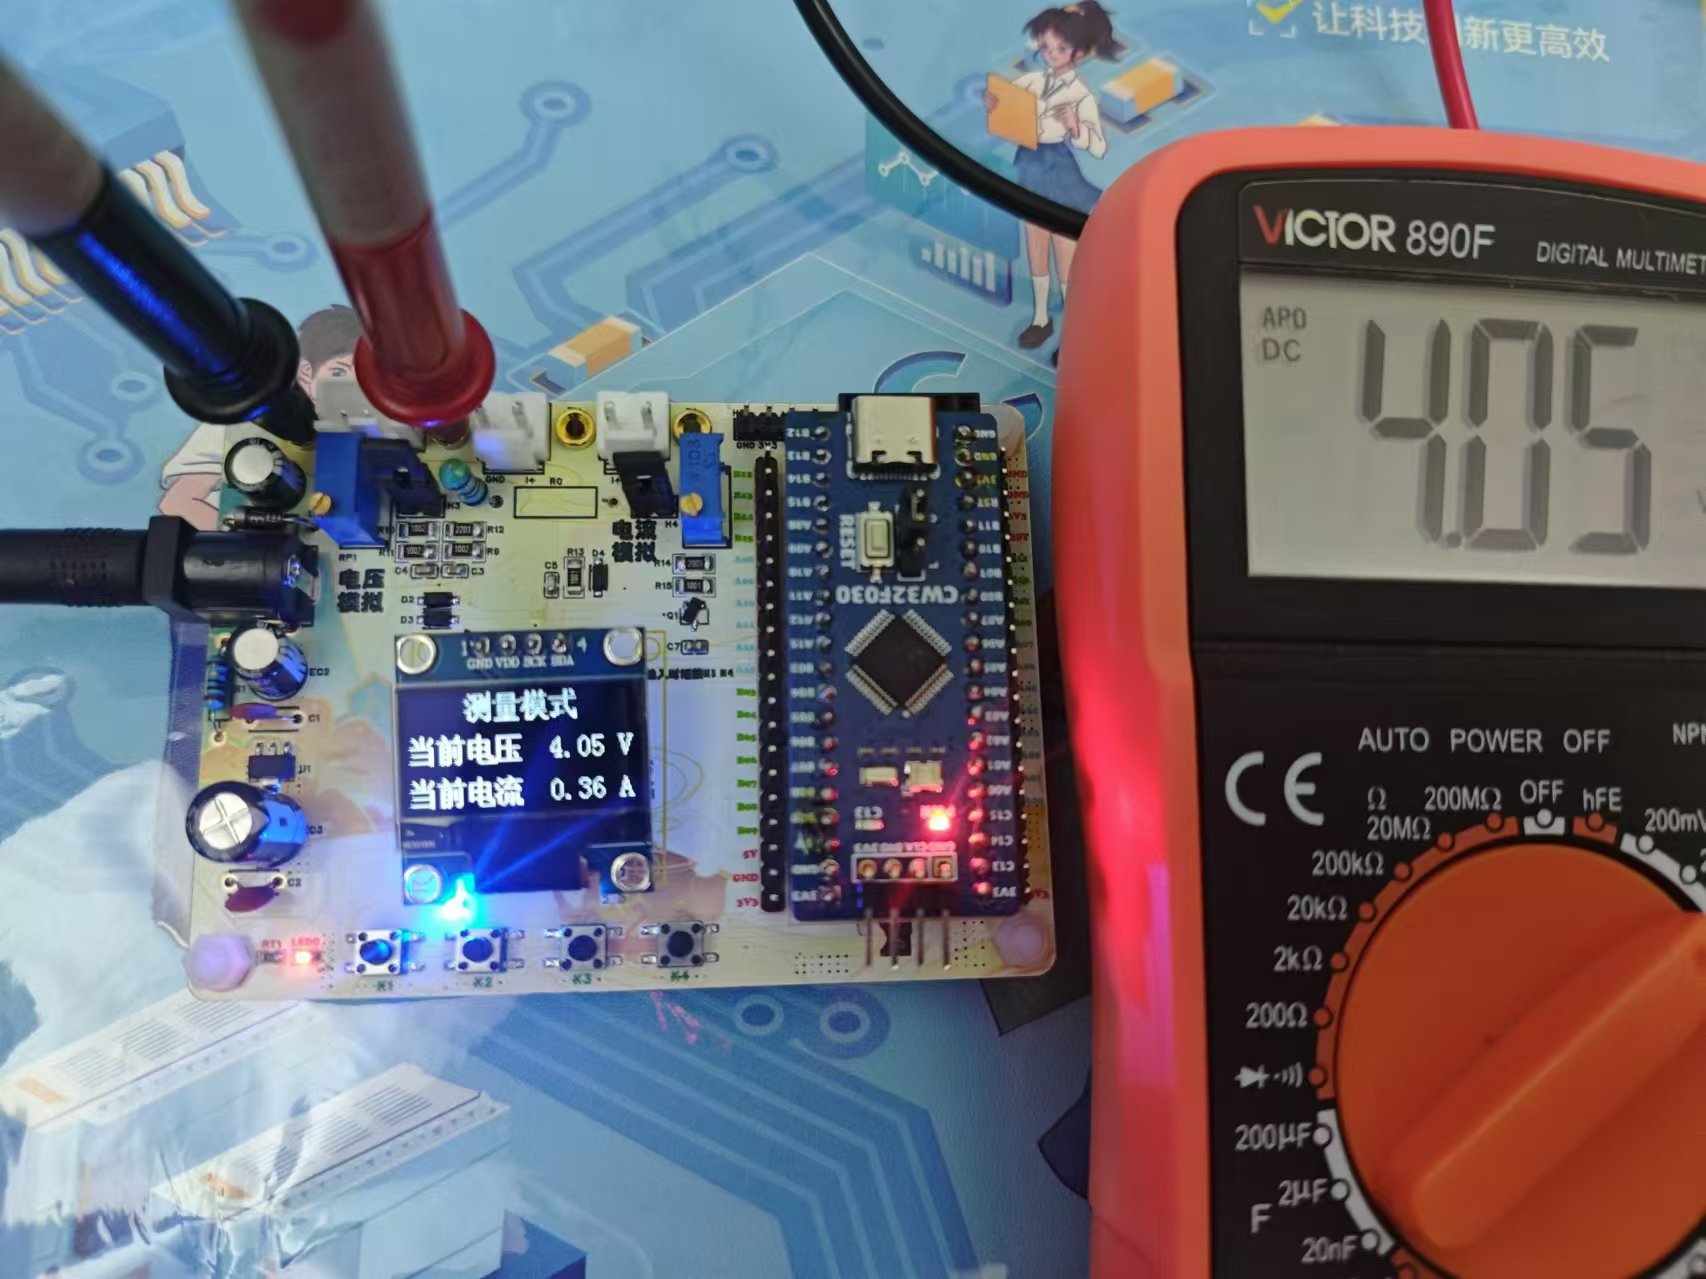
Voltage simulation measurement.
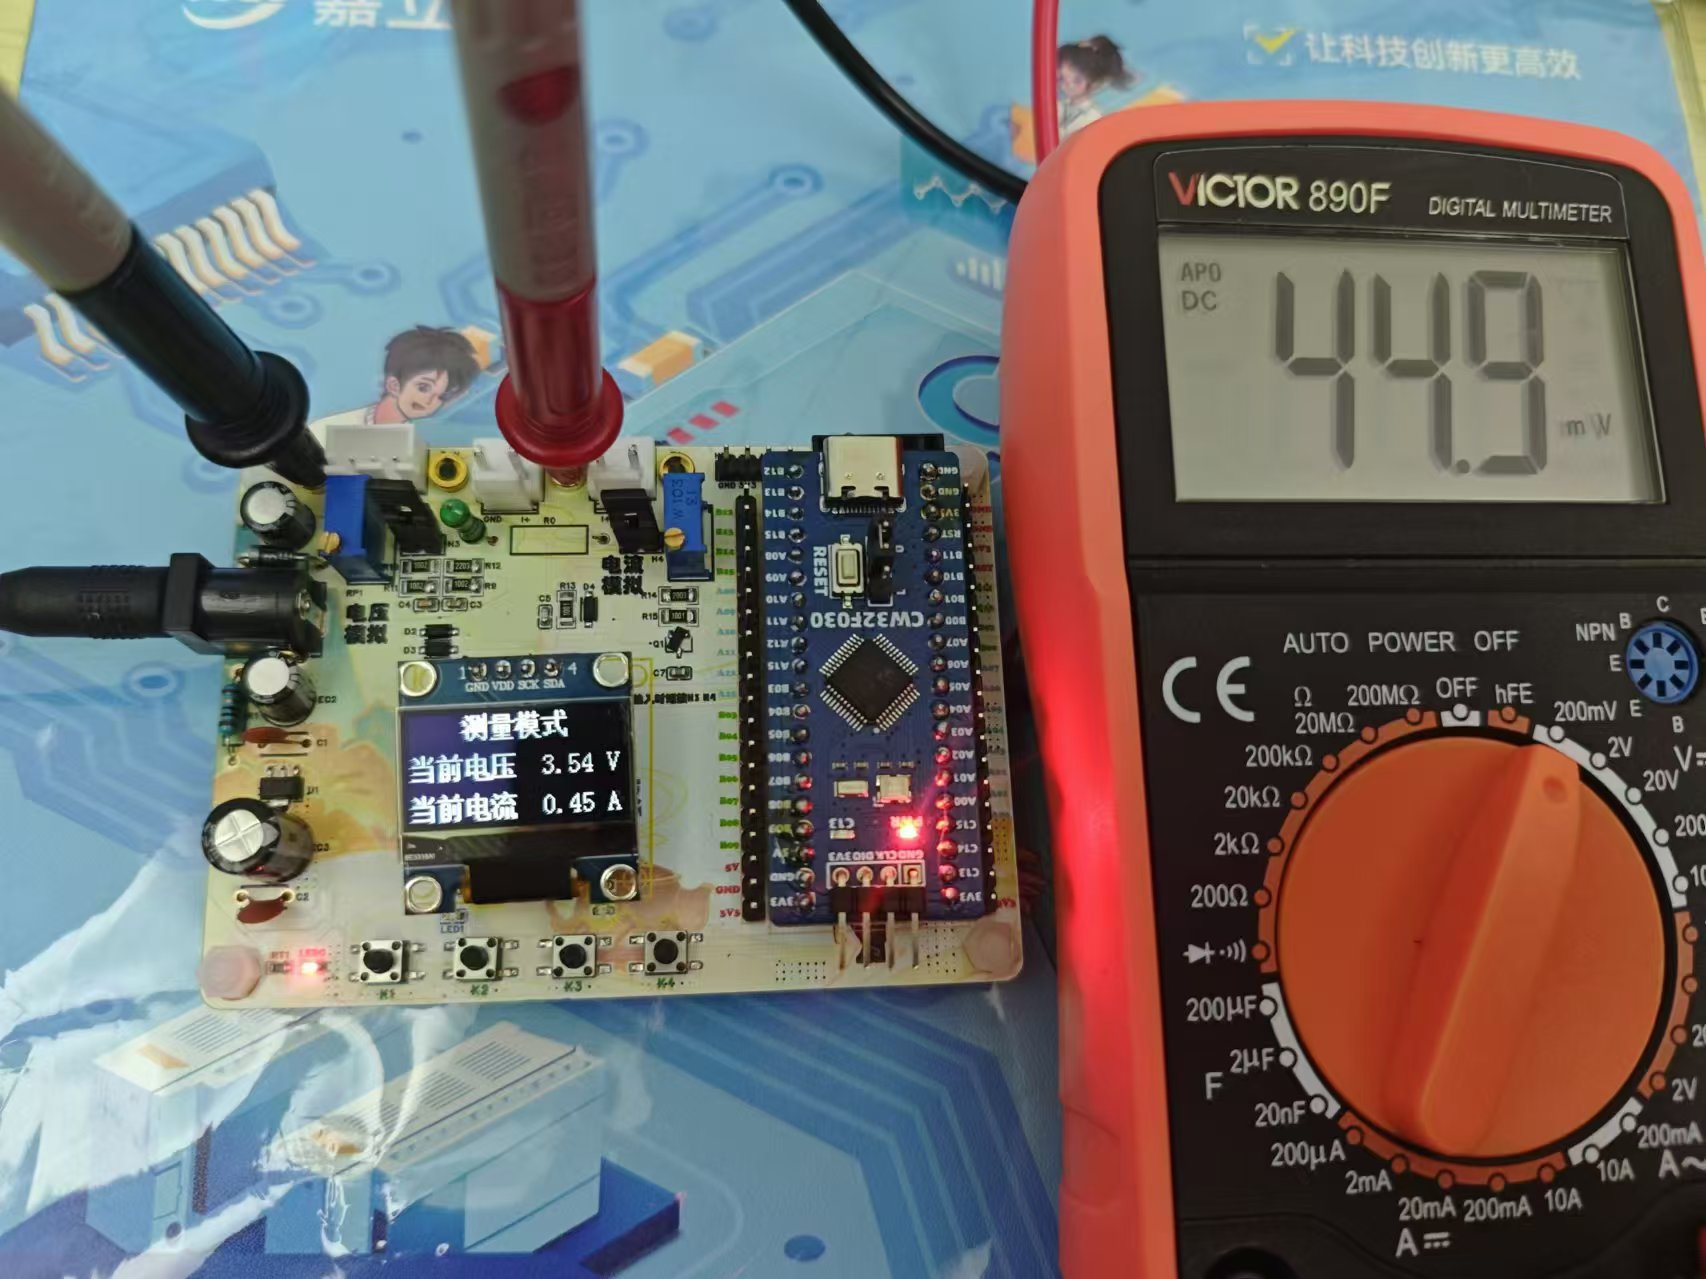
Current simulation measurement
video link:
Bilibili video -- [Voltage and Current Meter Training Camp] Voltage and Current Meter Based on CW32


 京公网安备 11010802033920号

 0402M160G160BT