Power Simulator Predicts Data Center Dynamic Performance
Source: InternetPublisher:同住地球村 Keywords: Data Center Power Simulator Updated: 2025/10/10
Data centers are essential to supporting the ever-increasing demand for data exchange and storage, and have become a fundamental component of global network infrastructure and computing facilities. In 2018, data center electricity consumption reached 205TWh, accounting for almost 1% of the global electricity supply.
Data centers, due to their large power loads and nonlinear performance, have a significant impact on the power grid, with significant short-term fluctuations in electricity demand. Therefore, it is crucial to analyze data center load characteristics and assess how the grid's dynamic performance and transient stability are affected. To achieve this, an accurate and complete data center power supply model is required, along with the development of a power supply simulator or emulator that reflects dynamic performance. Most simulation and emulation platforms include digital simulation tools such as PSCAD and Matlab Simulink, real-time digital simulators such as RTDS and Opal-RT, and analog-based simulation tools with scaled-down prototypes or hardware test benches. Although analog simulators are more expensive, bulky, and difficult to install, they provide more accurate results. This paper proposes a converter-based real-time power simulator for data center power distribution systems. This power simulator, based on the Hardware Test Bench (HTB) platform developed by the NSF/DOE Engineering Research Center, is designed to overcome the challenges presented by digital and traditional analog simulators. HTB is a reconfigurable, real-time grid simulator based on multiple converters. It is used to perform real-time power testing and simulate grid recovery with a wide range of timescales (from microseconds to seconds), increased robustness, reduced computational resources, and the ability to simulate precise transients. By programming interconnected three-phase voltage source inverters (VSIs), it can simulate different power devices such as generators, battery energy storage systems, and electrical loads. Click here to read the original article.
How it works
Figure 1 shows a common and widely used data center AC power distribution system. The power system includes a centralized uninterruptible power supply (UPS), power distribution units (PDUs), rack-level power supply units (PSUs), server boards, and loads. The air cooling system includes cooling towers, chillers, pumps, computer room air handlers (CRAHs), and server room fans.
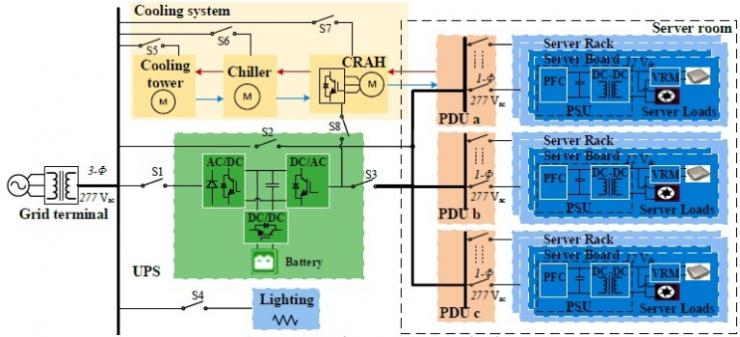 Figure 1: Typical AC power distribution system in a data center
To improve system power efficiency and maintain reliable server operation, data centers typically use multi-mode operation. The following three main operating modes are used:
1. Normal Eco mode, used when utility power is within acceptable limits to directly support server loads through the PDU and PSU. In this mode, the UPS is bypassed and operates at light load.
2. Double conversion mode, used when the utility voltage is not within the permitted range but still within the UPS input range. In this mode, the UPS turns on to regulate the power and supply power to the server load.
3. Battery mode: used in the event of a power failure or major grid outage. In this mode, the UPS is disconnected from the grid, and the backup battery provides the required DC power to the inverter. The server load is continuously powered by the UPS until the utility power is restored.
In the event of a severe power outage, the cooling system is disconnected from the grid and the CRAH is powered by UPS backup power to keep air flowing until AC power is restored.
Average Model
Data centers can be represented using a nonlinear average model that does not account for switching ripple. The average model of a UPS operating in continuous conduction mode (CCM), as shown in Figure 2, includes the front-end boost power factor correction (PFC) rectifier, VSI, DC/DC converter, and battery pack for energy storage. The UPS battery pack consists of two parallel stacks of 182 lithium-ion cells. Appropriate mathematical equations are used to simulate the battery charging and discharging processes.
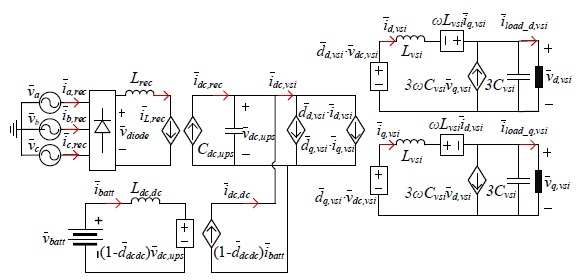
Figure 2: UPS average model
In CCM operation, the average model of the PFC converter (PSU front end) is shown in Figure 3. Its purpose is to improve the power factor and provide DC bus voltage regulation.
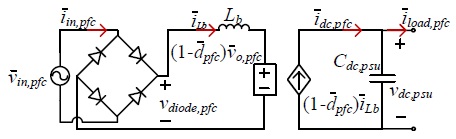
Figure 3: PFC average model
LLC resonant converters are often used in isolated DC/DC stages due to their high efficiency operation with a wide input variation. In this model, the LLC converter is simplified to a controlled power load, depending on the server load.
Regarding the cooling system, aggregated grid-connected induction motors are used to represent the cooling towers, chillers, and pumps, while the CRAH is modeled by motors based on two-stage variable frequency drives (VFDs) (Figure 4).
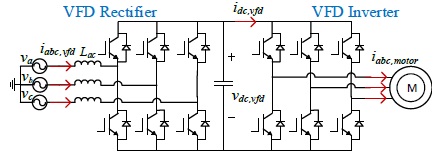
Figure 4: VFD-based motor model
The total server load is estimated based on a linear model, where server utilization is:
P tot,server = N rack × N server × P server
Discrete Model
The next step involves converting the nonlinear average model into a discrete-time version through digitization. A generalized model with explicit input and output variables is required, and all data center model and control functions are implemented on the HTB platform's VSI digital signal processor.
First, the entire nonlinear average model is digitized with a 0.2 millisecond sampling period and converted into discrete-time equations. Subsequently, a generalized model with top-level control is proposed for a data center power simulator, as shown in Figure 5. Given the terminal voltage (Vt) and grid frequency (f), the top-level control determines the operating mode based on the Vt value. At each model level, the input variable is the output voltage of the previous level, while the output variable is the calculated input current, which is passed to the next level. Finally, the top-level control updates the grid terminal current (it) and begins a new operating cycle.
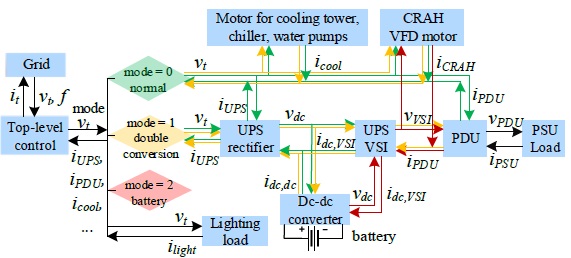
Figure 5: Generalized model with top-level controls
The data center simulated on HTB is shown in Figure 6.
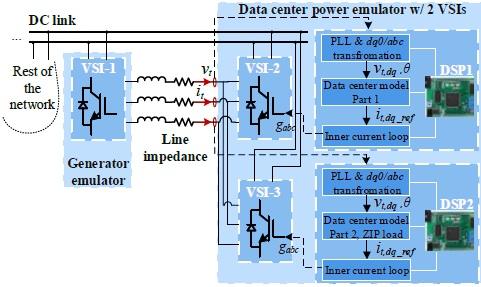
Figure 6: Structure of the data center simulator on HTB
Experimental results and analysis
A simulation model of the data center was developed in Matlab Simulink, and its results were compared with the data center power simulator implementation shown in Figure 6.
The experimental results are shown in Figures 7-9, each of which refers to a different voltage sag event, as this is one of the most common grid disturbances. The comparative waveforms include the terminal voltage amplitude (Vt,pu), terminal active and reactive power (Pt,pu and Qt,pu), the power supply AC input voltage (Vac_PSU,pu), and the power supply DC bus voltage (Vdc_PSU,pu). Figure 7 shows the case of a 7% terminal voltage sag. Because the terminal voltage did not exceed the allowable input range, the data center system continued to operate in normal mode. However, the dynamic changes in Vt,pu affected the induction motors in the cooling system. When a 26% voltage sag occurred (Figure 8), the data center switched from normal eco-mode to double conversion after 500 milliseconds at t = 2.5 seconds. Simultaneously, the UPS switched from a very light server load to a heavy load, resulting in a transient response and subsequent Vt,pu fluctuations. Due to the sudden voltage change, the data center performed transient power changes at the beginning and end of the voltage sag.
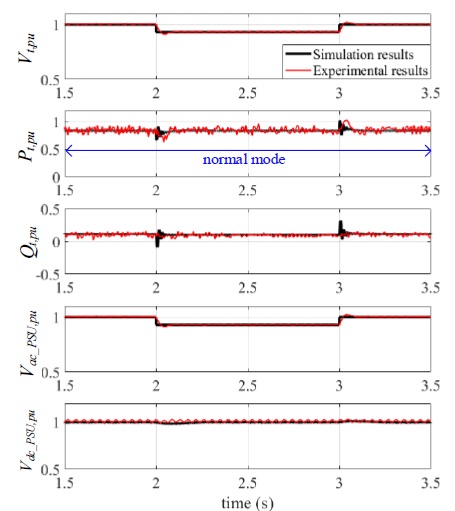
Figure 7: Experimental and simulation results of a 7% voltage sag for 1 second
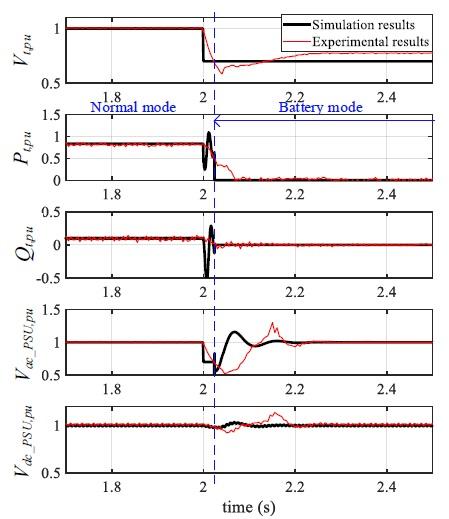
Figure 8: Experimental and simulation results of a 26% voltage sag for 1 second
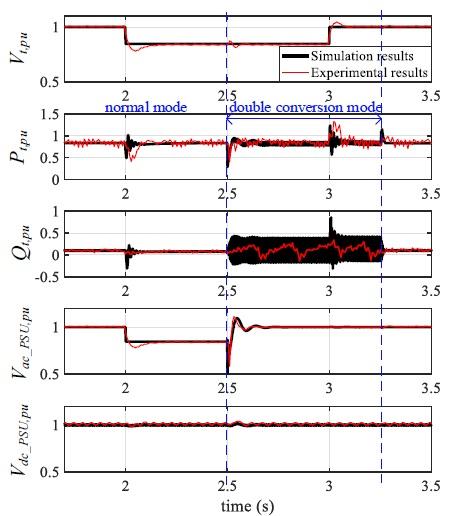
Figure 9: Experimental and simulation results for voltage sag > 30%
Figure 9 shows a more severe voltage sag, greater than 30%. Here, the data center load was disconnected from the grid 20 milliseconds after the sag to protect the PSU and maintain normal server operation. The UPS battery powered on to continue supporting the load, while P t,pu and Q t,pu dropped to zero after the load shedding. In summary, these results demonstrate the consistency between the experimental simulation and the simulation model, validating the accuracy of the power simulator.
- 12V to 28V DC-DC converter (based on LM2585)
- 1.2-36V 5A Adjustable Power Supply (Based on LM317)
- 12V to 120V inverter
- High-current LM317 regulated power supply
- Solar charger for USB devices
- Dual USB charger with switching regulator
- High-current regulated power supply based on LM317
- Battery reverse polarity protection circuit
- How to Create a Solar Power Solution
- Top Three Ways to Split Voltage Rails into Bipolar Power Supplies
- STR5412 power circuit
- DC 12V to AC 100V inverter power supply circuit design
- Output 12V-10A power supply circuit
- 2-phase CPU power circuit using HIP6302 and HIP6601 chips
- Computer motherboard power circuit with +5.1V, -5V, +12V and -12V outputs
- 300A-18V three-phase thyristor voltage regulating electrolytic power supply circuit
- Timing switch AC power circuit
- Household emergency power circuit 02
- Wide input 350mA LED driver circuit based on NCL30000
- Always ready power circuit


 京公网安备 11010802033920号