This circuit is used to measure RF power at frequencies from 1 MHz to 8 GHz with a measurement range of approximately 60 dB. The measurement results are provided as digital codes at the output of a 12-bit ADC equipped with a serial interface and an integrated voltage reference. The output of the RF detector interfaces seamlessly with the ADC and uses most of the ADC's input range without further adjustments. Perform a simple 2-point system calibration in the digital domain.
The AD8318 maintains precise logarithmic consistency for signals from 1 MHz to 6 GHz and operates up to 8 GHz. Typical input range is 60 dB (re: 50 Ω) with error less than ±1 dB. The AD8318 has a response time of 10 ns and is capable of detecting RF bursts above 45 MHz. The device has excellent logarithmic intercept stability (±0.5 dB) over temperature.
The AD7887 can be configured into single-channel or dual-channel operating mode through the on-chip control register. In the default single-channel mode, the AD7887 operates as a read-only ADC, thus simplifying the control logic.
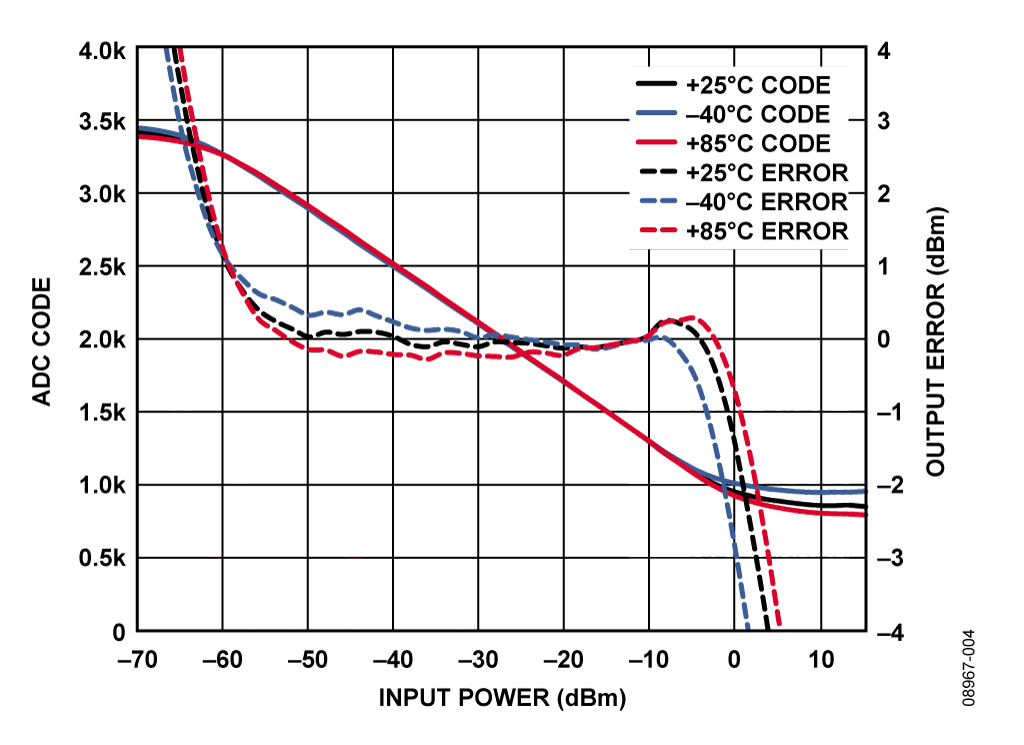
Data shown is for both devices operating over the −40°C to +85°C temperature range.


The RF signal under test is applied to the AD8318. The device is configured in so-called "measurement mode" with pin VSET connected to VOUT. In this mode, the output voltage is linear in dB to the input signal level (nominal −24 mV/dB), with a typical output voltage range of 0.5 V to 2.1 V.
The output of the AD8318 is connected directly to the AD7887 12-bit ADC. The ADC uses its own internal reference and is configured for an input range of 0 V to 2.5 V, resulting in an LSB size of 610 μV. When the RF detector provides a nominal −24 mV/dB slope, the digital resolution is 39.3 LSB/dB. Since the resolution is so high, it doesn't make much sense to adjust the 0.5 V to 2.1 V signal from the RF detector to fit exactly within the ADC's 0 V to 2.5 V range.
The transfer function of this detector can be approximated by the following equation:
![]()
Among them, SLOPE is the slope in mV/dB (nominal value −24 mV/dB); Intercept is the y-axis intercept in dBm (nominal value 20 dBm); P IN is the input power in dBm. Figure 2 shows a typical relationship between detector output voltage and input power.


At the output of the ADC, this equation can be expressed as:
![]()
Among them, SLOPE_ADC is the number of codes/dBm, and PIN and Intercept are both expressed in dBm. Figure 3 shows a typical detector power sweep as input power versus observed ADC code.
Because the slope and intercept of the system vary from device to device, a system level calibration is required. A calibration is performed by applying two known signal levels close to the endpoints of the AD8318 linear input range and measuring the corresponding output codes from the ADC. The calibration points chosen should be well within the linear operating range of the device (−10 dBm and −50 dBm in this case).
Using two known input power levels ( PIN_1 and PIN_2 ) and the corresponding observed ADC codes ( CODE_1 and CODE_2 ), SLOPE_ADC and Intercept can be calculated by :
![]()
After SLOPE_ADC and Intercept are calculated and stored during factory calibration (stored in non-volatile RAM), they can be used to calculate the unknown input power level PIN when the device is operating in the field by :

Figure 3 through Figure 8 show how the system transfer function deviates from this straight line equation, particularly at the endpoints of the transfer function. This deviation is expressed in dB using the equation

Among them, CODE_OUT is the ADC output code; SLOPE_ADC is the stored ADC slope, the unit is the number of codes/dBm; Intercept is the stored slope; PIN_TRUE is the actual input power.
Figures 3 through 8 show the system performance that can be achieved using the AD8318 and AD7887BR in an RF power measurement system. The curve in the figure reflects the relationship between RF input power (dBm) and ADC output code and output error (dBm). The data used to generate these curves was measured at various input power levels, frequencies, temperatures, and using the ADC's internal or external voltage reference. It can also be seen from these figures that when the ADC uses a low-drift external reference, system performance can be improved and temperature-induced drift can be reduced. See the Common Variations section for more details on using an external reference.
For the complete design support package for this circuit note, please visit www.analog.com/CN0150-DesignSupport .


Blockdiagram
All reference designs on this site are sourced from major semiconductor manufacturers or collected online for learning and research. The copyright belongs to the semiconductor manufacturer or the original author. If you believe that the reference design of this site infringes upon your relevant rights and interests, please send us a rights notice. As a neutral platform service provider, we will take measures to delete the relevant content in accordance with relevant laws after receiving the relevant notice from the rights holder. Please send relevant notifications to email: bbs_service@eeworld.com.cn.
It is your responsibility to test the circuit yourself and determine its suitability for you. EEWorld will not be liable for direct, indirect, special, incidental, consequential or punitive damages arising from any cause or anything connected to any reference design used.
Supported by EEWorld Datasheet
EEWorld
subscription
account

EEWorld
service
account

Automotive
development
community

Robot
development
community

About Us Customer Service Contact Information Datasheet Sitemap LatestNews


Room 1530, 15th Floor, Building B,
No.18 Zhongguancun Street,
Haidian District,
Beijing, Postal Code: 100190
China
Telephone: 008610 8235 0740
 京公网安备 11010802033920号

 XC4028XL-4PG299M