Warning/Reminder
0. Code Ownership and Property Rights:
The code contains information and a watermark. Using this code for competitions, graduation projects, or registering products constitutes intellectual property infringement, violates social ethics, disrupts the competition balance, and interferes with the graduation project order. Any such actions will be reported and severely punished. We are not responsible for any consequences. (Think of how pathetic some people look when they ask for code in the comments section of expert forums during competitions.)
(This might be a bit of an exaggeration, but it's the reality. It affects my future, and this project took me nearly half a year, writing 10,000 lines of code, placing 1447 pads, connecting 3310 wires, and thousands of attempts. Excluding school time, it took more than four months.)
1. This project involves 2kV high voltage. Please operate with caution when replicating. Before touching conductors, please ensure the energy storage capacitor is discharged (the defibrillator function has been disabled).
2. Be careful of mechanical injuries from the thermal printer. Do not print without paper to avoid damaging the heating element. The heating element voltage is 12V (model QJ-8R-LXS).
3. When selecting other screen specifications, please consult the vendor for the datasheet and modify the voltage regulator diode parameters of the driver circuit according to VGL, VGH, VCOM, and VLED to avoid burning out the screen
. 4. The blood oxygen saturation probe works by alternating red and infrared flashing at low frequency. To protect your eyesight and prevent visual fatigue, avoid looking directly at the LED of the blood oxygen probe.
5. Do not touch the LED driver section of the screen (near U18 in the red box) during operation to avoid high voltage and high temperature causing injury or screen damage.
6. When disassembling the printhead mechanism, please use tweezers to hold the power supply discharge point to fully discharge it, preventing short circuits that could damage the level converter and MCU.
7. To avoid disrupting the competition, some low-pass and high-pass filter parameters in the publicly released code have been obfuscated (other filter parameters are not obfuscated). You will need to consult the literature again and explore on your own before using it. The complete code will be released in the next version at the end of the year. For personal replication, simply use the AXF file. The AXF file contains normal content.

**The project editor assumes no responsibility for any injuries caused by improper operation.

** Mechanical limit temperature: -20~60 ℃ (resin 3D) -20~X℃ (injection molding/other material 3D) X = material heat distortion temperature ≈ 80 X
*Electronic limit temperature refers to the environmental limit temperature, unrelated to component heating.
Table of Contents:
Clear cover image reproduction (some details omitted in homepage browsing):
· Physical display
· Project description
· Open source license
· Related functions
· Project progress
· Component selection
· Design principle
· Data processing principle
Blood oxygen saturation pulse wave display processing
ADS1298 readout ECG signal calculation and real-time baseline correction
NIBP non-invasive blood pressure data processing
Respiratory wave data processing
Multi-lead synchronous ECG data analysis (R wave identification, QRS origin finding, QRS electrical axis calculation, T wave finding and QTc calculation, chest lead R/S analysis)
· Software description
· Basic operation tutorial
· Instrument operation tutorial
· Frequently Asked Questions & Brainless Questions Showcase:
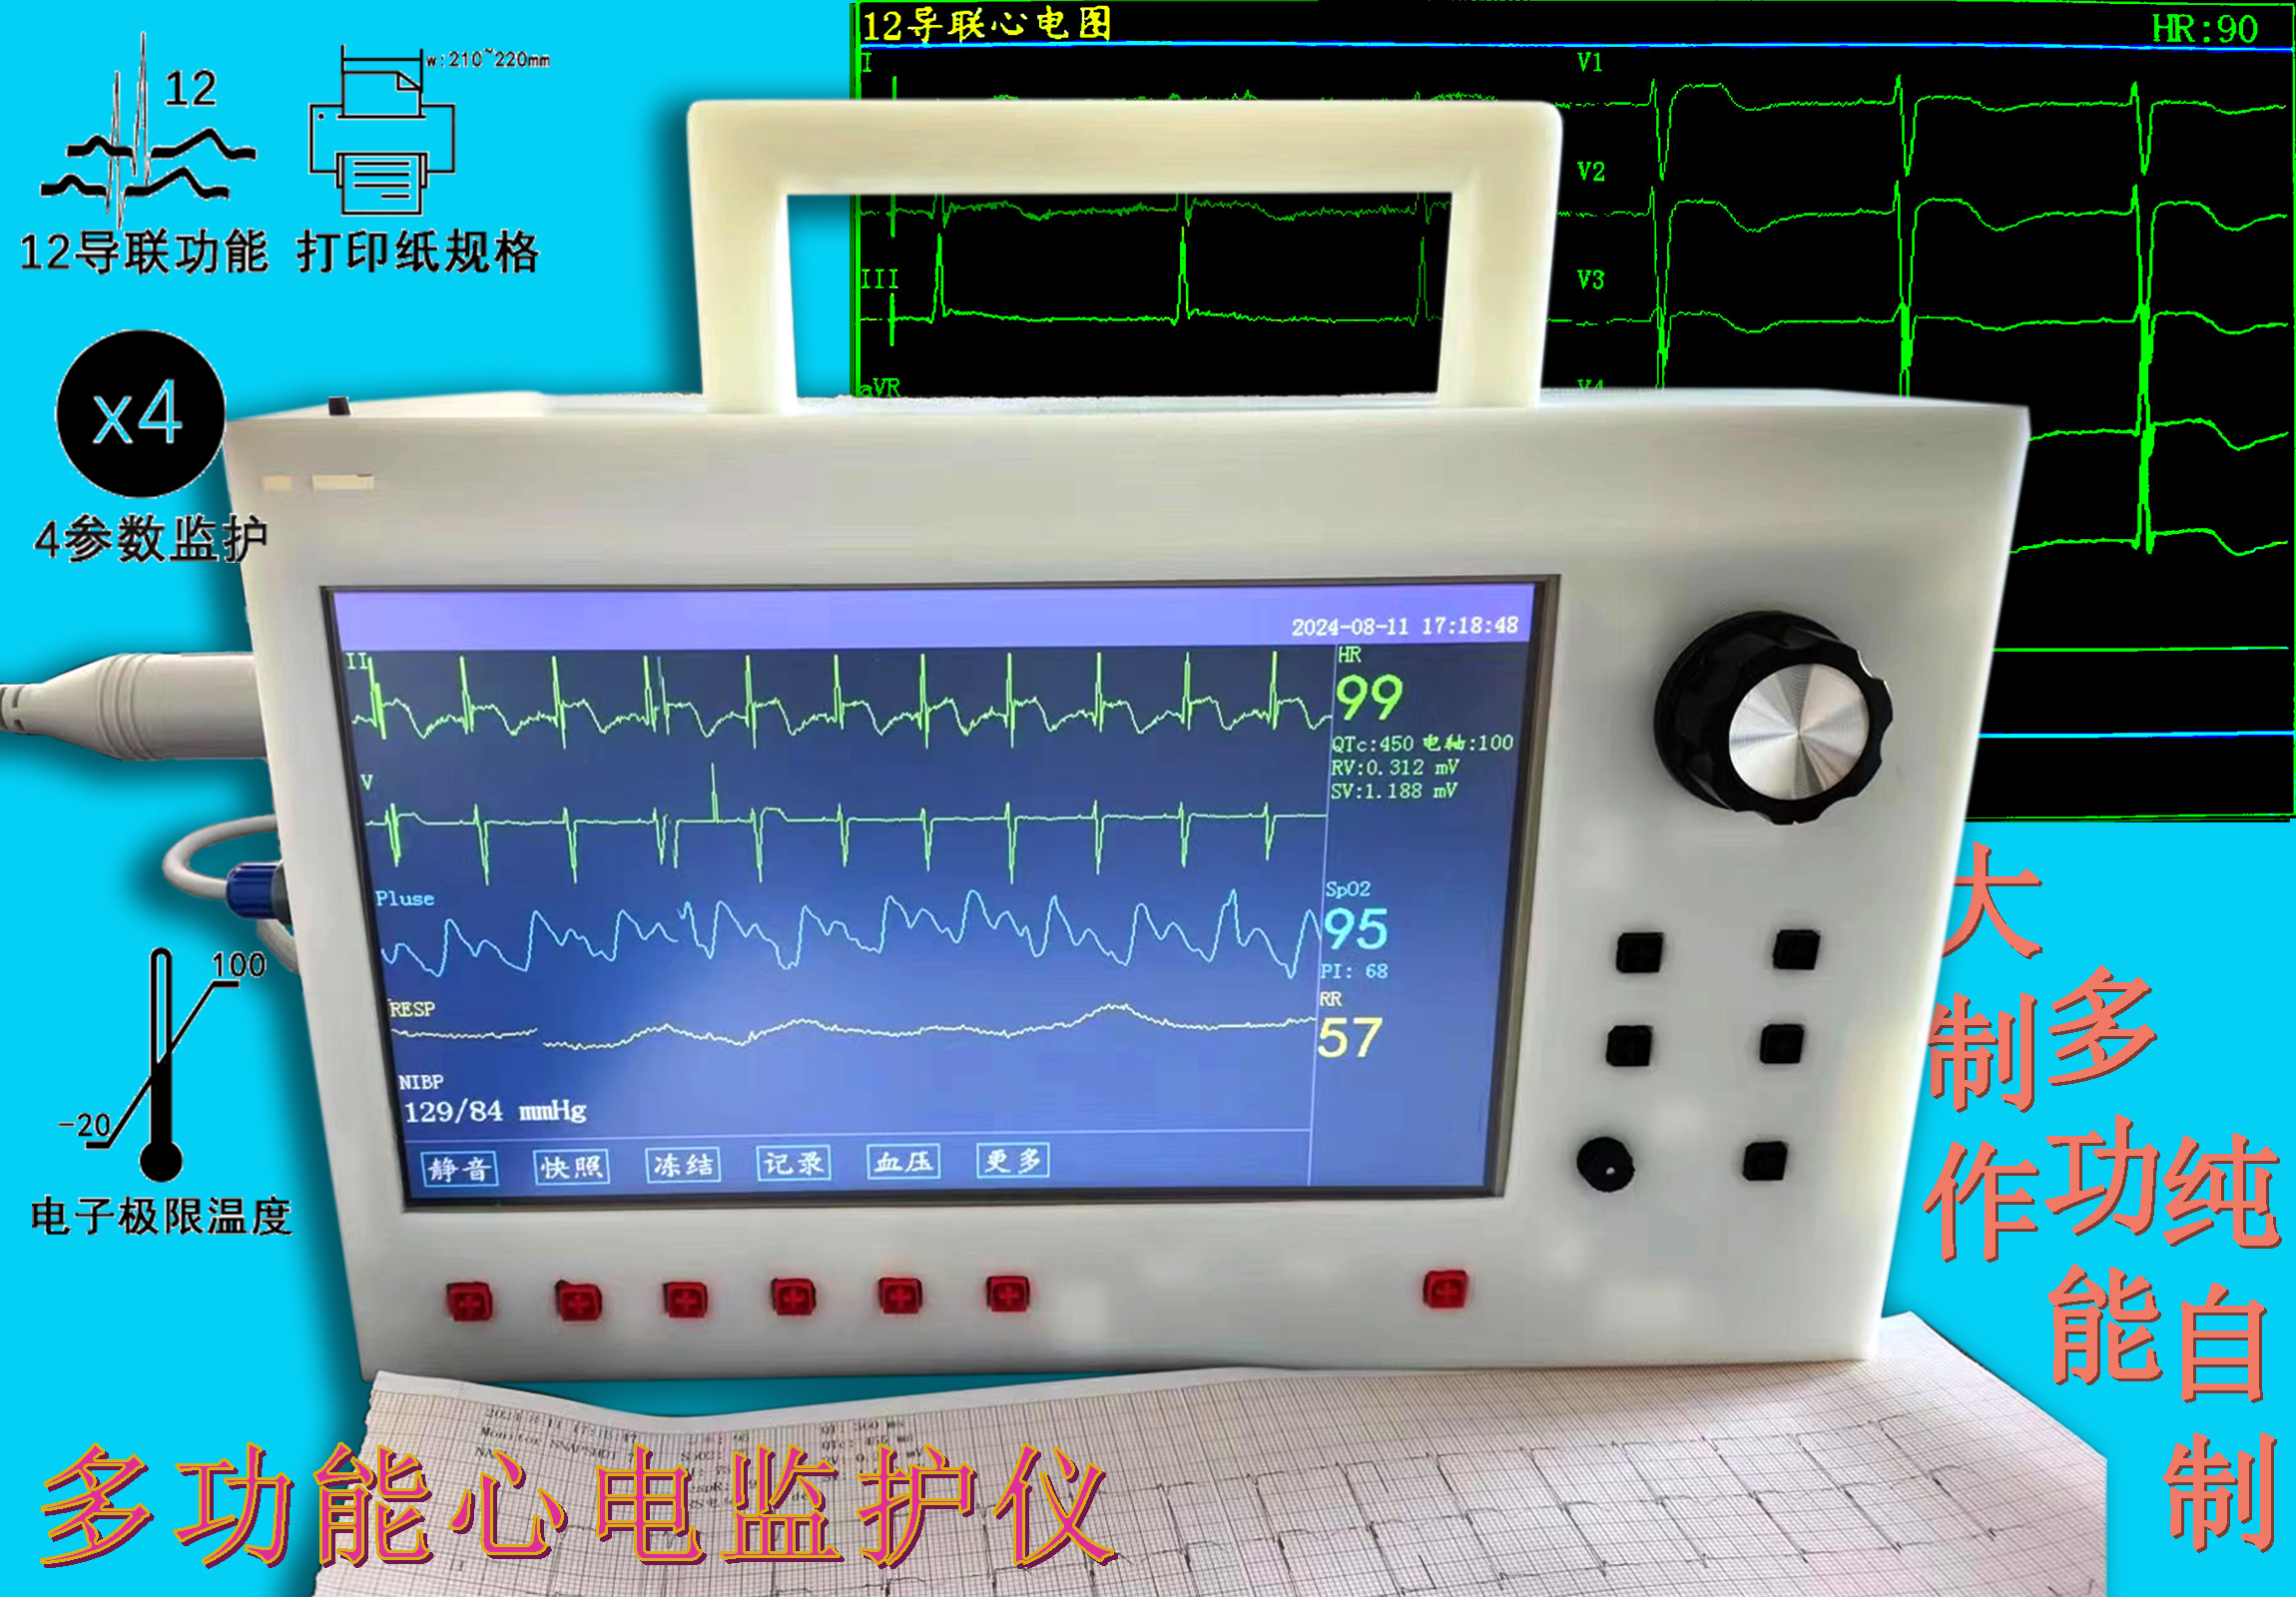
Physical Display

of ECG Monitor Overview (Blank Screen)

ECG Monitor
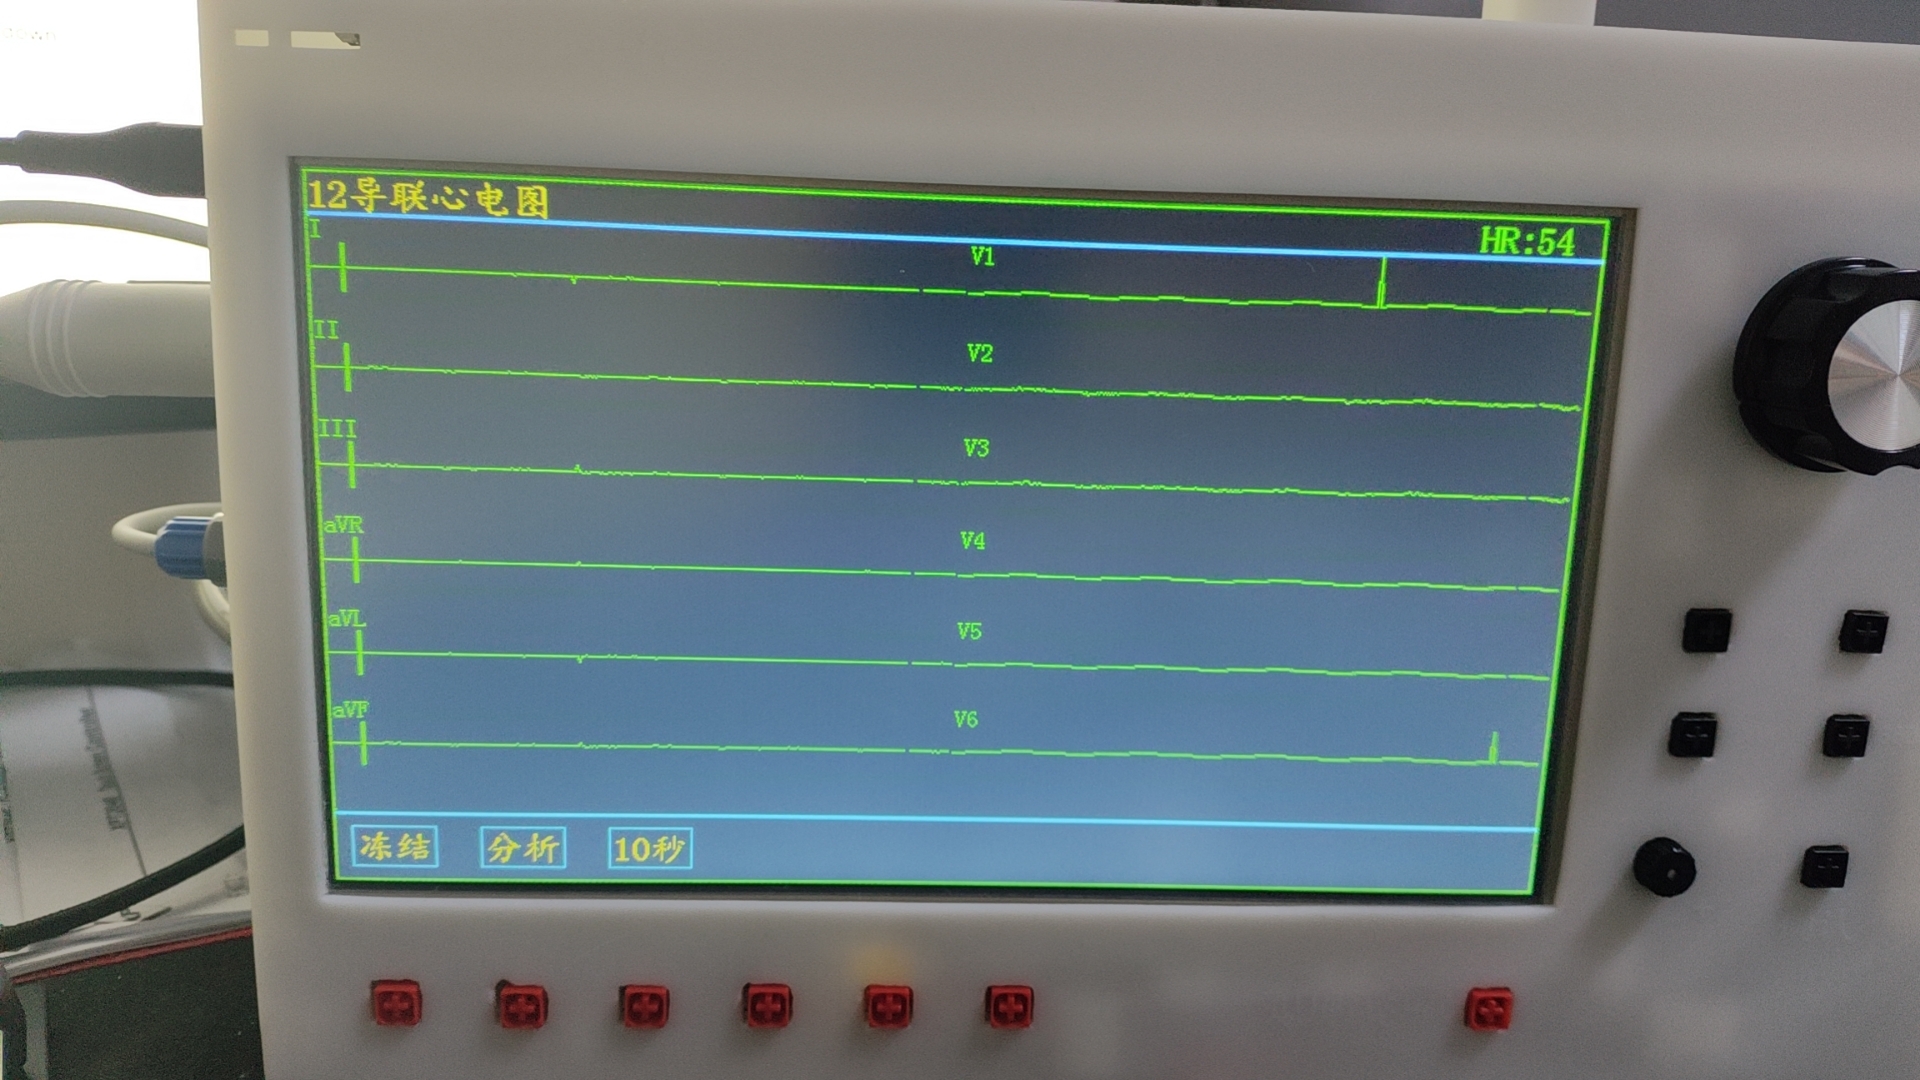
12-Lead Main Interface (Blank Screen)
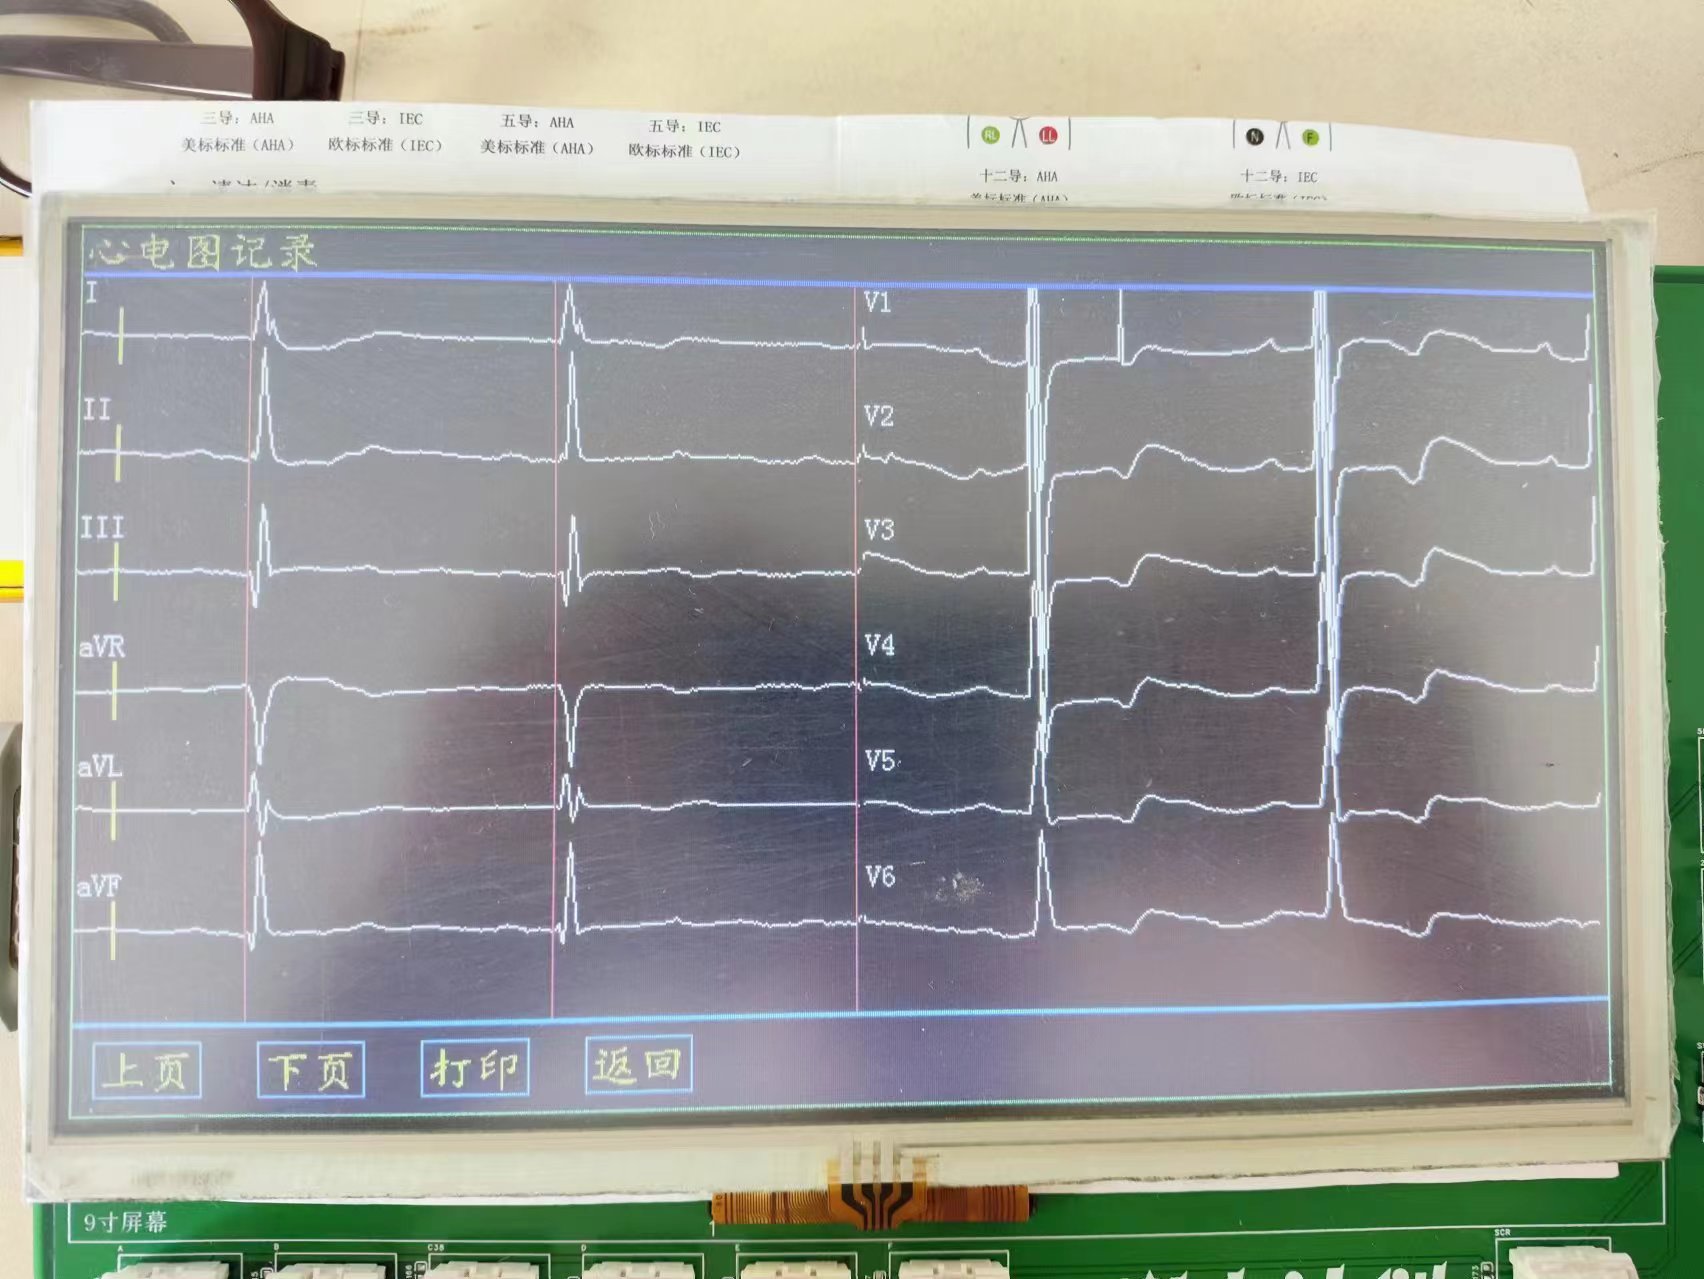
12-Lead Recording Interface (Taken before assembly for a heart failure patient)
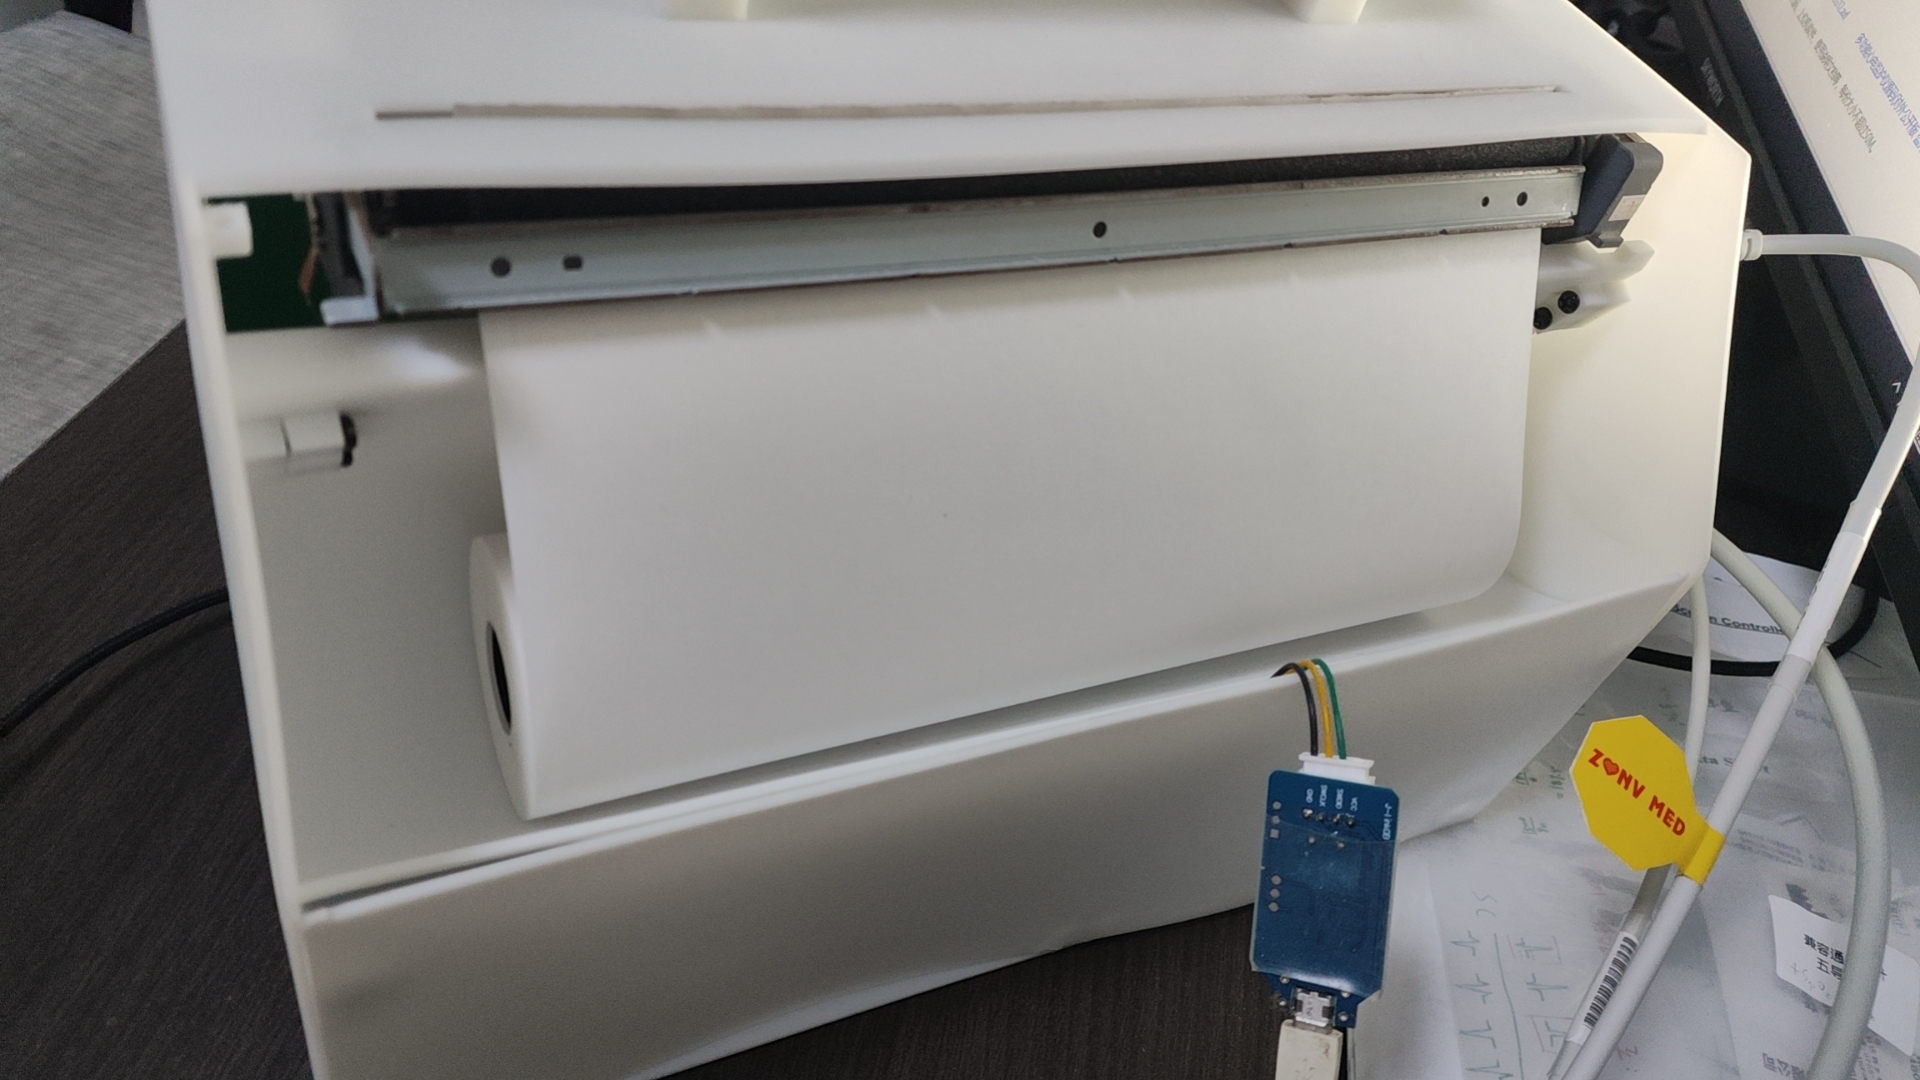
Monitor Paper Box
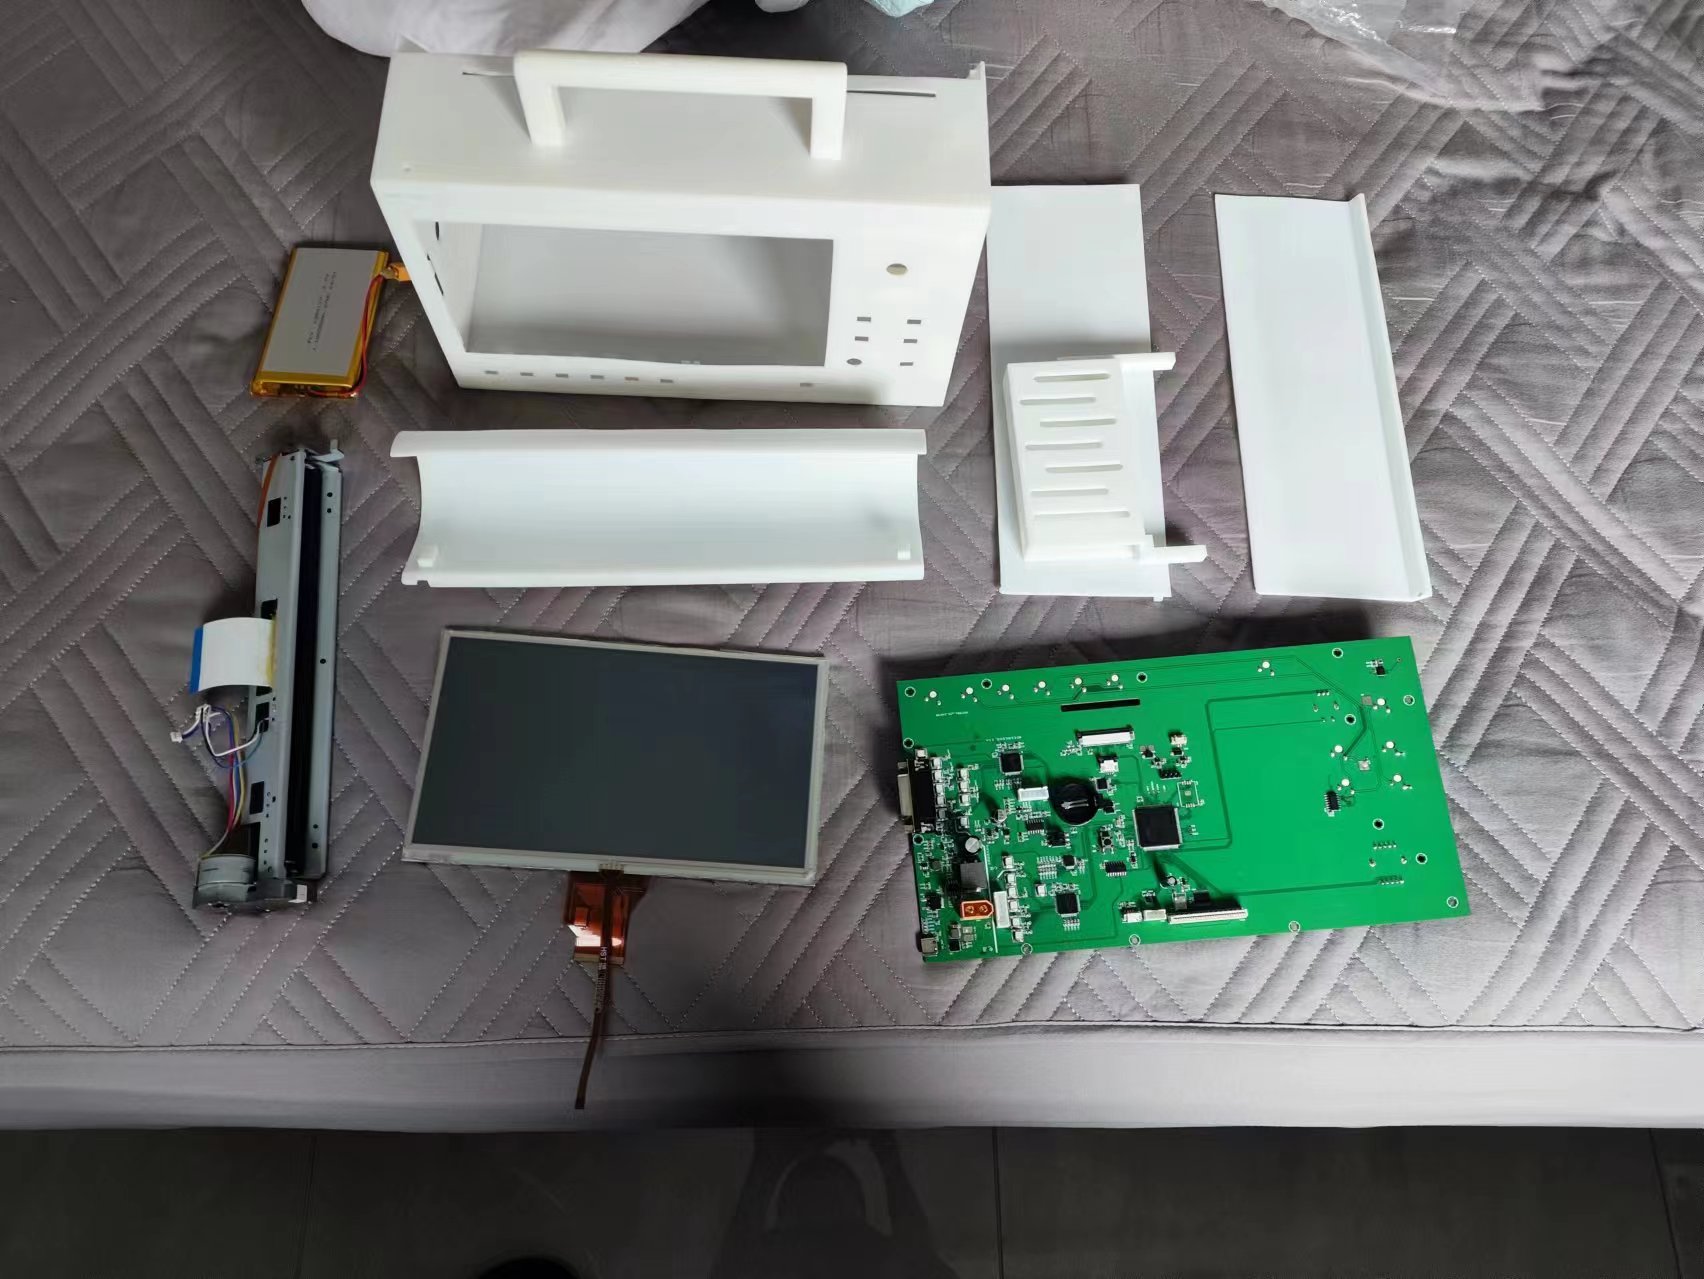
Monitor All Accessories (Large Lego)

Initialization Interface
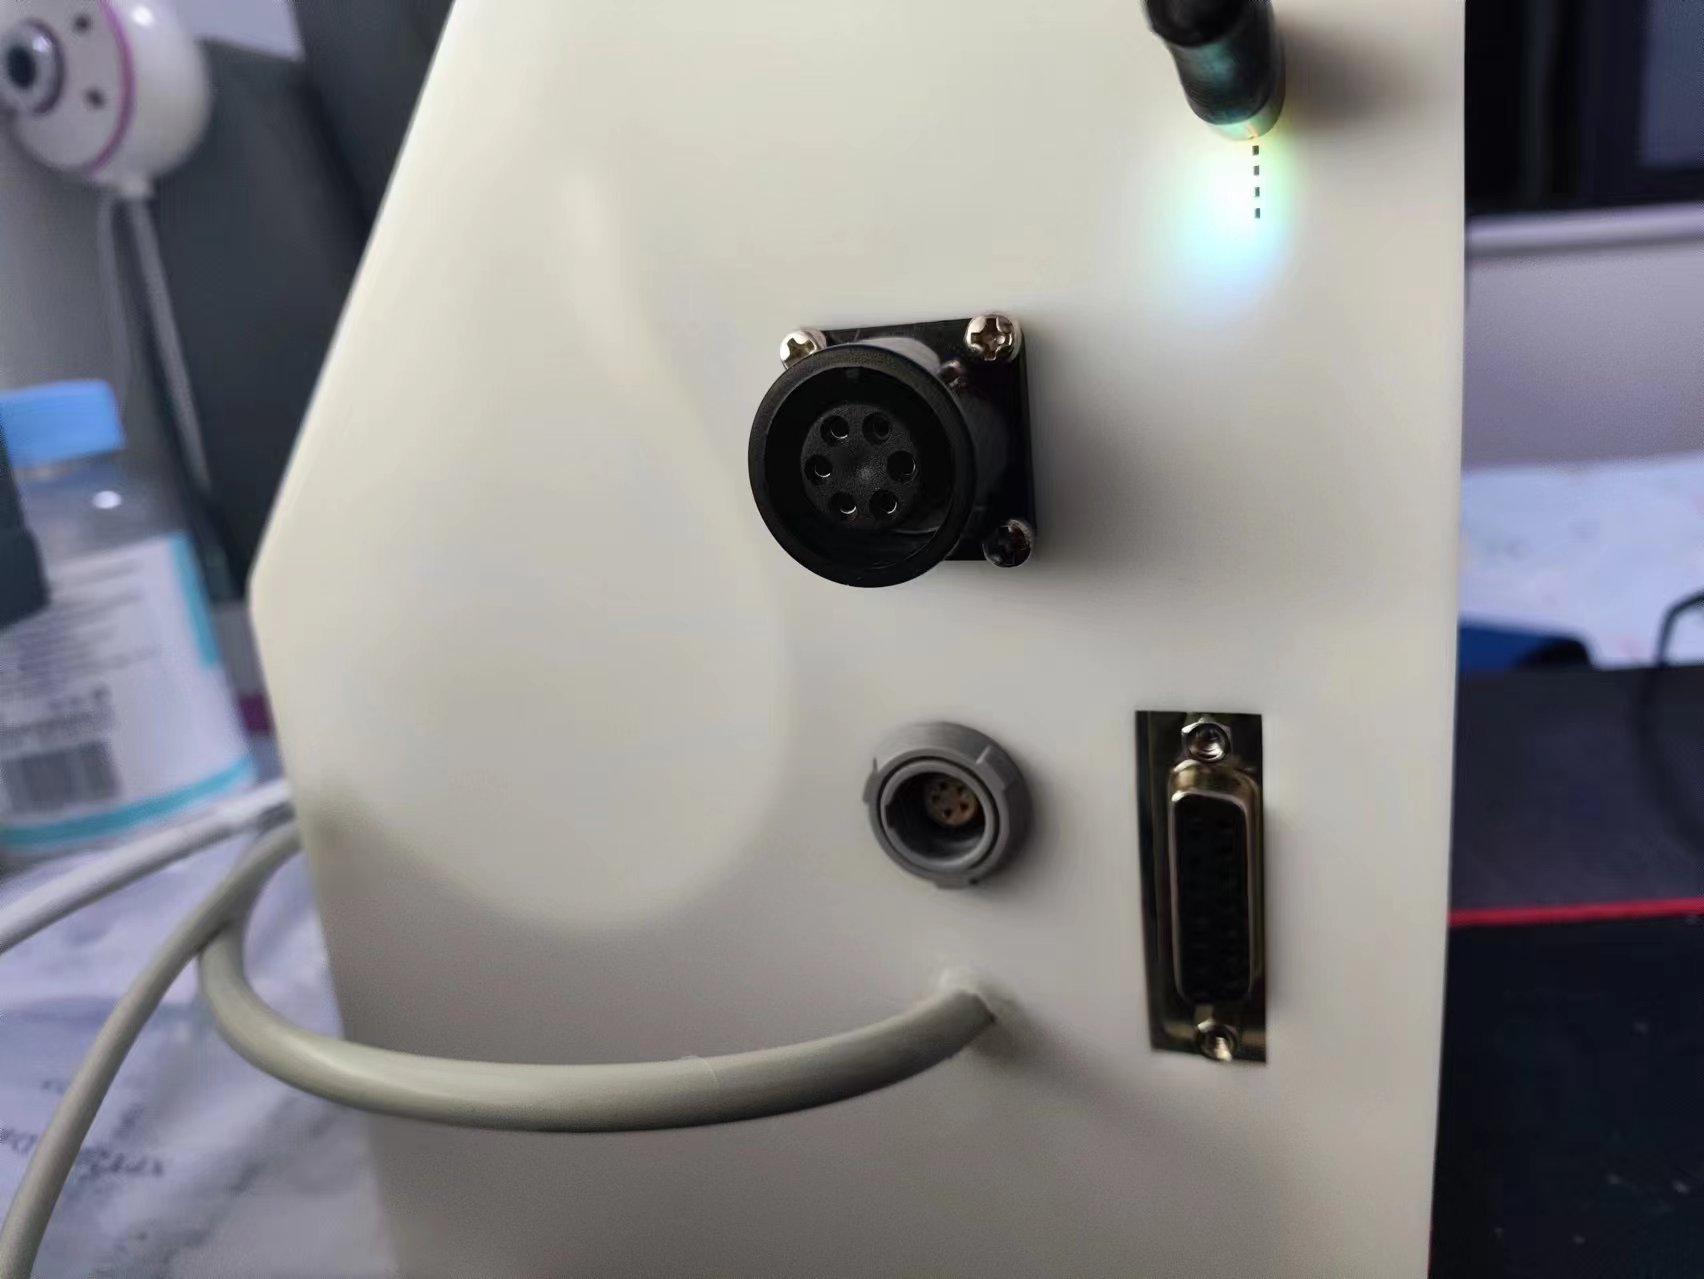
Side Interface
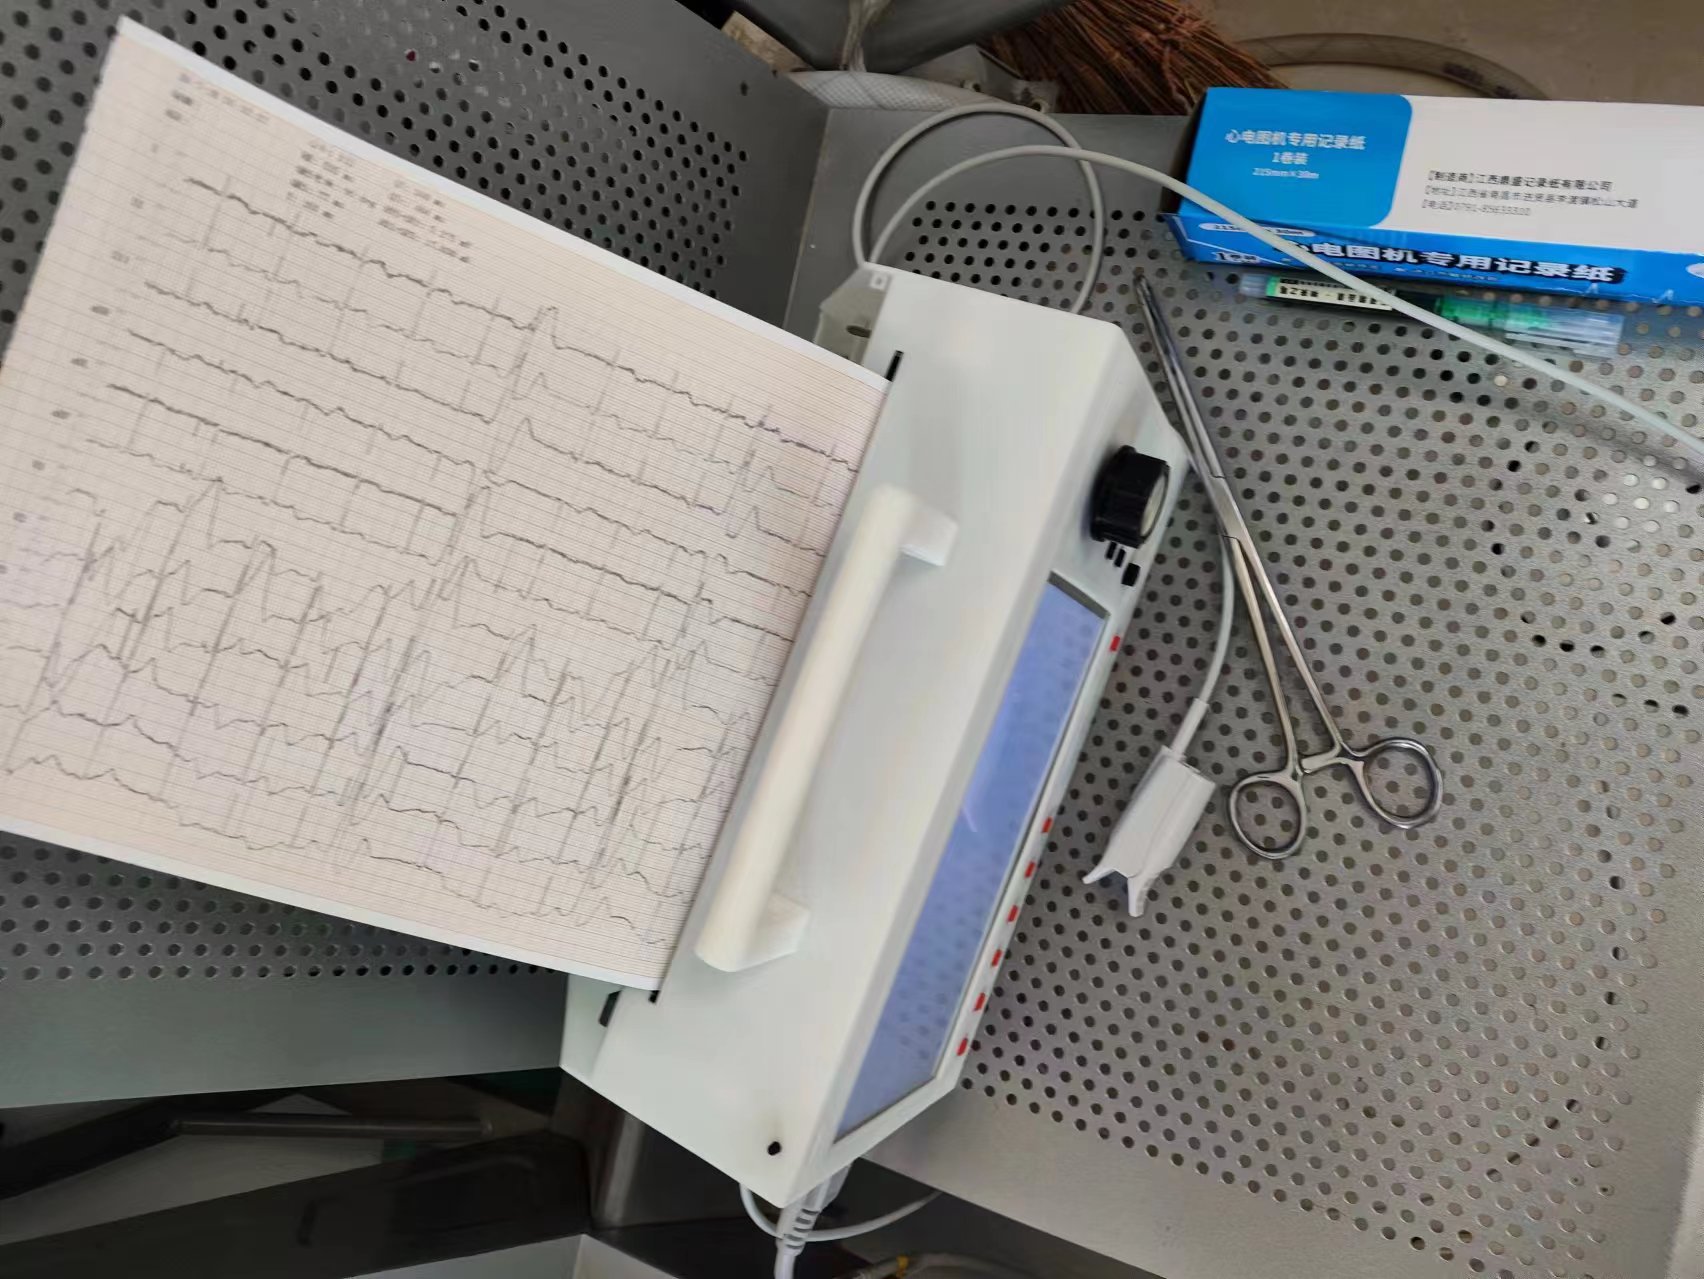
Printing Operation Diagram (Taken during a rural trip for a patient with frequent premature ventricular contractions)

12-Lead ECG Printing Template (Taken during a rural trip for a coronary heart disease patient with frequent angina)
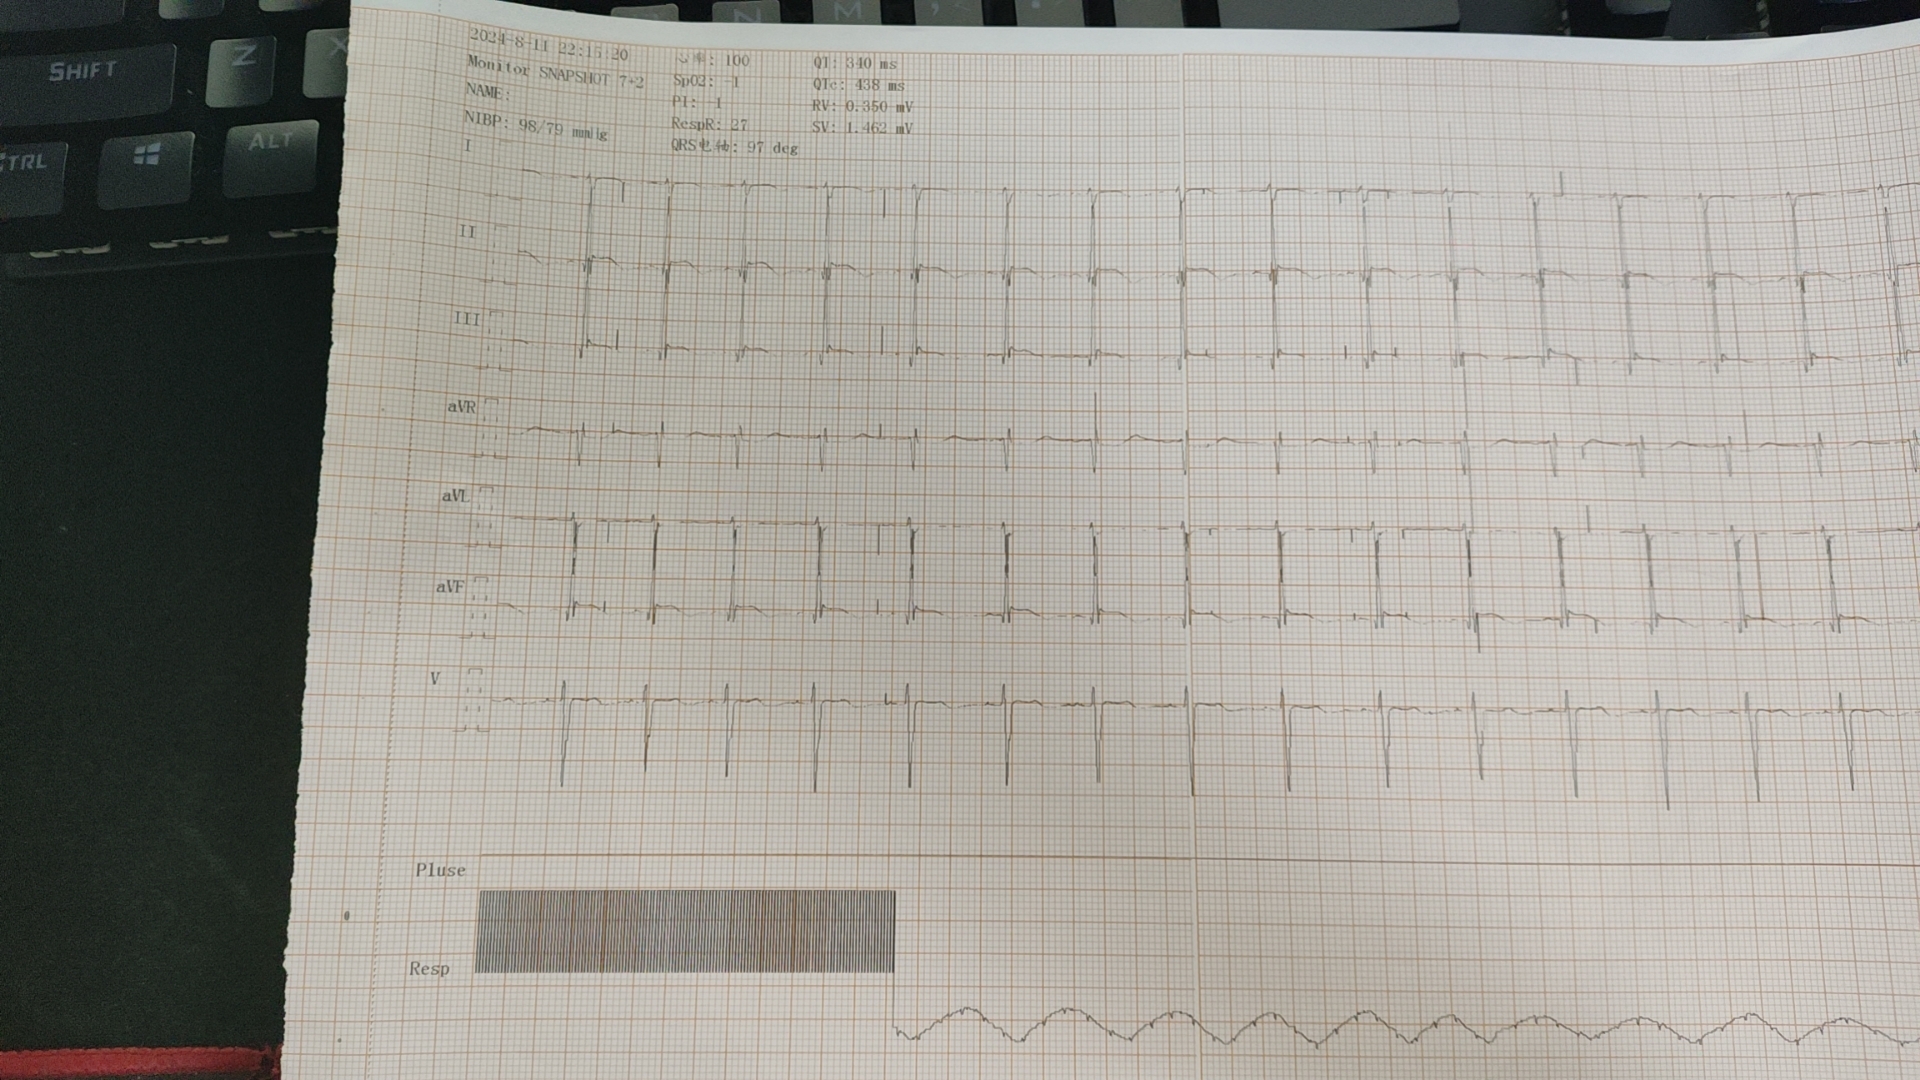
Monitor Snapshot Template (7 ECG Leads + Pulse Wave + Respiratory Wave)
Project Description:
This project uses the GD32F470ZIT6 as the main control chip and the TI ADS129X as the bioelectrical acquisition front-end design. Other acquisition systems use standard structures.
This project combines an ECG monitor with a 12-lead ECG. Powerful yet compact, this machine can be covered with a single A4 sheet of paper at close range, reducing overall weight. When used in emergency medical systems, it alleviates the burden on rescue personnel, allowing them to easily navigate narrow areas.
This project integrates an 8-inch (A4) thermal printer core, enabling rapid printing of records with a fixed length of 30cm. The recording paper includes binding reference lines and a built-in RTC clock for time synchronization, facilitating quick data organization and improving work efficiency. The print template data columns are concise, easy to understand, and neatly arranged, allowing for quick retrieval of important data.
This project includes accompanying video tutorials; click the link at the end of the article to watch!
Furthermore, here you will see:
a tutorial-style explanation of the
GD32F470ZIT6 standard extreme-performance project, achieving the most functions (RAM maxed out, only 2 GPIOs remaining with no interface function, ROM fully written (with -O1 optimization), and overclocked to the highest frequency)
, 10,000 lines of code, 1447 solder pads, and 3310 wires—a major production
featured on television (Henan Urban Channel, 2024-7-30). Currently, only a partial replay of the urban report is available on Douyin. This
project includes: the first 12-lead ECG acquisition circuit
on the entire platform; the first ECG baseline correction and real-time ECG detailed analysis and calibration algorithm
on the entire platform; the first complete basic patient monitoring system
on the entire platform; the first respiratory wave analysis algorithm
on the entire platform; the first blood pressure monitor system on the entire platform (the first blood pressure monitor oscillometric algorithm);
the first actual application project of a thermal printer controller on
the entire platform, with array merging and real-time calculation algorithms; and the first project on the entire platform to use CLUT low RAM to light up a large screen.
We do not recommend that you replicate this project. This project is for personal competition and may not be used for other competitions, graduation projects, etc. This project is extremely difficult and costly to build. Some components may be difficult to purchase or require additional operations after purchase (e.g., printhead accessories need to be obtained from distributors). Assembly is relatively complex due to the casing design. There are many precautions to take when replicating this project; those without medical knowledge may suffer consequences due to improper operation. We also welcome medical device enthusiasts who enjoy challenges to replicate this project! Please follow the
open-source license CC BY-NC-ND.
This license (3.0)
prohibits any commercial use in any form (I really hate people who want something for nothing).
Reproduction without permission is prohibited; if reproduced, the original author must be credited.
No modifications or deletions are permitted during the reproduction process .
The algorithm, interface design, etc., are hard-earned; please appreciate them and respect the rules. Don't be a freeloader!
The code contains watermarked information and numbers. Using this code for competitions, graduation projects, or product registration constitutes intellectual property infringement, violates social ethics, disrupts the competition's balance, and interferes with the order of graduation projects. Any such actions will be reported and severely punished.
To avoid disrupting the competition, some low-pass and high-pass filter parameters have been obfuscated in the publicly released code (other filter parameters are not obfuscated). Users must consult relevant literature and explore the code independently before using it. The complete code will be released in the next version at the end of the year. For personal replication, AXF files are sufficient. AXF files contain normal content
. *All referenced materials in this project are placed on the last page of the schematic diagram and their sources are clearly marked (platform watermarks are omitted, and official datasheets are not marked).
Project-related functions:
ECG monitoring,
one-click 10-second snapshot,
one-click freeze,
blood pressure measurement,
real-time analysis and calculation,
real-time clock display,
12-lead ECG,
real-time rapid heart rhythm analysis,
one-click freeze,
one-click 10-second recording,
automatic analysis and annotation,
one-click quick printing.
Project progress:
2024-01-11 Initial creation, schematic design in progress (5/12), includes power supply, 12-lead module, NAND memory, minimum system, screen, and the rest awaiting completion.
2024-01-12 Schematic power supply section completed, audible and visual alarm circuit and ECG monitoring (excluding respiration) completed (6/12).
2024-01-14 Contacted the printer module manufacturer and obtained the specification sheet (QJ-8R-02LX). Completed the 12V printer power supply design and printer circuit (7/12). Selected defibrillator capacitors, lead wires, and other accessories.
2024-1-17 Blood oxygen module design completed (8/12).
2024-1-18 Panel layout sketch design completed.
2024-1-19 Respiratory module and blood pressure module design completed (10/12).
2024-1-21 High-voltage reed relays were too expensive, high-voltage inductors were unsuccessful to find, and there were no relevant resources for SCR control. The defibrillator design reached a stalemate, raising the question of whether to remove the defibrillation function.
2024-1-25 New GD32 pin definition table summary completed, providing convenience for wiring (by the way, the official documentation is too garish). Control panel circuit design completed (11/12). Defibrillator circuit data successfully found on the internet.
2024-1-26 Defibrillator circuit construction started
2024-1-31 Defibrillator discharge circuit successfully built (by the way, finding information in China is extremely difficult), severely criticize the monopolistic practices of a certain platform

2024-2-3 Defibrillator step-up transformer design completed (but insufficient enameled wire was purchased, not wound into an AWA shape)
2024-2-4 Defibrillator charging circuit design completed, all module designs completed, starting to connect MCU pins (11.999/12), thanks to Professor Sun, an engineering student
2024-2-4 Evening schematic completed (100%), starting PCB layout (3/6)
2024-2-5 Layout completed, starting routing
2024-2-6 PCB design completed, checked and submitted consumables application
2024-3-4 Verification status: Power supply and minimum system verification successful, blood pressure system verification failed (incorrect component selection), issue reserved
2024-3-16 Verification Status: Thermal printer verification successful, but there is a minor issue (12V control, voltage instability). This issue has been retained. The placement of the power indicator LED has been corrected.
2024-3-17 Verification Status: Blood oxygen saturation verification successful (but the accuracy of PI is unknown due to second-degree atrioventricular block; it often reads single digits on my body before rising back up. I plan to borrow an instrument from a hospital during the summer vacation for further verification). Thanks to GD32 Blood Oxygen Measurement - JLCPCB EDA Open Source Hardware Platform (oshwhub.com).
2024-4-20 Modification: Known issues have been fixed, wiring improved (and copper pour optimized). Changes retained.
Verification Status: PI has been tested by others and verified successfully. SpO2 and PI accuracy need to be verified at a hospital during the summer vacation.
2024-4-27 Verification Status: 12-lead ECG circuit test successful. Circuit design flaws have been corrected. Changes retained.
2024-5-04 Verification Status: Blood pressure monitoring function test successful; printer circuit temporarily suspended due to insufficient current supply.
2024-5-05 Verification Status: NAND memory test successful; blood pressure function accuracy verification successful.
2024-5-12 Verification Status: TLI RGB screen refresh test successful (halfway done); RAM exhausted; MCU pin resources scarce, SDRAM addition not allowed; preparing to replace with F470ZIT6; if it explodes again, replace with STM32H7 (annoying).
2024-5-18 Verification Status: Respiratory function test successful; electrophysiology section completed; remaining touch screen, control panel, sound card, and defibrillator to be arranged last.
2024-5-26 Verification Status: Improved code from predecessor; successful use of CLUT to drive full-screen display; no more RAM overflow, saving a lot of brainpower.
2024-6-01 Verification Status: Found all required colors; further optimized code; increased refresh speed; 12-lead baseline correction completed.
2024-6-08 Verification Status: MCU replaced with ZIT6, 12 leads successfully displayed on the screen, RAM is good.
2024-06-10 Verification Status: Screen touch verification successful, screen section completed. Adding interrupts and other miscellaneous items to the button panel on the PCB, preparing for board fabrication.
During: Currently attending school and tutoring classes...
2024-07-03 Verification Status: Improved code, doubled thermal printer speed, waveform clearer, reaching general levels.
2024-07-05 Verification Status: Changed computer communication method from USB to serial port, protected important signals, improved power supply, enhanced anti-interference performance, added screw holes, preparing to design a 3D shell. New PCB Submission
2024-7-14 Design Status: 3D shell design completed
2024-7-16 Verification Status: Button panel verification completed
2024-7-18 Implementation Status: 12-lead ECG operation interface design completed, real-time basic heart rate detection program completed
2024-7-19 Implementation Status: ECG QRS accurate recognition program completed
2024-7-20 Implementation Status: ECG Q wave recognition, QRS duration and electrical axis calculation program completed
2024-7-22 Implementation Status: ECG QT, QTc, T calculation program completed
2024-7-30 Implementation Status: 12-lead ECG section officially completed, ECG monitoring section started
2024-7-31 Implementation Status: Monitoring section successfully connected to ECG and blood oxygen saturation
2024-8-01 Implementation Status: Monitoring section successfully connected to respiratory measurement, monitoring lead detachment, probe detachment, and finger detachment recognition completed
2024-08-04 Implementation Status: Fixed the issue of QRS low voltage failing to recognize heartbeats by readjusting the threshold through a secondary grace period; successful integration of the monitoring system with real-time ECG analysis.
2024-08-05 Implementation Status: Fixed the issue of unwarranted self-increase in chest lead voltage calculation through memory operations; completed respiratory rate calculation.
2024-08-06 Implementation Status: Completed the interactive interface design for the ECG monitoring system.
2024-08-08 Implementation Status: Completed monitor freezing and snapshot function.
2024-08-10 Implementation Status: Blood pressure monitor completed; all designs for the Spark Project completed successfully; preparing to improve and open-source the data the next day.
2024-08-11 Implementation Status: Discovered an anomaly in the blood pressure calculation method; corrected it; optimized the monitor snapshot printing template.
Component Selection
: Battery Management: IP5310 (Ingenic Semiconductor). It features excellent power management and current path management, with power indicator lights, short-circuit protection, high conversion efficiency, and a 3A current carrying capacity.
ECG front-end: ADS1298 (TI) high precision, easy operation, digital device, reducing interference in the transmission path.
Respiratory measurement front-end: ADS1292R (TI) low cost, high precision, easy operation, digital device, reducing interference in the transmission path (ADS1294R out of stock, a forced choice).
Blood pressure sensor: The manufacturer is about to go bankrupt, this device is discontinued, please find another option, it will not be introduced here (truly unexpected, never expected, it came too suddenly).
Voltage reference source: REF3433IDBVR (TI) 95uA low power consumption, low temperature drift, suitable for harsh environments, high precision, easily meets national standards.
Printhead mechanism: JX-8R-LXS (QJ) currently the lowest cost found, listed price 500, available for around 400. High printing accuracy, low power consumption, simple and customizable operation. (Need to contact distributor for goods)
Design Principles
: Electrocardiogram Principle: How is an electrocardiogram generated? - BV1MS4y1s7nM (See data processing section for calculation)
Blood Oxygen Saturation Principle: Teacher Tang's lecture on the Electronic Design Contest - BV1TP411F7Ap (Originally learned from Leyu Technology, but I logged out and can't find it)
Respiratory Measurement Principle: During respiration, the rise and fall of the chest changes volume and density, thus changing impedance. (See data processing section for calculation)
Blood Pressure Monitor Principle: Teacher Tang's lecture on the blood pressure monitor in the Electronic Design Contest - BV1yM411b75P (See data processing section for calculation)
Data Processing Principle
1. Blood Oxygen Saturation Pulse Wave Acquisition
The diagram shows the PPG data we need to obtain (similar). If we simply set a threshold to "cut off" everything, then signals outside the range will be cut off, presenting a false full-range appearance on the screen. The pulse wave values returned after measurement are different for each person, and the waveform is also susceptible to unexpected influences: such as unauthorized movement of the pulse oxygen clamp, second-degree atrioventricular block, asphyxia or other causes of pulse oxygen drop, and limb movement that obstructs blood flow. Therefore, we must use a special algorithm to adapt to these factors.
Reading window:

We set the display window to a range of 0-1000. To display the complete graph within the window, we first need to mark the maximum and minimum values. Marking the maximum and minimum values makes it possible to fit the entire graph into the display window. However, the values returned by the sensor are very large and cannot be directly displayed in the window, so we need to perform further necessary processing.
Processing Window:

The pulse wave provides a lot of information. To preserve the pulse wave's rise and fall, as well as more details in the graph, we use a segmented maximum/minimum value method instead of median filtering. Now, we set a period and take the maximum/minimum value every 1000 periods (the relevant code is marked in red, the same below).
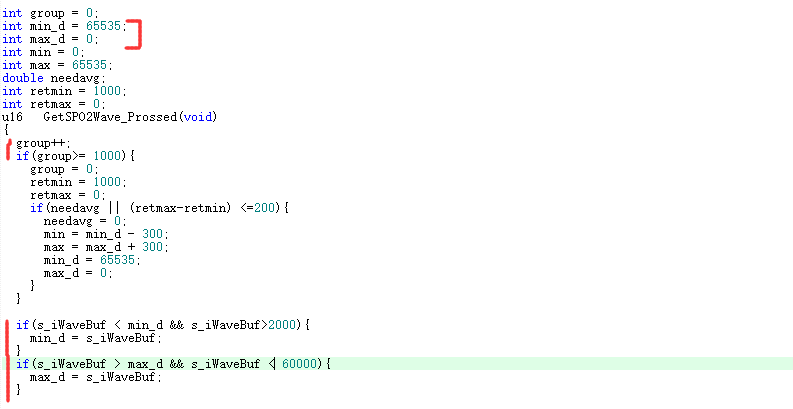
Then, we subtract the minimum value from the value and directly omit the numbers less than the minimum value. However, the disadvantage of segmented value taking becomes apparent. So, while omitting the numbers, we tell the value taking part to retake the value (the same applies to the maximum value).
Doesn't this cause the full-scale phenomenon again? In fact, this is a necessary sacrifice for displaying trends. The signal will be re-sensed in the next cycle, and each cycle only lasts for a 2-second
processing window.

Then, we capture the data and plot the graph on the display window. To reduce over-range phenomena, we add a 300-degree grace period to

the PPG display window for the maximum value.

However, a few seconds after dimming, the maximum value of the pulse wave is incorrectly determined, or the pulse weakens when the patient experiences arrhythmia. During this process, the pulse data does not exceed the maximum value, but the waveform is abnormally small, difficult to read, or even a straight line that cannot be read. At this time, we need to detect the waveform amplitude. When the amplitude is lower than the set value, we send a request to
the PPG display window (abnormal) to re-determine the maximum value.


In this way, when the PPG signal has an abnormal amplitude, the program will "stretch" the waveform. Thus, the PPG search and unexpected handling
PPG display window (runtime) are solved.

The PPG display window (actual operation) clearly shows the processing of each cycle.
*PPG differs from ECG and cannot replace ECG in diagnosing complex conditions. However, PPG has its uses, such as detecting atrial fibrillation, premature beats, conduction blocks, tachycardia, or bradycardia. It only serves a detection purpose; ECG confirmation and qualitative analysis are still required.
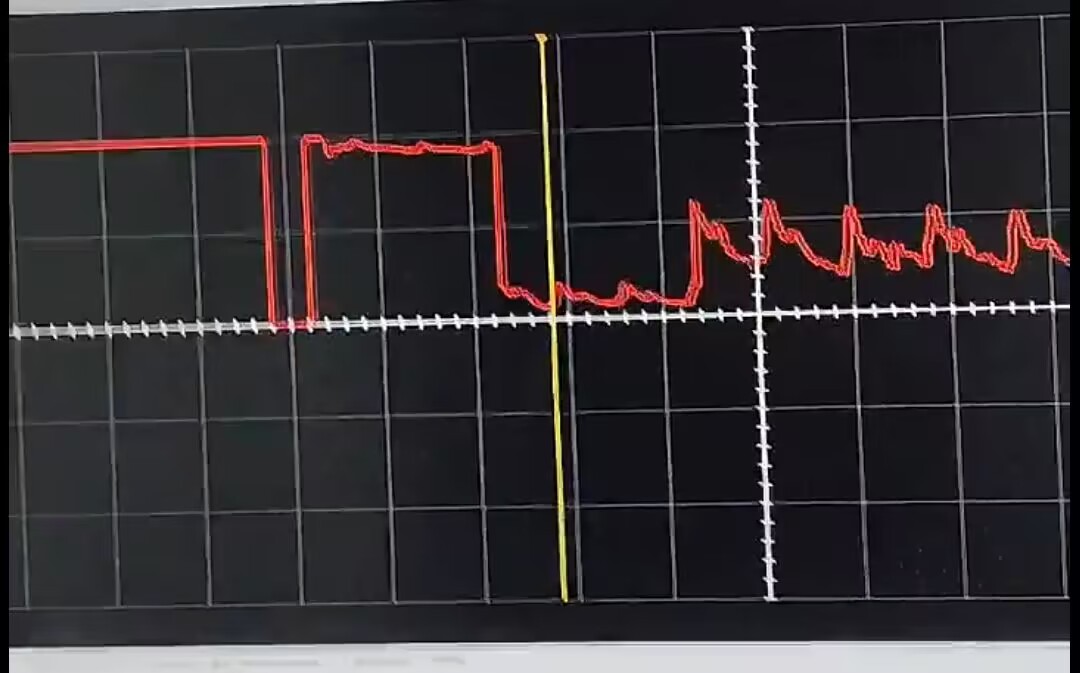
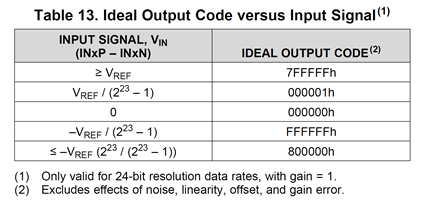
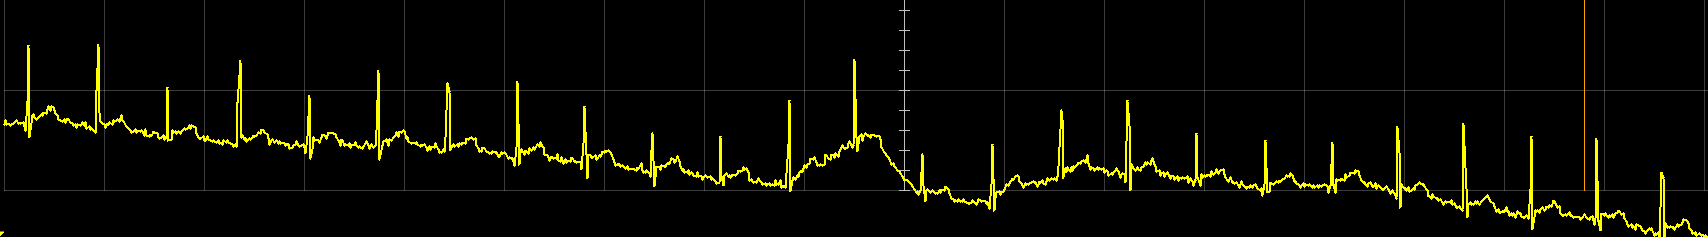
2. ADS1298 ECG Signal Readout and Real-Time Baseline Correction:
First, let's criticize the peculiar output method of the ADS1298. When the signal is from 0 to the positive full scale, the output value is 0 - 0x7FFFFF. However, when the signal is from the negative full scale to 0, it follows 0x7FFFFF, becoming 0x800000 - 0xFFFFFF.
Therefore, the plotted number line looks like this. Further processing is needed to connect the two; otherwise, when the data is stuck between positive and negative, the calculated data will be unanalyzable.
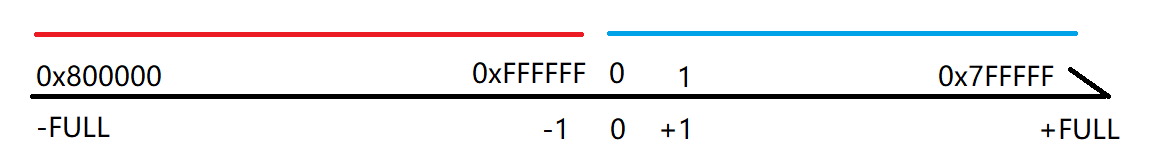
Currently, red is in one group and blue is in another. According to uint, blue comes first, then red. Now we put the blue last, and the rest is handled by the baseline correction logic.
To put the blue last and prevent overflow, we divide the process into three steps.
The first step is to determine whether the data should be above or below 0.
The second step, if below 0, subtract 0x800000 from the data to make the negative full-scale value 0.
The third step, if the data is above or below 0, add 0x8000 to the data.

This way, data reading will be smooth and can be safely passed to the baseline correction logic
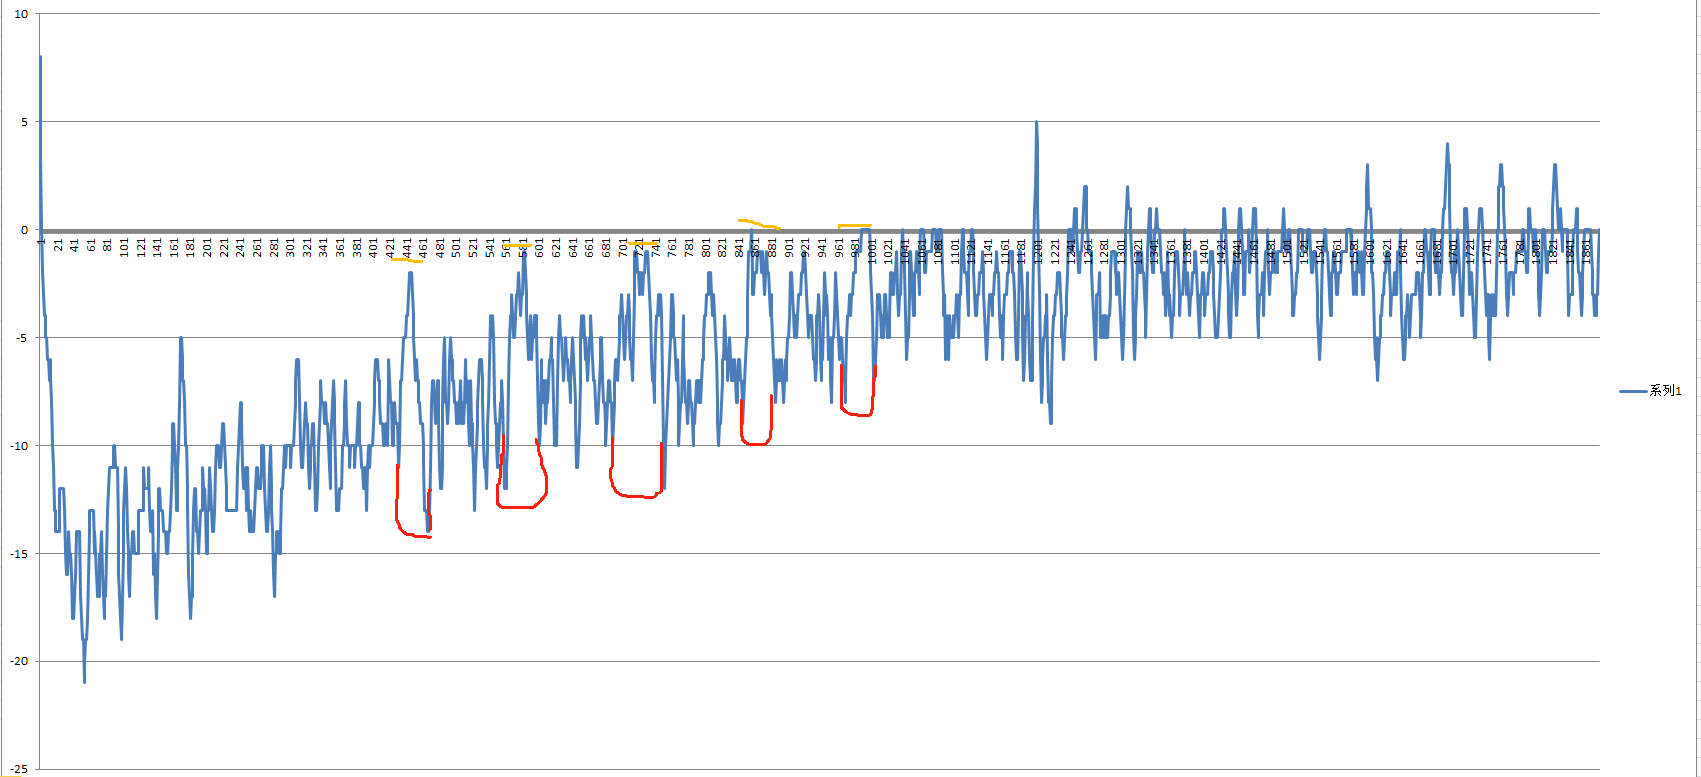
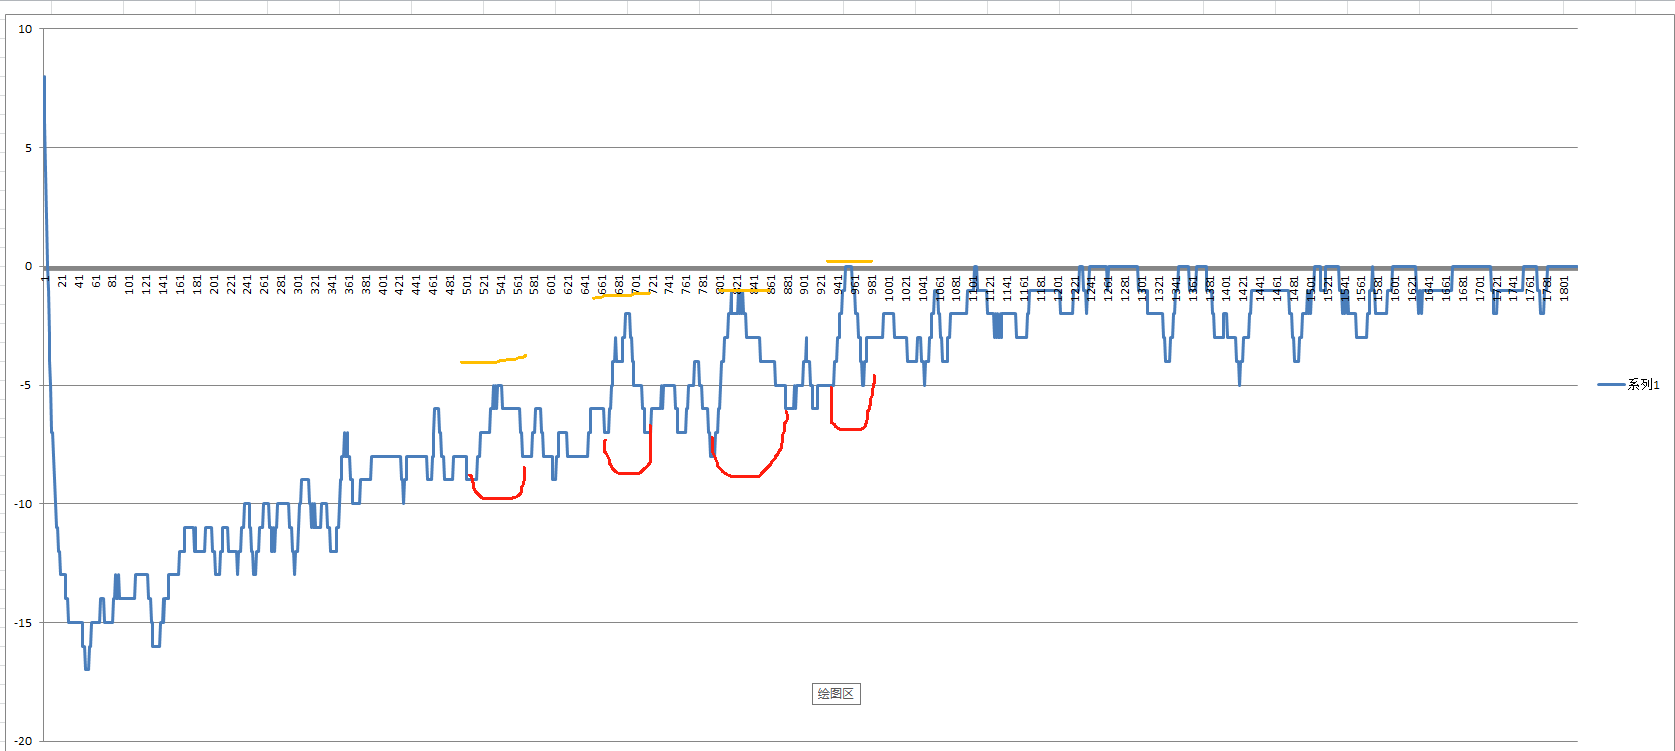
. While the old problem is solved, new problems arise. After using the "12-array method" to stabilize the data, we found many spikes, which significantly affected interpretation and analysis. We need to clean up these spikes.
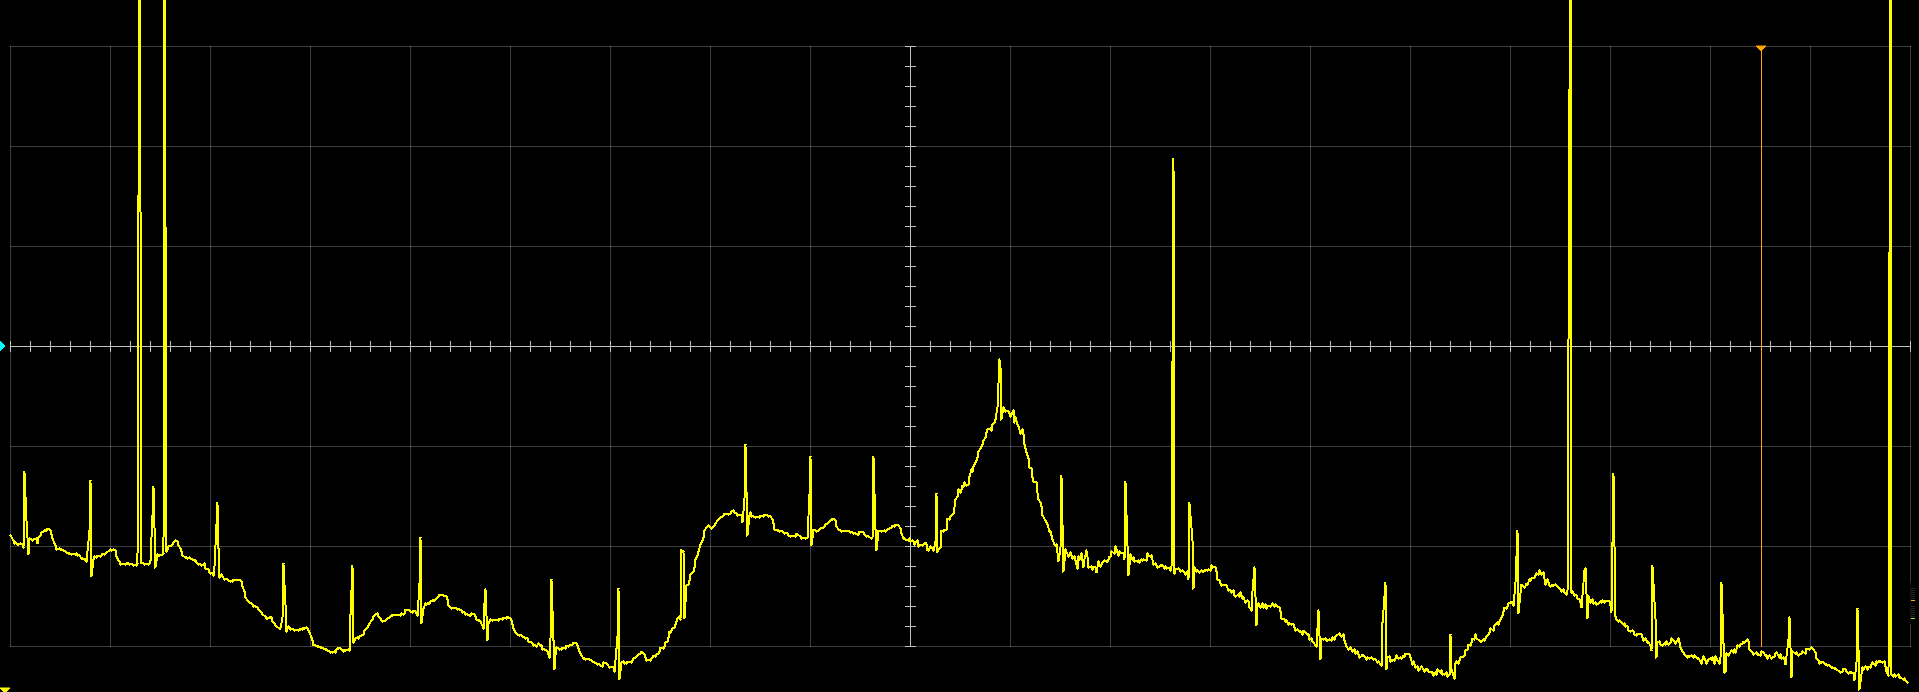
We found a particularly abrupt spike with a voltage of 8mV. Is it possible for the QRS voltage to exceed 8mV? In a normal person, this is unlikely, but situations are variable. We began searching for clues in pathological electrocardiograms. We directly searched for left ventricular hypertrophy.
The search results showed that the QRS voltage in the searched cases was around 3mV, with none exceeding 3.5mV. To be on the safe side, we defined signals exceeding 6mV as glitches and removed them
(the highest QRS voltage was ultimately found in a relative with heart failure and left ventricular dilation, with an R-wave voltage of 5mV).
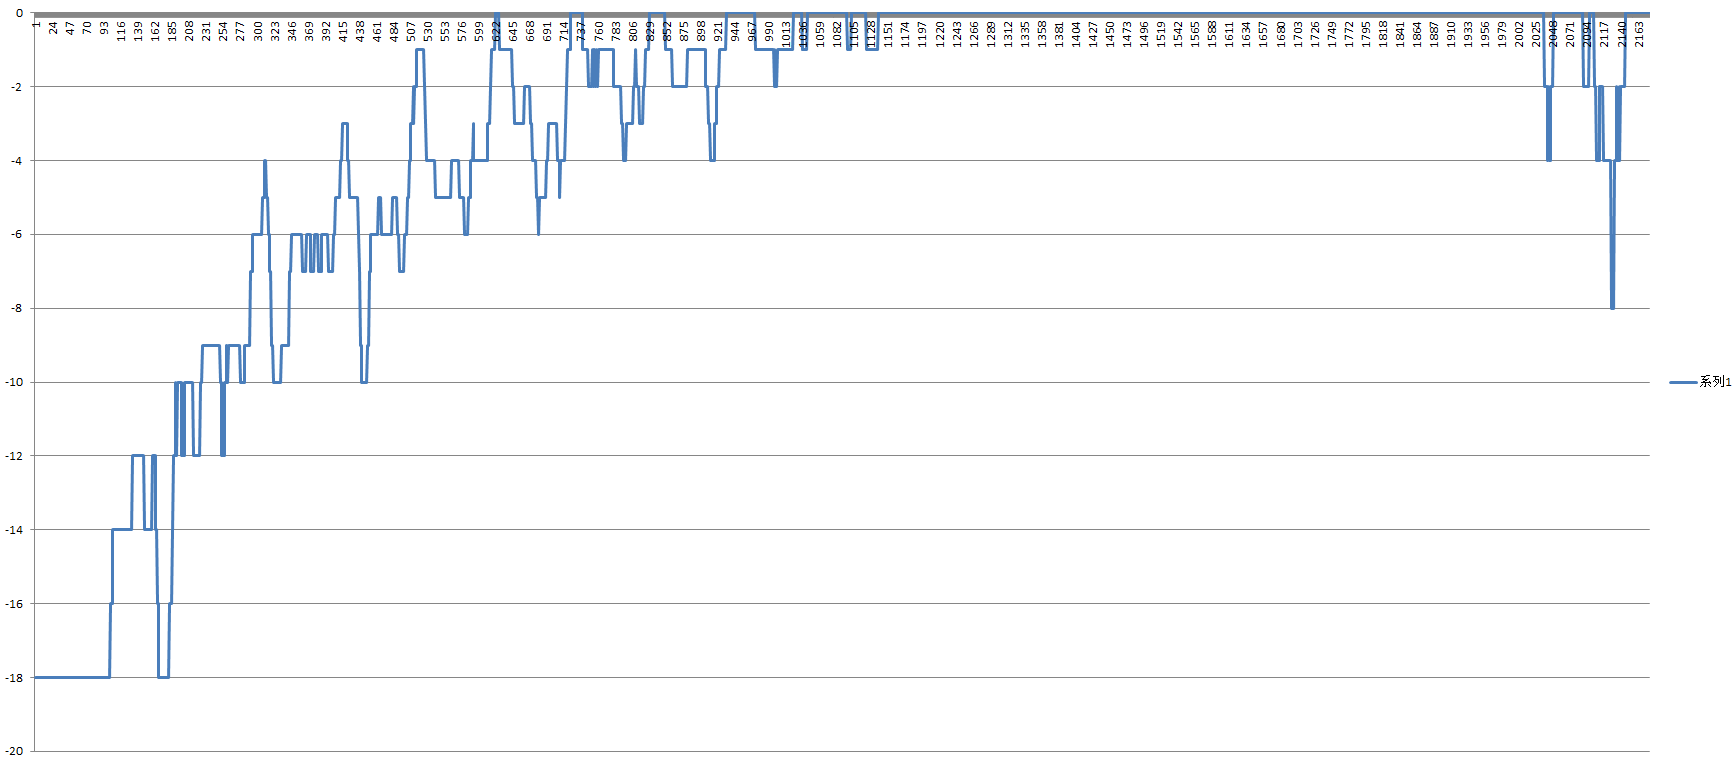
Now, we've said goodbye to large glitches; small glitches still require further effort in power supply analysis.
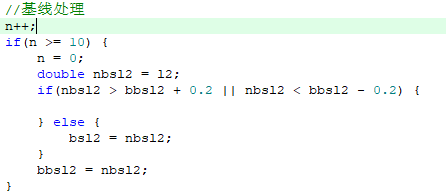
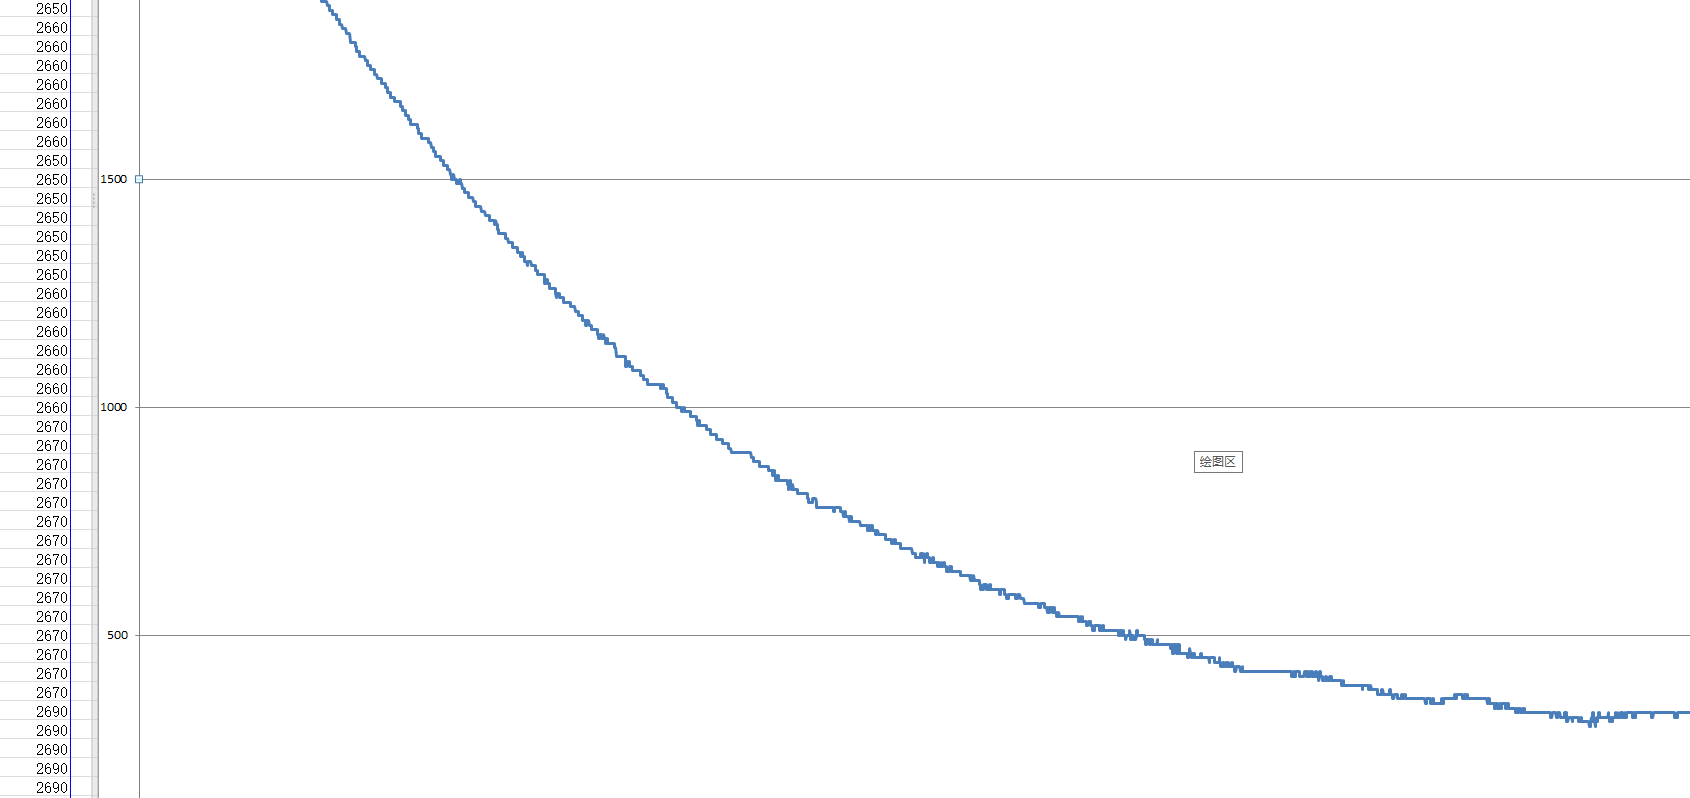
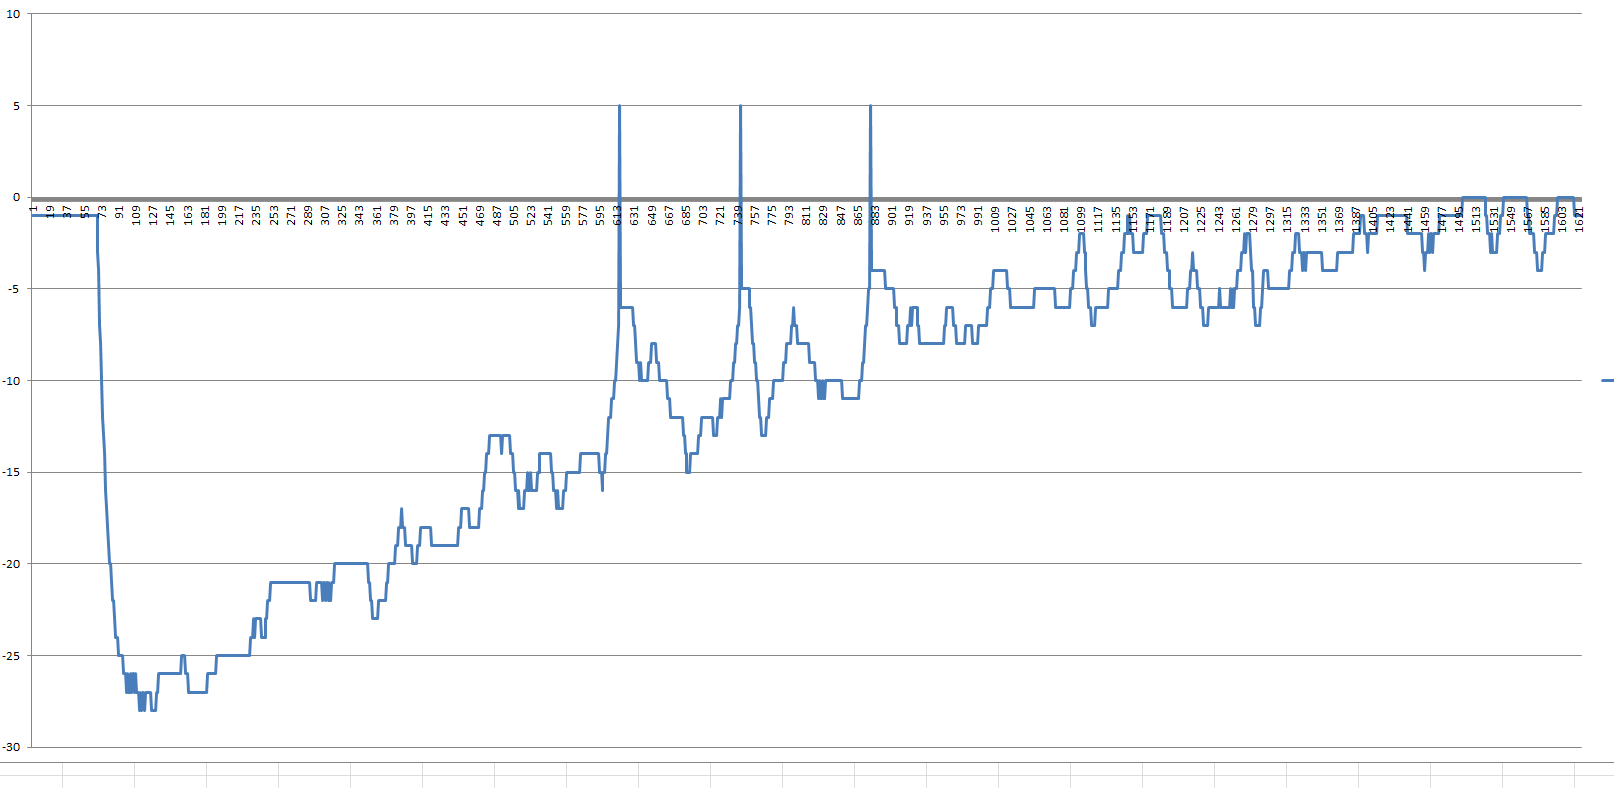
Next, we need to deal with the baseline, which looks like it's been "drunk" (i.e., tilted up and down). This is baseline drift.
How do we handle baseline drift? The key is to find the baseline signal. Then, subtracting the baseline signal from the original data will give us the corrected waveform.
To obtain the baseline signal, we need to remove the QRS wave, P wave, and T wave. The QRS wave is the easiest to remove; simply use the glitch removal code and classify the QRS wave as a glitch.
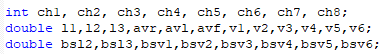
In the definition, leads I, aVR, aVL, and aVF are not defined because these leads are calculated by the algorithm and can be calculated later (bsxx, i.e., basexx, is the baseline variable).
The idea sounds good, but reality is harsh. Due to the high sampling rate, the QRS wave has a rise time, and the obtained baseline sample (purple) is almost identical to the original data (red). Solving this impasse is simple: we use sampling surveys before proceeding with the next step.
Thus, we obtain the sample after sampling surveys with the QRS wave removed. Although the sampling rate is extremely compressed, it is more than sufficient for baseline calculation.

I heard you're going to directly subtract this from the data? No! There are still unremoved P and T waves, and sometimes S waves are mixed in!
At this point, we introduce our median filter.

By subtracting the baseline data from the original data, we can obtain the baseline and final waveform.
Test subject 2:

*Related code has changed, the test graph does not reflect the final result.
Then, we can extrapolate the results to other limb leads.

3. NIBP Non-invasive Blood Pressure Data Processing
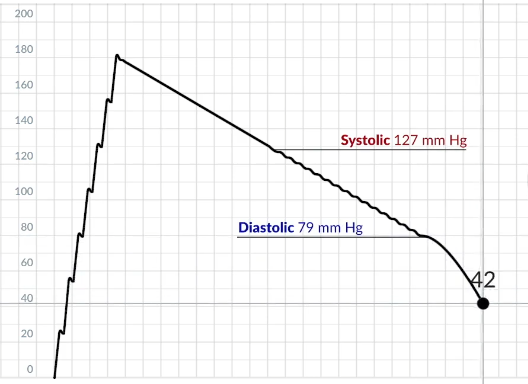
The principle of non-invasive blood pressure (NIBP, the same below) measurement is to inflate the cuff to a certain value above the highest blood pressure value and then slowly deflate it. The change in cuff pressure (or tubing pressure) during deflation is read and processed to obtain the NIBP value.
When the cuff is inflated above the systolic pressure, blood flow is blocked and no force is exerted on the cuff. During deflation, the cuff pressure drops to the systolic pressure, and blood flow resumes and fluctuates, exerting a force on the cuff, causing the pressure value inside the cuff to increase or remain temporarily unchanged. After deflation continues and the pressure drops below the diastolic pressure, a pressure difference is obtained. The pressure exerted by the cuff on the blood vessel is equal to the supporting force of the blood vessel, the resultant force is 0, no deformation occurs, and the pressure inside the cuff is no longer affected by the impact of blood flow, and the pressure value decreases normally.
The chart from https://www.bilibili.com/video/BV1JV4y167AJ shows the cuff pressure change under ideal conditions.
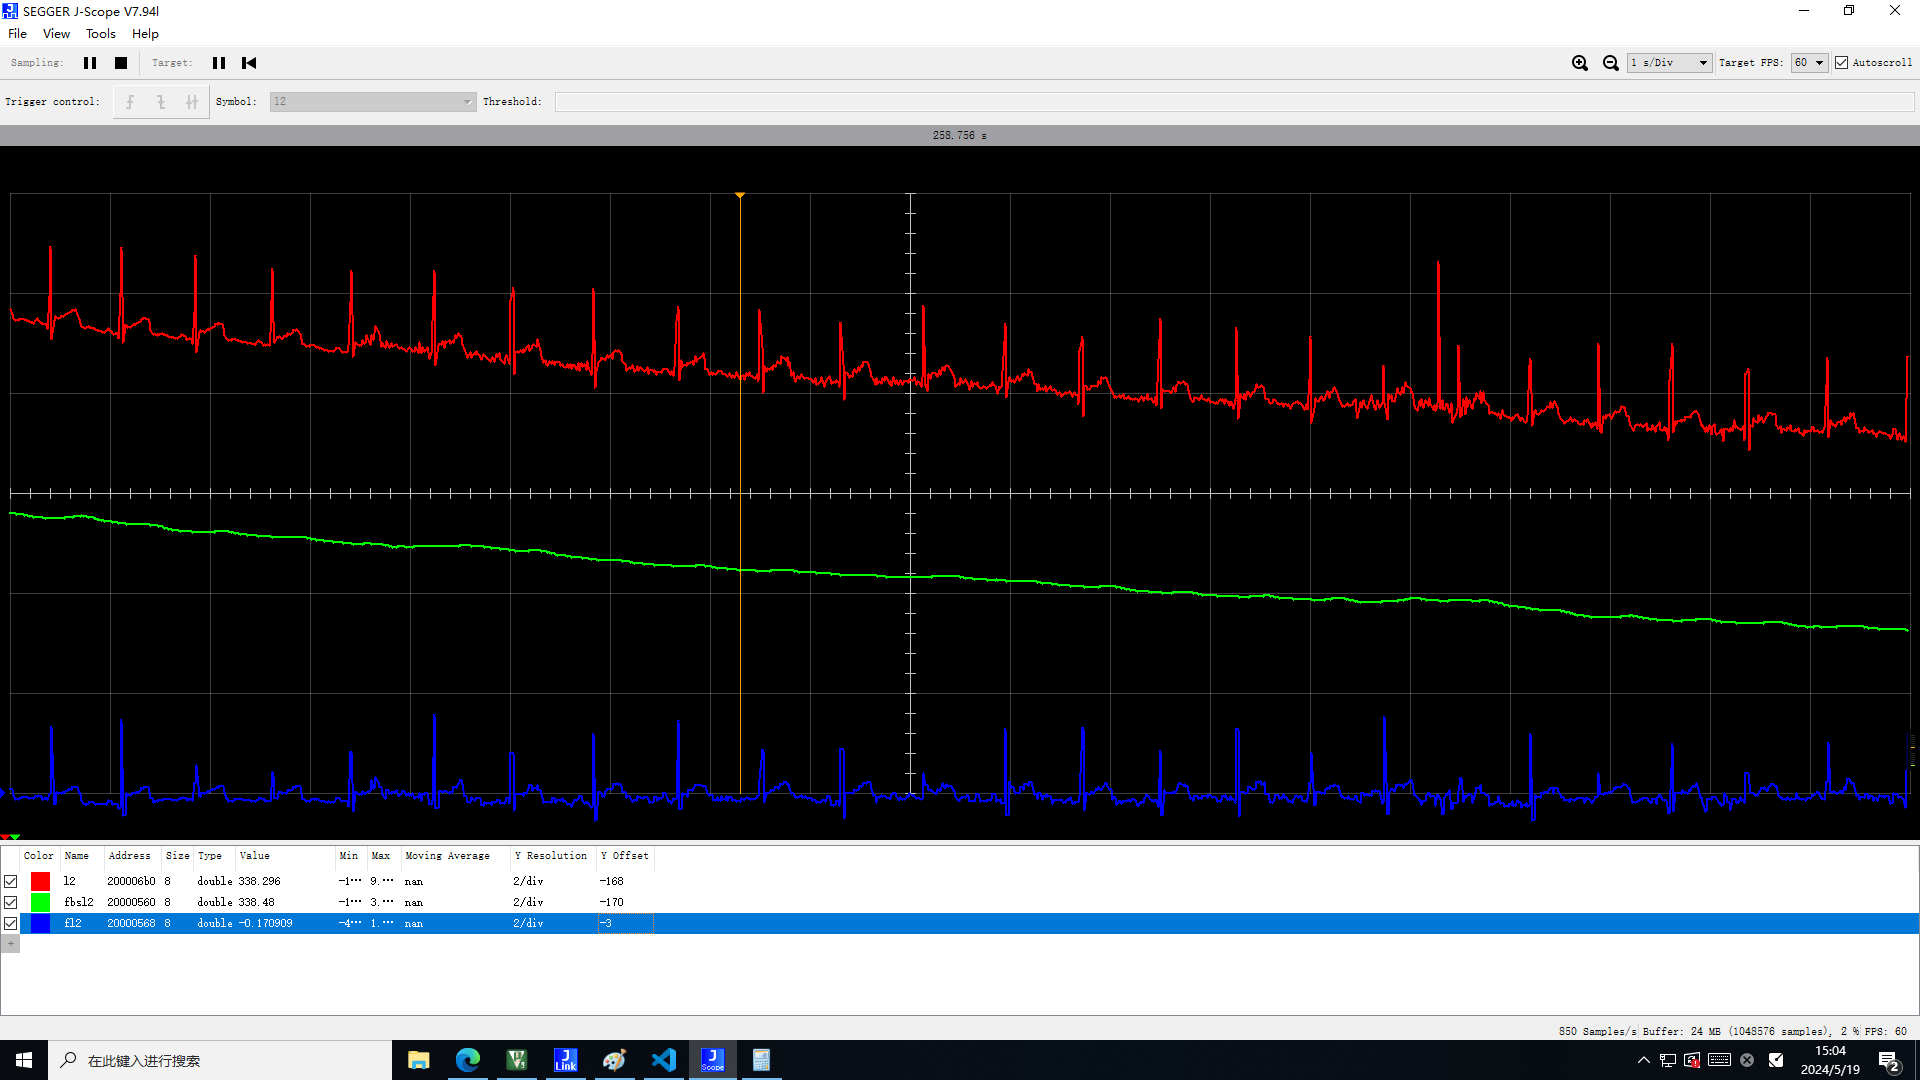
However, in reality, nothing is ideal. After preprocessing the *0.1kPa data, the readout waveform looks like this
:
The deflation portion
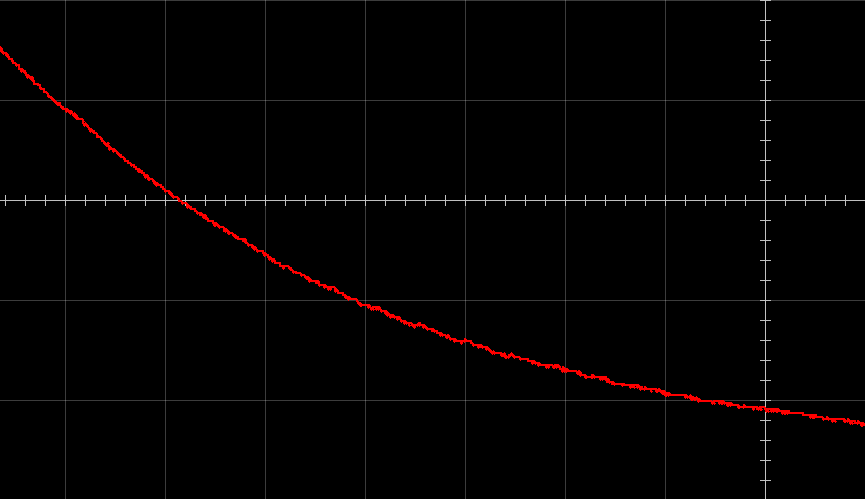
lost waveform details during the *0.75 conversion when converting to mmHg int values in the preprocessing. Therefore, we unexpectedly read a strange NIBP value of (87/45) on this distorted waveform.
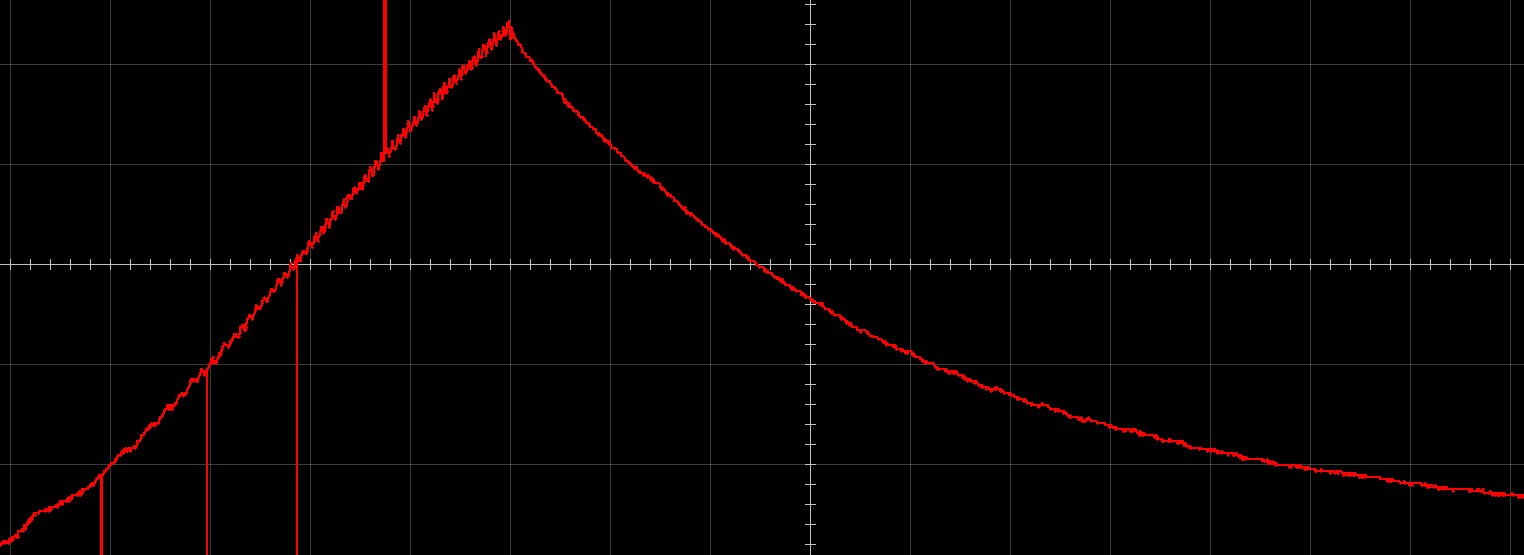
Replacing int with float yields the following graph
. You probably don't know where the information lies, so let us point it out:

We can find four heartbeat points, but the yellow-marked heartbeats are too faint, and the microcontroller may not be able to recognize them properly. We believe there are three valid points
. Next, we need to make the microcontroller recognize these heartbeat points. Directly letting the microcontroller process them is impossible because there are flat straight segments before and after, and we cannot calibrate the threshold. Due to the special nature of data reading, even one incorrect reading will cause a large error in the obtained data.
Following Professor Tang's guidance on the electronic blood pressure monitor circuit in the electronics design competition, a 0.3~3.5 bandpass filter was used. However, in practice, it was found that a higher frequency
bandpass filter was needed. After filtering, extraction, and further filtering, the data obtained could easily identify five pulse points, but still contained a lot of noise, which could not meet the processing requirements of the microcontroller, which still could not understand it. Furthermore, the large vertical line on the left needed to be masked during later summarization, which could be achieved using a thresholding method.
By using median filtering at intervals, the graph was slightly optimized, making it look less cluttered. The microcontroller was then no longer challenged, and the real-time part ended there; after sampling, unified processing was performed.
By squaring to reduce noise components, the pulse could be determined using the falling branch thresholding method and interference value elimination.
The image shows the extracted pulse points (before exclusion). You can see the diabetic wave and the invalid wave that is too far away. The pulse points

are then processed using both the interval method and the direct method, and the number of valid points is compared. The one with more valid points wins.
The principle of the interval method is as follows:
Existing data: NNNNNNN (also the direct method algorithm)
First processing: NNNNN N (then try to calculate)
Second processing: NNNN NN (then try to calculate)
Third processing: NNN NNN (then try to calculate)
Fourth processing: NN NNNN (then try to calculate)
Fifth processing: N NNNNN (then try to calculate)
There is no sixth processing! Otherwise, the interval values cannot be compared!
The data obtained after excluding interference is shown in the image. You can see that the value of the original data and the interference values between two valid data points are filtered out.
Second experiment:

Then the corresponding systolic blood pressure appears first, followed by the corresponding diastolic blood pressure, and that's it!

I've developed high blood pressure from working late into the night to finish this project for you all! We all need to get some sleep!
4. Respiratory Wave Data Analysis
Because the experimental data was lost,
we'll temporarily use a drawing to represent it. First, we need to read the respiratory waveform. We used a 0.1 - 4 Hz low-pass filter and a median filter to process it and obtain a preliminary waveform ,
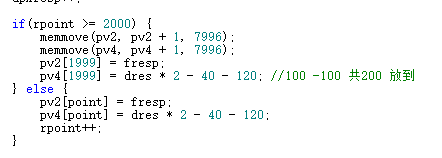
which we then stored in an array. To ensure the real-time nature of the analysis and snapshot, we used a left shift of the array and appending the data at the end.
We used the memmove method to move the data safely and quickly.
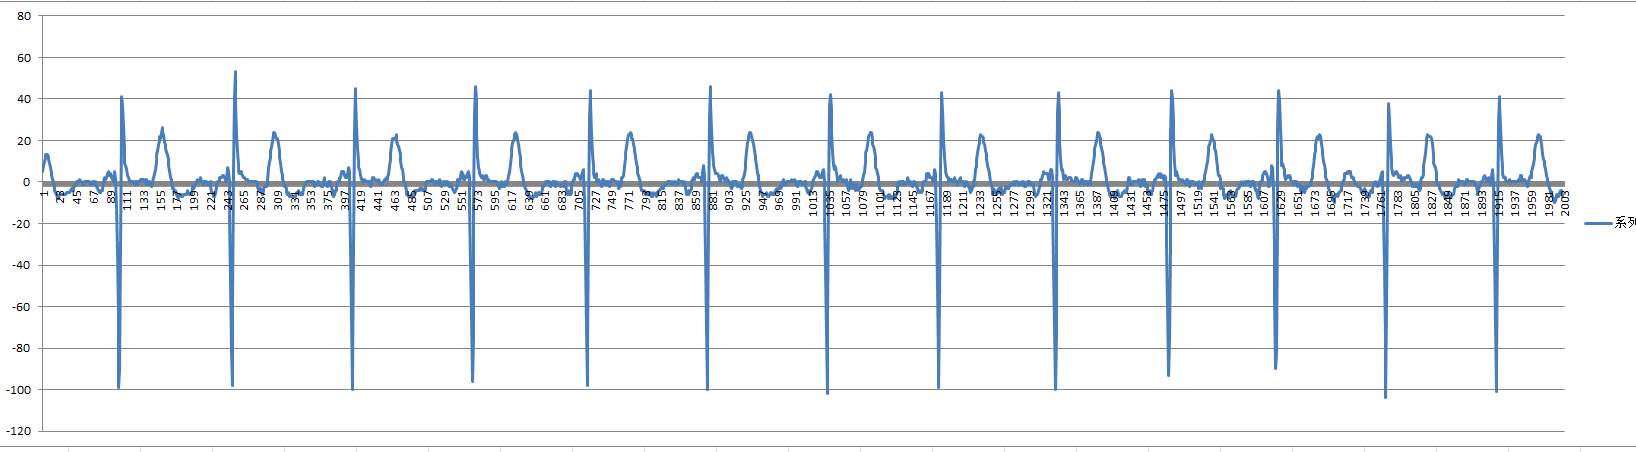
This is the original respiratory waveform that was read and loaded into the buffer array, but there are still many glitches. Although they don't affect the display, they are fatal for data processing.

So we applied a bandpass filter (0.2 ~ 4 Hz) and a wide-window median filter to smooth the waveform.
Finally, we performed falling edge detection. During the experiment, we found that there were always duplicate values of 1, which we corrected
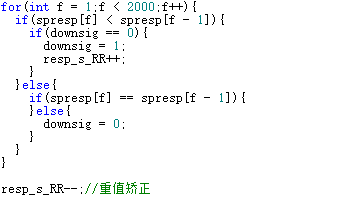
. Finally, we multiplied the number of respiratory waves identified by three. Because the sampling rate is once every 10ms, the input array size is 2000, containing 20s of data. Multiplying by three yields 60s of data.
5. Multi-lead ECG joint analysis algorithm:
This is a challenging task and a challenge faced by the development of various digital ECG machines. The first step in
R-wave recognition
processing is to weaken p, T, and other wavelets through Pan-Tompkins algorithm filtering and squaring operations to increase the slope of the R-wave.
Result 1:

Result 2:
Then, the index of the R-wave can be extracted through slope recognition. In the case of low voltage, if no waveform is detected, the threshold is lowered to continue detection.
However, as shown in Result 1, there is some interference in the data processed by Lead II, so Lead III needs to be introduced for double verification to obtain clean data.
Then, the index is used to calculate the RR interval and heart rate based on the sampling rate,
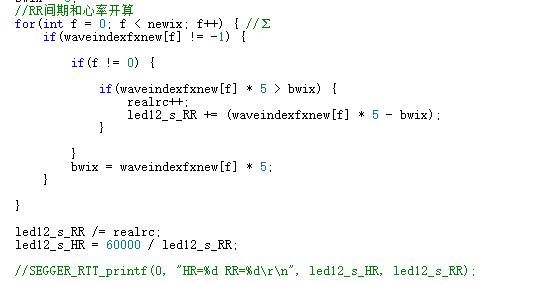
followed by the calculation of QRS and QT data.
To find the QRS origin
, the R wave we found using the above algorithm may be longer than the R wave or between Q and R. We need to further search to the left for the QRS origin.
For finding the origin, we need to consider multiple cases.
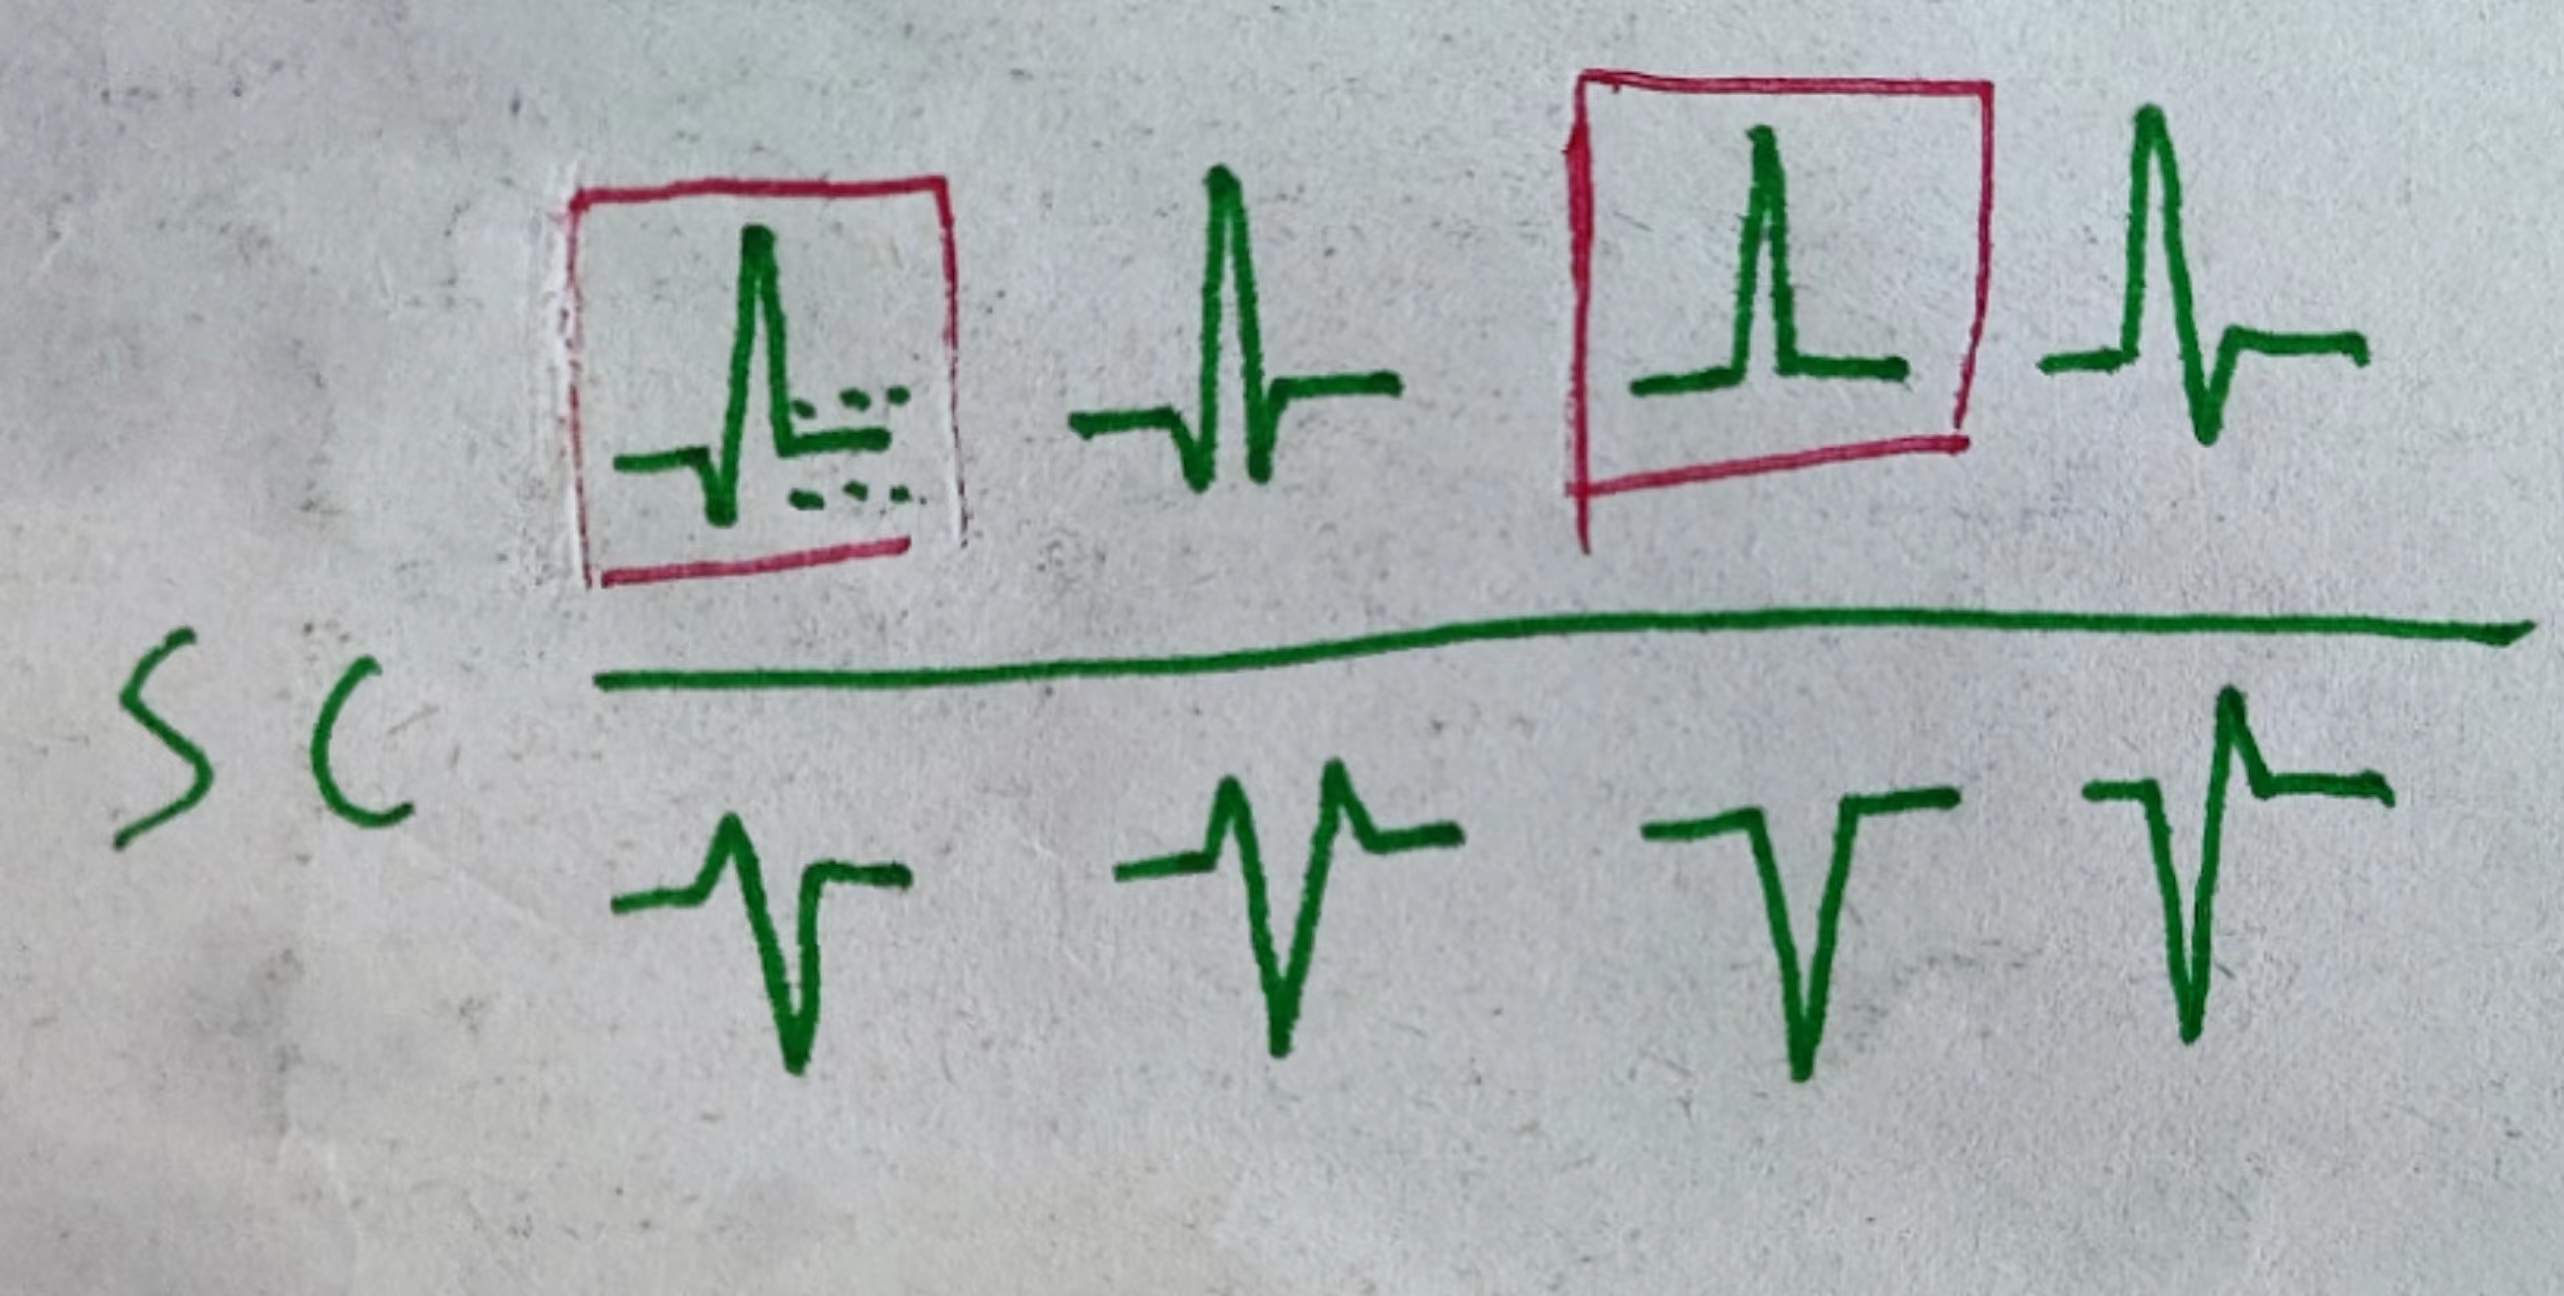
These are possible cases, and some cases can be merged (positive and negative waves of the same type can be merged, and cases based on the Q wave can be merged).
We summarize the following cases:
1. No Q wave, directly flat;
2. With Q wave, i.e., there is a turning point.
For the first case, we set a value below 4 units as flat (don't be fooled by the large number, the whole graph is actually very large). We stop searching when a flat value is encountered and define its corresponding index value as the origin. For the second case
, there is a turning point; a change in the slope sign is considered a turning point. We set the number of turns to no more than three (to counteract interference), and the difference between the previous and next operation indexes must not be less than 3; otherwise, the search stops immediately, and the corresponding index value is defined as the starting point
. While searching for the starting point, the value of the first two units of the starting point index is defined as zero potential (the average value is taken), and then we proceed to the next step: calculating the electrocardiographic axis.
The QRS axis
, also known as the average electrical axis, is the average direction (vector) of cardiac electrical activity and is one of the indicators in an electrocardiogram (ECG). It refers to the angle formed by the maximum combined vector of the frontal plane during cardiac depolarization and repolarization and the horizontal axis.
We have already recorded the QRS waves. To enable the machine to recognize the electrocardiographic axis, we must derive the calculation method

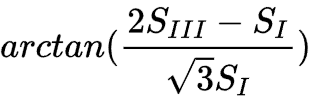
. Medical students who have studied ECG are certainly very familiar with this diagram, which uses the algebraic sum of leads I and III for calculation. However, this method is relatively complex for machines. We adopt another method: the area integration method.
Some professors have probably mentioned this to you, but it has been abandoned due to the cumbersome manual calculation. However, the area integration method is the most standard method for measuring the electrocardiographic axis and also the simplest method for machine calculation.
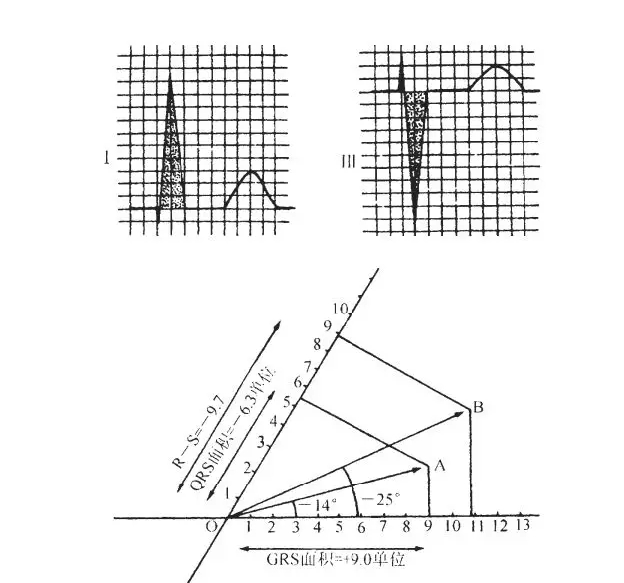
This diagram shows the difference between the amplitude method and the area method. The area integration method plots the algebraic sum of the areas of leads I and III relative to the isoelectric line in the positive and negative directions on a special coordinate system, where the angle between -III and +I is 60 degrees.
There are four cases in the calculation:
SI
> 0 (left axis deviation),
SI > 0 SIII,
SI > 0 SIII > 0 (no axis deviation).
We select two representative cases to perform geometric reasoning
and draw diagrams for reference: Desmos Geometry - ECG Axis Calculation trdrfbhqzv
Red line: SI SIII Black line: Reverse extension line Green line: Intersection point and line connecting the center of the electrocouple.
Define point I as A and point III as B.
Case A: No axis deviation
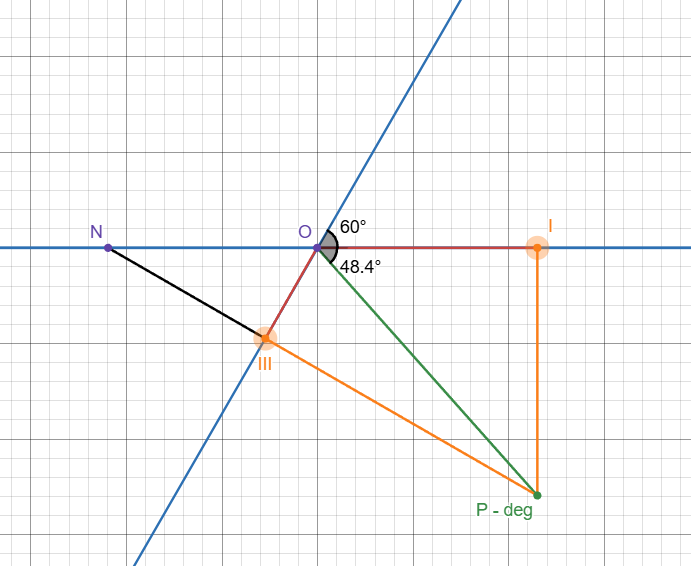
. Extend PIII to intersect line IO and point N.
∵PB⊥OB, ∠NOB = ∠ = 60° deg
∴∠ONB = 30°
deg Also ∵∠NBO = 90° deg
∴NO = 2SIII
∴NA = 2SIII+SI
∵∠NAP = 90° deg, ∠ONB = 30° deg
∴PA =

∵∠NAP = 90° Therefore
, the electrocardiographic axis =

Case B: The electrocardiographic axis is deflected to the left, and the

extended BP intersects the branch I and point N.
Since ∠BON = 60°, ∠OBN = 90°,
∠BNO = 30°
. Therefore, in △NBN, ON = 2SIII.
In △PAN, PA = NA/√3.
Since NA = ON - OA = 2SIII-SI
, PA = ∠PAO

. Therefore, in Rt△PAO, ∠PAO = 90°
.
For the other two possible cases, we can take the opposite of the sum of the two areas and transform them into the above two cases based on the mathematical thinking that vertical angles are equal. Isn't that interesting?
The corresponding calculations are as follows:

T-wave search and QTc calculation.
The T-wave belongs to wavelet components with a relatively small slope. We use a new filter to extract the T-wave. We use a bandpass filter (8 ~ 22.5Hz), which makes the p and T components more obvious.
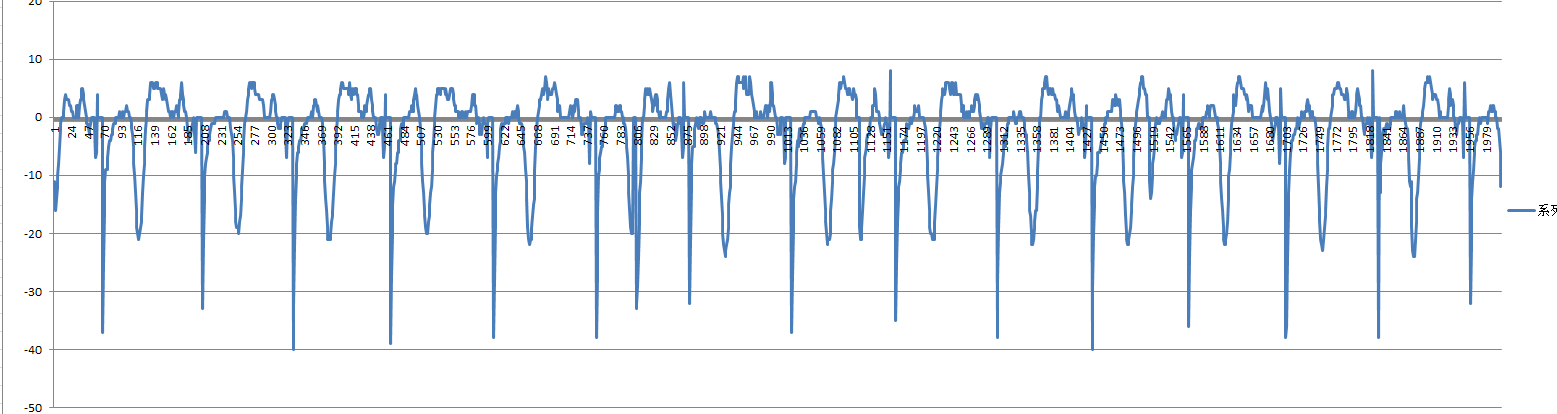
Next, we remove index numbers less than 100 and greater than 1800 to prevent the search from exceeding the limit.

Then, we calculate the maximum QT interval (QTc is set at 550ms; anything higher would result in torsional tachycardia).

Then, we skip the QRS complex and search for the maximum and minimum values of the longest QT interval, which correspond to the T-wave endpoint (for the data processed by this filter).

Then, we calculate the average to get the QT interval.
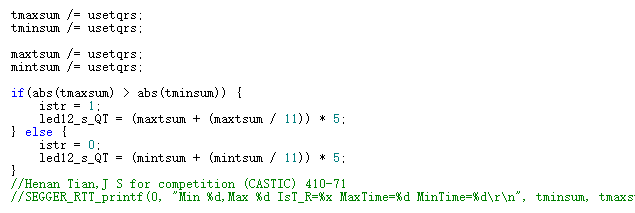
Then, we calculate the QTc using the QTc correction formula. Finally, we use QT-QRS to calculate the T-wave duration

and analyze the R/S wave voltage in the chest leads.
RV5+SV1 and RV1+SV5 are important tools in ECG analysis. This system can analyze the voltage levels of the left and right ventricles, providing guidance for the diagnosis of myocardial infarction, hypertensive heart disease, ventricular dilatation, ventricular hypertrophy, and pulmonary hypertension.
First, calculate the equipotential value two units to the left of the QRS endpoint

and average it. Then, calculate the maximum and minimum values relative to the
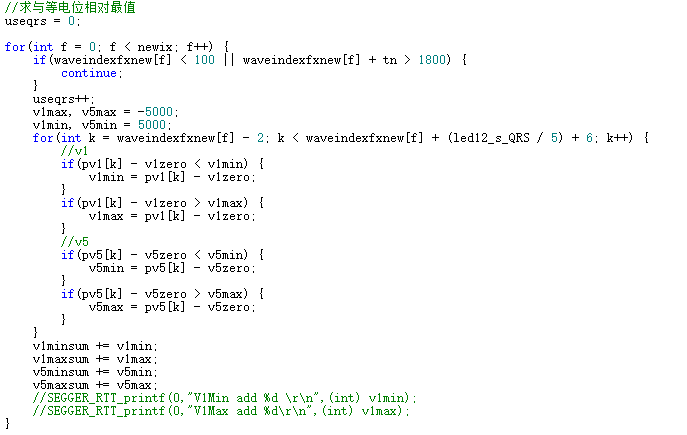
equipotential value. Finally, calculate the average voltage value and take the absolute value. Convert the recorded values (units) to voltage values (mV)
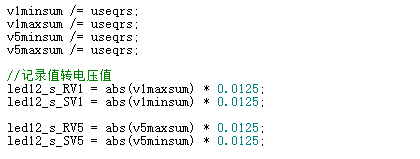
to complete the calculation .
Software Description:
Due to the extremely limited on-chip resources of the microcontroller, we abandoned the resource-intensive FreeRTOS and LVGL, and used a bare-metal + LCD drawing library to complete the design.
Since our application design involves switching between two apps and multiple interfaces, we used the method of substituting the return values of the apps or interfaces into the decision-making process to achieve switching.
Thus, only a string of characteristic code needs to be returned in the app function, and the manager can switch to the specified app or interface.
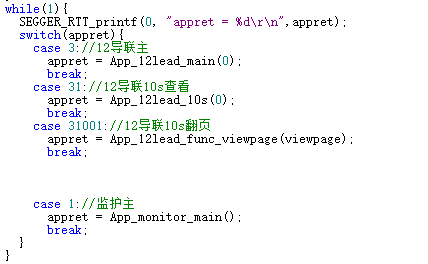
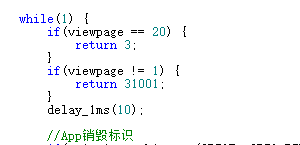
We use a rotary switch as the app switching mechanism. We destroy the current app switching by reading the switch and accumulating a flag.
When an inconsistency is detected between apps, the accumulated flag is activated, destroyed, and switched after reaching a certain value, with the flag returning to zero. If the gear switch returns to the current App, the identifier resets to

zero. In complex systems like this, mechanical buttons cannot afford to make any mistakes. For mechanical buttons, we use the button function decision function in the interrupt call manager to determine the function based on the App and page identifiers.

Of course, an identifier needs to be set when the App or page is invoked
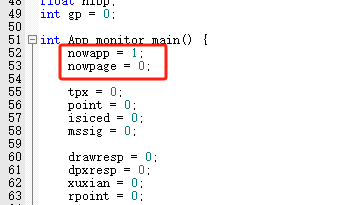
so that the entire scheduling system can operate smoothly and maintain long-term stability. Moreover, the bare metal interface significantly improves system stability compared to RTOS, preserving more resources.
Basic operation tutorial:
Standard operation, beginners must read this (for quick mastery, please see the instrument operation tutorial)!
Monitor setup: ECG monitor practical demonstration - BV1gM411o7HB
ECG monitoring theory: ECG monitoring theory explanation - BV1bG411S7yD
Special reminder: Before setup, check the electrode pads for dirt, the conductive gel for integrity, and any unintentional deformation. If any quality issues are found, discard immediately and replace with new electrode pads. Pulse oxygen probe: Press and hold the gray head to push in, then press and hold the gray head to pull out.
Monitor disassembly precautions: Remove the blood pressure cuff, pulse oxygen saturation probe, ECG monitoring lead snaps, and ECG electrode pads in sequence. Check the pad areas for any abnormalities. If no abnormalities are found, clean with 75% alcohol; if inflammation or allergies are present, clean with calamine lotion. If ulceration or oozing occurs, please seek immediate treatment at a dermatology clinic.
12-Lead ECG Examination: ECG Examination Operation - BV1LG4y1S7PT
12-Lead ECG Practical Video: ECG Practical Operation - BV1BV411Y7Ki
Special Reminder: Do not waste alcohol swabs. As long as they don't dry out and the stains aren't severe, they can be reused. You can turn the swab over. When attaching the clips, avoid hairy areas; the inner side of the limb is preferable. Our machine requires only pressing the "ten-second" button.
Instrument Operation Tutorial:
This tutorial emphasizes basic operations, introduces experience and machine operation, allowing for faster machine familiarization. A must-see for beginners!
ECG Monitoring Theory: ECG Monitor Standard Operation Theory - BV1LveAejEWL
Monitor Operation Video: Monitor Operation - BV1wZeHeVEPL
12-Lead ECG Operation Video: 12-Lead ECG Operation - BV1uYebeCEi8
FAQ
Q: Is your publicly released code obfuscating filter parameters a form of defensive open source?
A: This project is a competition project, and it might be used by malicious individuals to participate in other competitions or submit as a graduation project, disrupting the competition order or the graduation project. We are preventing these malicious individuals from doing so. Also, I have already informed you that the filter parameters are obfuscated. By consulting literature and conducting thorough research, the parameters can be supplemented; it only requires a few numbers and not much operation, and can even surpass the current accuracy. For genuine replication, please choose to burn the AXF file, as the AXF file contains normal parameters. The complete, unobfuscated code will be released at the end of the year along with the next version.
Q: Why can't we install the casing during replication?
A: 3D printing and welding can cause tolerances. If you cannot align the holes, please use a knife to cut off the obstructing parts. If the parts cannot be installed, check if there are any external objects blocking the way, and whether the installation order and method are correct.
Q: How do I burn the code?
A: A normal person wouldn't ask this question. Use SEGGER-J-Flash; you can find the answer online.
Q: Why is the color display abnormal?
A: Currently, this is a CLut issue that I cannot resolve. Try powering it off and on again.
Q: How do I turn it on?
A: It's mentioned in the video, short press to power on, double press to power off.
Q: Do you have the code? Do you have the files? Do you have the casing files?
A: Please see the attachment.
Q: Can you sell the whole device?
A: I'll sell it to you after I get the utility model patent certificate, medical device registration certificate, medical device production license, and medical device business license (the three medical device certificates).
Q: Is this hype? /Studying journalism/When will you sell the course? (A common question from someone with a brainless syndrome on Douyin)
A: The complete casing, code, and compilation files are all here. My personally edited explanation of the data processing logic is also here, so please don't blindly criticize here! My whole family was very unhappy after learning that we were being criticized. People who ask these things are simply heartless. I suggest a joint consultation between psychiatrists and neurosurgeons.
Q: Which interface of the lead cable and pulse oximeter clip should I choose?
A: 5-lead 6-pin monitoring lead cable, D-Sub 15-pin 12-lead lead cable, 5-pin (AC type) pulse oximeter clip, see the interface on the side of the display picture.
Q: Why can't I burn the program/RAM is overflowing?
Q: Please use GD32F470ZIT6 instead of ZGT6, and Keil settings also need to be changed.


 京公网安备 11010802033920号

 TD1D15MPM-C