Let's first quickly understand the instrument's functions. Compared to counting instruments like Geiger counters, digital multichannel counters can distinguish nuclear radiation energy, enabling nuclide identification and content calculation!
The first part of the abstract covers the following development areas: 1. Fundamental theory of radiation detection; 2. ZYNQ; 3. FPGA-Verilog; 4. Vitis embedded C; 5. Qt5 C++ host computer; 6. LVGL embedded interface; 7. MATLAB algorithm simulation.
If you don't want to read the article, please watch the attached video (Video 3) explaining the instrument's principles. Due to the extensive theoretical knowledge involved, the article may be somewhat dry; please understand.
1. Instrument Principles
With the rapid economic and social development of China in recent years, nuclear radiation measurement technology is playing a crucial role in many fields. These include nuclear analysis techniques applied in chemistry, physics, and biology; nuclear logging techniques used in geophysical exploration to study drilling geological profiles and locate oil and gas deposits; and radiation detection technologies applied in various fields such as medicine, environment, nuclear energy, and national defense. In these applications, the amplitude of the nuclear pulse is fundamental to the extraction and analysis of information, and the multi-channel pulse amplitude analyzer (MCA) plays a crucial role in the extraction and analysis of nuclear pulse amplitude, serving as a key electronic device in radiation measurement. Its principle involves dividing the pulse amplitude range into multiple equal amplitude intervals, the number of which corresponds to the number of channels. By converting the analog pulse signal into a digital quantity corresponding to its amplitude, pulses falling within each amplitude interval are counted separately. After a period of accumulation, the distribution curve of the pulse amplitude output by the detector can be obtained, which is the energy spectrum curve.
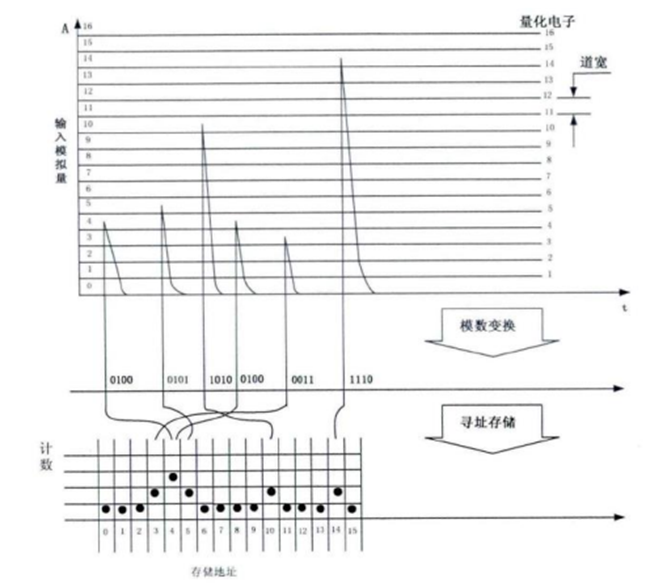
Figure 1-1 illustrates the basic principle of digital multichannel hardware.
1.1 Overall Structure and Basic Principle of Digital Multichannel
Before the advent of digital measurement technology, multichannel pulse amplitude analyzers mainly consisted of a series of analog circuits. After passing through circuits such as pole-zero cancellation, signal amplification, filtering and shaping, baseline recovery, accumulation rejection, and peak holding, the signal was digitized by an ADC, and the amplitude spectrum was shaped by a microcontroller. However, due to the differences between analog devices and their susceptibility to environmental influences, they are no longer suitable for high-precision, high-count-rate measurements. With the development of general-purpose programmable logic devices and high-speed ADCs in recent years, digital measurement technology has been widely applied, and digital multichannel pulse amplitude analyzers have matured. The main principle is to perform simple signal conditioning (pole-zero cancellation, amplitude amplification, etc.) on the detector preamplifier, followed by digital acquisition by a high-speed ADC. The digital algorithms, such as filtering and shaping, baseline recovery, stacking rejection, and peak extraction, are then executed in programmable logic devices like FPGAs. These changes bring many advantages to digital pulse amplitude analyzers:
good measurement stability, with digital algorithms almost unaffected by environmental factors and time variations;
superior measurement performance, greatly reducing the inherent time of the circuit when processing pulses; significantly improved processing speed and anti-interference capability of digital algorithms for nuclear pulses;
smaller size and lower power consumption, with a significant reduction in overall power consumption due to the reduction of numerous analog components.
Digital multichannel digitizes the numerous analog signal conditioning circuits in the analog multichannel front-end, eliminating spectrometer performance variations caused by environmental factors and component differences. Digital multichannel uses high-speed ADC sampling, directly acquiring the simply processed nuclear pulse signal into the FPGA for digital filtering and shaping, greatly simplifying circuit design and improving spectrometer stability and performance.

Figure 1-2 shows the basic logic framework of a digital multichannel hardware.
It is a typical composition of a digital multichannel pulse amplitude analyzer, mainly consisting of a detector, signal conditioning circuit, digital signal processing system, and measurement and control system. The functions of each part are as follows:
Signal Conditioning: Primarily an amplifier. The pulse amplitude output from the preamplifier circuit is often in the mV range and needs to be amplified to the range required by subsequent circuits by the main amplifier. It also includes a pole-zero cancellation circuit, which is responsible for reducing pulse width and reducing accumulation;
High-Speed ADC: Samples the core pulse signal and digitizes it;
Filtering and Shaping Algorithm: The amplitude of the core pulse signal is not easily extracted. The peak value is broadened and the trajectory defect is compensated by the filtering and shaping algorithm, which also acts as a low-pass filter. Commonly used filtering and shaping algorithms include trapezoidal shaping and Gaussian shaping;
Baseline Recovery: The core pulse signal is usually coupled to a DC signal, so the extracted amplitude is superimposed with the DC signal. The true amplitude of the pulse is recovered by extracting the pulse baseline;
Accumulation Discard: When the core pulse signal accumulates, the waveform after filtering and shaping becomes unusable. The system identifies pulse overlap through logical judgment based on certain conditions to prevent the acquisition of erroneous amplitude information;
peak extraction: extracts the true amplitude information of the filtered and shaped signal;
energy spectrum shaping: the amplitude of the true peak is used as the channel address, and the value of the corresponding channel address is incremented by one;
control terminal: usually a microcontroller is used as the main control and interaction chip of the instrument to control the entire measurement task and interact with the host computer.
After the above steps, the resulting energy spectrum stores the total value of the amplitude accumulated by each channel address during the measurement period. Since the energy of nuclear radiation is ultimately proportional to the energy spectrum channel address, the relationship between channel address and energy can be obtained simply by calibrating the instrument with energy.
Note: There are many technical terms mentioned above. Please don't worry if you don't understand them. I don't intend to explain them in the text, as it would seriously disrupt the flow of the article. You will understand them as you read on.
1.2 Basic Principles of NaI(Tl) Scintillator Detectors
Gamma rays cannot be directly detected by electronic detectors (uncharged radiation). In matter, gamma rays lose energy through interactions with the matter via the photoelectric effect, Compton scattering, and electron-electron pair effect (the basic principles are explained in the video). This lost energy is converted into an electrical signal within the detector, which is then captured by the detection system. When certain substances are excited, the photons emitted by the de-excitation of atoms are called scintillation. Detectors based on this phenomenon are called scintillator detectors. Scintillator detectors have the characteristics of high detection efficiency, short decay time, and large photoelectric cross-section. They can be used not only to measure the intensity of nuclear radiation but also to obtain the energy and distribution of incident rays.
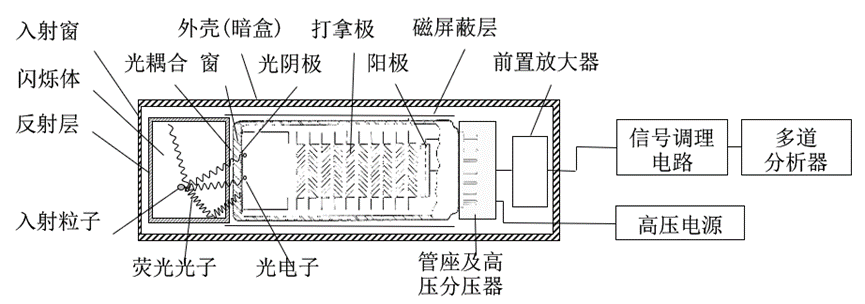
Figure 1-3 shows a schematic diagram of a scintillator detector probe
, which mainly includes the following components:
Scintillator: absorbs incident gamma-ray energy and generates photons;
Optical coupling: reduces reflection and loss of photons during transmission, allowing them to reach the photocathode smoothly;
Photocathode: absorbs photons and emits photoelectrons;
Dinterpolar electrodes: each dinterpolar electrode is connected to a high-voltage power supply via voltage-dividing resistors, forming a high-voltage incrementing arrangement. Photoelectrons are gradually accelerated in these electric fields, colliding with the dinterpolar electrodes to generate more electrons, multiplying step by step;
High-voltage divider: multiple resistors are connected in series between the input high voltage and ground to divide the voltage, with each stage decreasing to supply the dinterpolar electrodes.
After the gamma rays enter the scintillator and undergo the above process, a charge pulse is generated at the output of the photomultiplier tube. This pulse is a negative pulse. The pulse enters the charge-sensitive preamplifier, where the charge is integrated and converted into a voltage pulse signal, which is then input to the subsequent circuit for further processing.
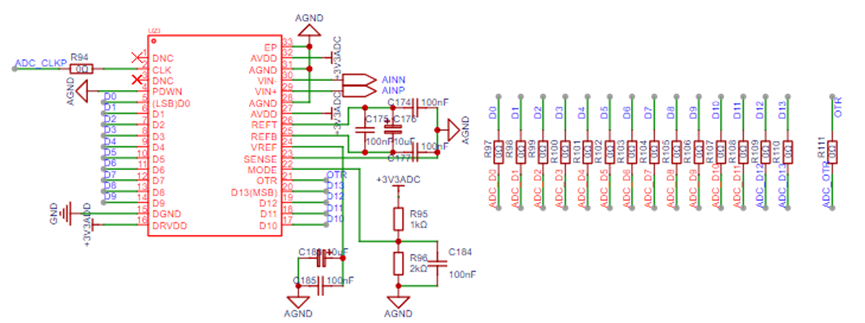
Note: The main design content of this paper is a digital multichannel pulse amplitude analyzer, using a purchased finished scintillator detector (manufacturer such as Hamamatsu). It includes a scintillator, photomultiplier tube, high-voltage power supply, and preamplifier. Therefore, the detector fabrication process is not discussed in this paper! However, in the schematic/PCB, I designed a positive high voltage +1kV power supply and a charge-sensitive preamplifier. The high voltage has been verified to be usable, but the preamplifier has not been verified. Here, I present two commonly used design schemes for the photomultiplier tube voltage divider resistor network (used in conjunction with positive and negative high voltage power supplies), as shown in the figure:

1.3 Qualitative Analysis and Basic Processing Methods of Energy Spectrum Data
To help you quickly understand the function of the instrument designed in this paper, I first present the measurement results as a demonstration, as shown in Figure 1-4:
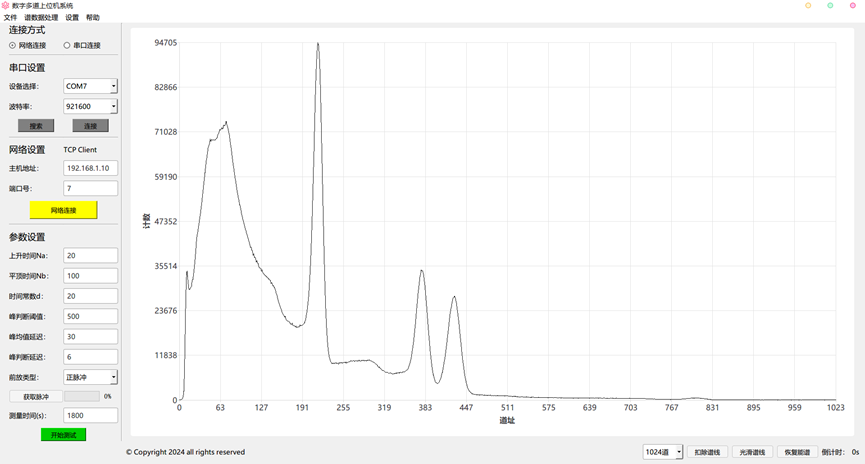
Figure 1-4 Measurement results of Co-60 & Cs-137 mixed radioactive source (500s)
The above figure shows the host computer software designed in this paper, which will be introduced later. As you can see in the large-scale measurement energy spectrum, there are several distinct peaks. From left to right, the first small peak is the characteristic X-ray of Ba-137 (a decay product of Cs-137), with an energy of 32 keV. The broad peak is the Compton plateau and backscattering peak. The third and highest peak is the full-energy peak of Cs-137, with an energy of 662 keV. The fourth and fifth are the two full-energy peaks of Co-60,
with energies of 1173 and 1332 keV respectively. Therefore, you can see that compared to Geiger counters and personal dose rate meters, radiation energy spectroscopy can very accurately distinguish the energy and type of radionuclides. As mentioned earlier, the channel address is directly proportional to the radiation energy. Based on the measurements of known-energy nuclides in the above figure, we can find the correspondence between peak address and energy. By performing linear fitting (energy calibration), we can obtain the energy corresponding to each channel address. Therefore, when measuring the environment, we can identify nuclides based on their energy!
Of course, this instrument not only has this qualitative analysis capability, but also allows for quantitative content analysis by determining the nuclide count based on the left and right boundaries of the peaks! (This requires more specific algorithm support, which will be mentioned later)
Energy calibration (finding the linear relationship coefficient between channel address and energy)
Spectrum smoothing (smoothing spectral lines);
Peak finding (finding the peaks and their left and right boundaries in the spectrum)
Nuclide identification (identifying the types of nuclides found in the energy spectrum based on the database)
Peak area calculation (calculating the net peak area of the energy spectrum peaks)
Content calculation (calculating the nuclide content based on factors such as net peak area, measurement time, and detection efficiency)
The above steps are the usual energy spectrum data processing flow. The first four points are qualitative analyses. Due to the huge workload, the host computer software in this paper only completes the peak finding step. Nuclide identification requires manual identification. Subsequent quantitative analysis requires manual calculation.
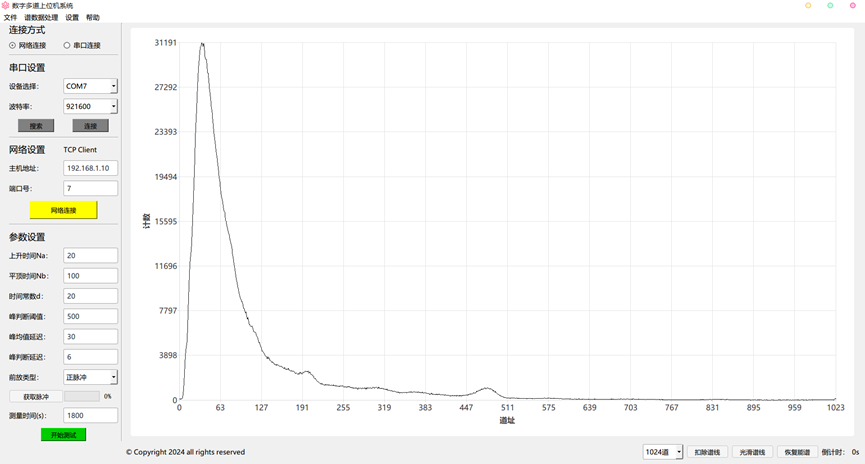
Figure 1-5 Environmental background radiation measurement results (1800s)
Figure 1-5 above shows the measurement results of environmental background (a very standard environmental background energy spectrum). In the 1800s measurement, a peak can be found between channels 447 and 511. This peak is contributed by 1.46MeV natural K-40 (the K-40 found in bananas). Secondly, after magnification beyond 511 channels, the contribution of the natural radioactive series, uranium-thorium series, can be observed (though it is very small).
I believe everyone now has a preliminary understanding of the instrument's principles, applications, and results. Next, we will move on to the instrument design section.
2. System Scheme and Hardware Circuit Design Principles
2.1 System Design Scheme

Figure 2-1 Overall Logic Framework of the Digital Multichannel System Design
This paper's digital multichannel system is designed based on the Xilinx ZYNQ SoC heterogeneous chip. This chip, based on the traditional FPGA architecture, incorporates a dual-core ARM-Cortex A9 processor, providing excellent performance support for high-speed data acquisition tasks. The overall system architecture is shown in Figure 2-1. The probe section integrates a high-voltage power supply and a charge-sensitive preamplifier. The signal conditioning section first reduces the nuclear pulse width through a pole-zero cancellation circuit, then amplifies the amplitude through a main amplifier, and finally converts the single-ended signal into a differential signal through an ADC differential drive, which is then input to the ADC for digital acquisition. The acquired signal is digitally processed in the ZYNQ FPGA to form energy spectrum data. The energy spectrum is transmitted to the ZYNQ ARM terminal through the high-speed bus inside the ZYNQ chip for upper and lower computer data transmission and overall system control.
Further detailing the hardware:
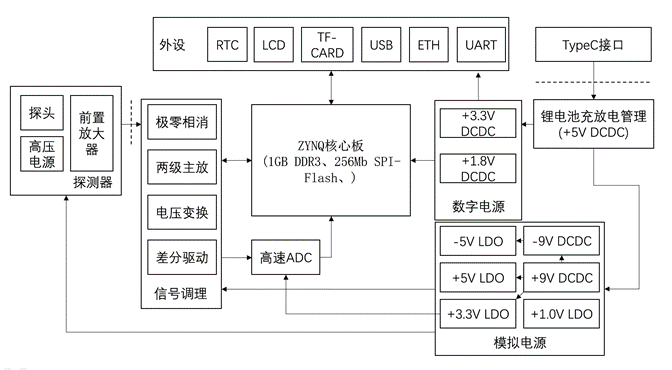
Figure 3-2 shows the logic framework of the digital multichannel hardware design.
The hardware designed in this paper can be roughly divided into three parts: measurement acquisition, control transmission, and power management. Measurement acquisition includes the probe, high voltage, and preamplifier. These components are connected to the signal conditioning input terminal of the host through shielded cables, and after pole-zero cancellation, main amplifier amplification, voltage conversion, and single-ended to differential conversion, they enter the ADC for real-time sampling and conversion. The control and transmission section mainly includes the ZYNQ core board, used for ADC sampling control and pulse digital shaping, overall machine control, and data transmission between upper and lower computers, implemented through peripherals such as control serial ports, Ethernet ports, and LCD touch screens. Power management includes 4.2V lithium-ion battery charging and discharging management, digital power conversion from 5V to 3.3V and 1.8V, and analog power conversion from 5V to +9V and -9V DC-DC converters. The analog circuit uses an LDO in the later stage, designed to output +5V, -5V, 3.3V, and 1.0V for signal conditioning and ADC chip use.
2.2 Signal Conditioning Circuit Principle and Design
Due to the involvement of some professional knowledge, the signal conditioning circuit will be explained in detail here, while the digital circuit design is based on the ZYNQ Navigator development board design of Zhengdian Atom and will not be discussed in detail here.
2.2.1 Pole-Zero Cancellation (PZC) Circuit:
The trailing edge of the pulse signal output from a charge-sensitive preamplifier (CSA) falls slowly. At high count rates, pulse accumulation occurs at the tail of the signal, causing baseline drift. This pulse superposition can prevent subsequent amplifiers from functioning properly. Therefore, a pole-zero cancellation circuit (PZC) is typically used to reduce the pulse width, allowing the detection system to maintain normal operation at high count rates.
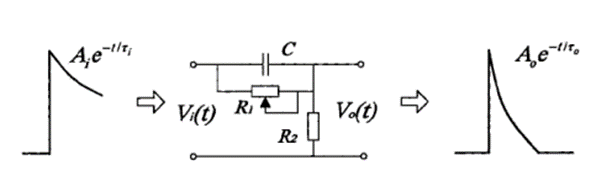
Figure 3-3 shows a schematic diagram
of the PZC circuit. It solves the signal undershoot phenomenon caused by the CR differentiating circuit while rapidly reducing the signal width.
According to Kirchhoff's current law and the s-domain transformation formula, it is easy to see that:


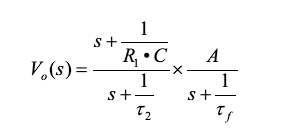

(its time constant is necessarily reduced; the instrument design circuit is consistent with Figure 3-3 and will not be shown in detail.)
2.2.2 Main Amplifier:
This paper selects the ADI LTC6228 operational amplifier chip. The LTC6228 is a single-channel, high-speed, low-noise, rail-to-rail output, unity-gain stable operational amplifier.

Figure 3-4 Main Amplifier Circuit Schematic.
Figure 3-4 is the schematic diagram of the main amplifier circuit used in this paper. To accommodate more preamplifier output modes, the main amplifier designed in this paper is compatible with both negative and positive pulse inputs. Therefore, a two-stage inverting operational amplifier circuit is used. The first stage is the main amplifier responsible for amplifying the input signal by a specified factor, while the second stage operational amplifier is set to unity gain and is responsible for signal inversion. An analog switch is then used to select the operational amplifier output.
To meet the requirements of multiplexing, this paper selects the AGM1419 analog switch chip from Analog Devices (ADI) to implement the signal gating function. The label "MUX0_A0" in the figure represents the input digital signal used to select the channel, which is connected to the ZYNQ core board for control.
2.2.3 Voltage Conversion Circuit
To coordinate with the subsequent ADC sampling circuit, directly inputting a pulse signal in the range of 0V to +5V is not feasible, because the differential input range of the ADC used in this paper is 2Vpp. Therefore, an operational amplifier circuit is needed to transform the pulse amplitude to the range of -1V to +1V. After analysis, the relationship between the two can be obtained:
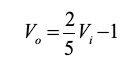
The amplitude transformation part can be implemented using voltage divider resistors and operational amplifiers, while the addition and subtraction operations can be implemented using adders. Combining the two, the circuit is shown in Figure 3-5:

Figure 3-5 Operational Amplifier Voltage Transformation Circuit.
The +1V reference voltage in the circuit is generated by the LT3045 LDO circuit mentioned above.
2.2.4 ADC Differential Drive and Sampling Circuit
This paper selects the AD4945-1 differential operational amplifier chip from Analog Devices. The AD4945-1 is a low-noise, low-distortion, fully differential amplifier.
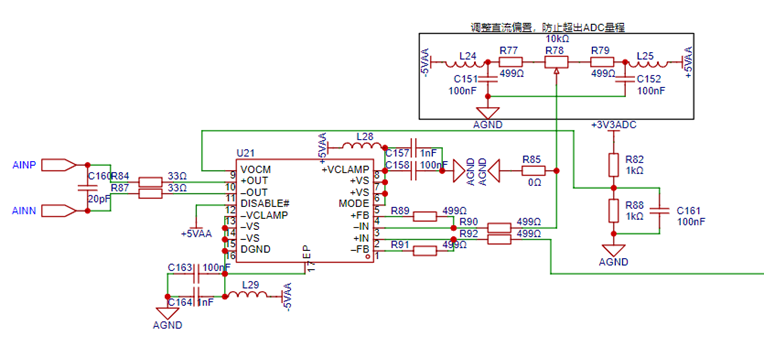
Figure 3-6 shows the schematic diagram of the AD4945-1 single-ended to differential circuit.
Since the AD9245 requires an input common-mode voltage of 1.65V, this can be easily obtained by dividing the 3.3V voltage, as shown by resistors R82 and R88 in Figure 3-6. Secondly, due to inevitable deviations in power supply voltage and differences in analog components, the output differential signal difference may exceed the ADC's required range. To ensure that the differential output signal difference always remains within the ADC's required range (2Vpp for AD9245), the negative input terminal of the differential op-amp is not grounded (if grounded, connect resistor R85; direct grounding is recommended!). Instead, an adjustable resistor is connected to provide a pulse baseline voltage within the range of -5V to +5V for manual adjustment.
For the ADC, this paper selects the Analog Devices AD9245 14-bit@80MSPS successive approximation converter chip.
Figure
3-7 shows the circuit schematic of the AD9245. The chip uses CMOS output, and resistors are used for impedance matching of its digital signal pins. The routing impedance information needs to be recalculated in the later PCB design. The "Mode" pin is the chip's mode selection pin, which can configure the output digital signal format and stabilize the external clock. According to the datasheet, when the pin is set to 2/3Vcc, the output data format is binary two's complement, and the input clock is stable. The "SENSE" pin can set the differential output range and reference voltage value. In this paper, grounding it is set to a 2Vpp range, and the output reference voltage is 1V. "REFT, REFB" are internal reference voltage decoupling pins, connected to external decoupling capacitors.
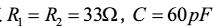
In addition, to ensure the chip's performance, the differential signal input to the ADC passes through an anti-aliasing filter. Here, resistors and capacitors provide a low-pass filter and charge hold for the ADC's internal sample-and-hold amplifier. Its bandwidth calculation formula:

Therefore, we take
2.3. Digital Circuit Design
This paper selects the ZYNQ7020 core board from Zhengdian Atom. Secondly, the LCD uses a 4.3-inch RGB888 protocol LCD display from Zhengdian Atom. The digital part includes a TF card, Ethernet, and USB 2.0, referencing the Zhengdian Atom development board design. (Since the USB 2.0 function is not used, this part does not need to be soldered.)
Secondly, the PCB serial port uses a dual Type-C and Type-B interface design, simply connected in parallel; in actual use, only the Type-C interface needs to be soldered. This interface is responsible for serial communication and charging.
2.4 Overall PCB Layout
The final version of the multi-channel pulse amplitude analyzer PCB motherboard designed in this paper, after modification and verification, is shown in Figure 3-8. The PCB size is 140x90mm, with a relatively compact layout and good performance.

Figure 3-8 Overall PCB Circuit Layout
3. Digital Shaping Algorithm—Research on Trapezoidal Shaping
First, let's answer the most important question: Why must a digital shaping algorithm be used? Firstly, to mitigate the impact of ballistic deficit: Due to the influence of distributed capacitance and resistance, the rising edge of the ideal nuclear pulse (single exponential decay signal) is no longer ideal, but has a certain width, eventually becoming a double exponential decay signal. This leads to the attenuation of the pulse amplitude, known as ballistic deficit (causing the energy spectrum to drift towards the lower energy region). Secondly, digital filtering shaping algorithms, as a type of digital filter, have a certain filtering effect.
Currently, many digital shaping algorithms have been developed. Among them, trapezoidal (triangular) shaping is widely used in digital multichannel applications due to its advantages such as simple algorithm, real-time speed, suitability for high-throughput pulses, ability to reduce electronic noise and ballistic deficit, improved energy resolution, and reduced requirements for ADC differential nonlinearity.
3.1 Mathematical Description of Trapezoidal Shaping Algorithm
Under ideal conditions, the mathematical expression of the nuclear pulse signal is:
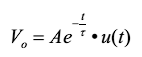
where A is the pulse amplitude, τ is the signal decay time constant, and u(t) is the step function.
Trapezoidal shaping refers to shaping a nuclear pulse signal into an isosceles trapezoidal signal. The triangular signal is a special case where the width of the trapezoid's flat top is zero, as shown in Figure 3-1.
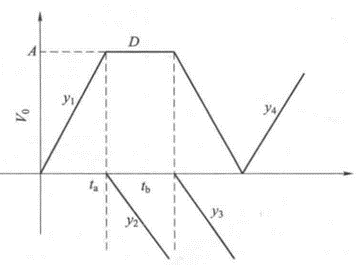
Figure 3-1 Trapezoidal Shaping Signal
. Converting Figure 3-1 into a functional expression:
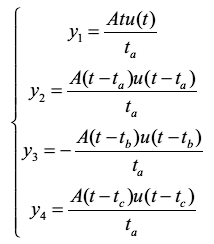
In the above equation, ta represents the rise time width before the trapezoid reaches its flat top, tb is the time at which the flat top ends, and tc is the total time width of the trapezoid.
In practical applications, there are generally two methods for implementing trapezoidal (triangular) shaping: the Z-transform method and the convolution transform method. Since the algorithm derived by the Z-transform method is easy to implement in FPGA, this paper chooses to use the trapezoidal shaping algorithm derived by the Z-transform method. After discretizing the above two equations, a Z-transform is performed to obtain the system's response function:

Assuming the system's sampling period is , then
it can be observed that a feedback unit exists in the equation, which belongs to an IIR filter. To reduce the implementation difficulty of the FPGA shaping algorithm, the multi-order filter is decomposed and implemented in a cascaded manner. This paper decomposes the response function into four cascaded subsystems:

Taking the inverse Z-transform of the above equation, we get:

In the above equation, it is easy to see that the subsystems H1(z) & H4(z) are differential operations, while H2(z) & H3(z) are integral operations. Placing H1(z) in the first stage can avoid data overflow in the integration process, while placing H4(z) at the end can reduce the accumulated error in the integration, but it will use more FPGA resources (7020 resources are sufficient, no problem).
3.2 Simulation Study of Ladder Shaping Algorithm
3.2.1 Influence of Shaping Parameters on Pulse Separation
Radioactive decay in nature is random, and multiple decays may occur in a short period of time. In this case, the second pulse arrives before the previous nuclear pulse has fully recovered to the baseline, so the second signal is superimposed on the tail of the previous signal, which we call pulse stacking. Pulse stacking can cause changes in pulse amplitude, leading to the extraction of incorrect information. Digital shaping algorithms possess a certain ability to separate stacking pulses, which is related to specific shaping parameters. Therefore, studying the effect of different shaping parameters on the separation capability of stacking pulses is necessary and can also provide theoretical reference for the stacking rejection module discussed later.
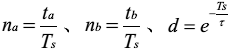
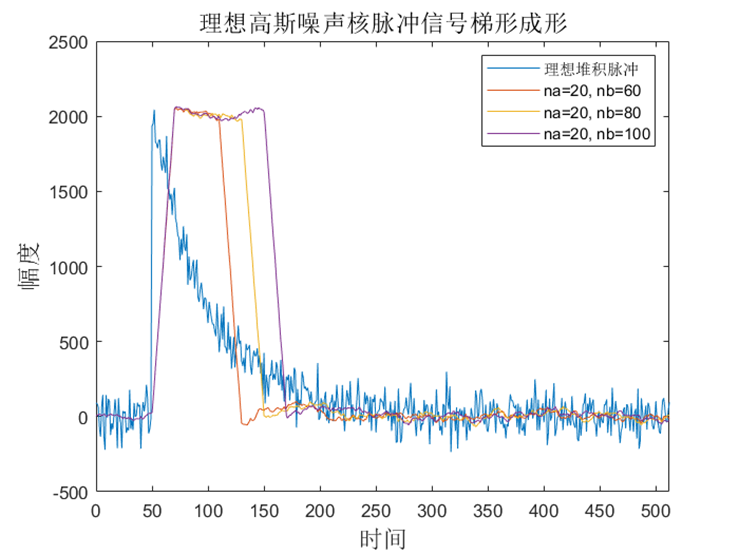
This paper uses ideal kernel pulses for research, as shown in Figure 3-3, where the two pulses are spaced 100 clock cycles apart. First, the rising edge width of the trapezoid, na=20, is fixed, and only the flat top width is changed to study its effect on the shaping of the stacking pulses. The results are shown in Figure 3-3:
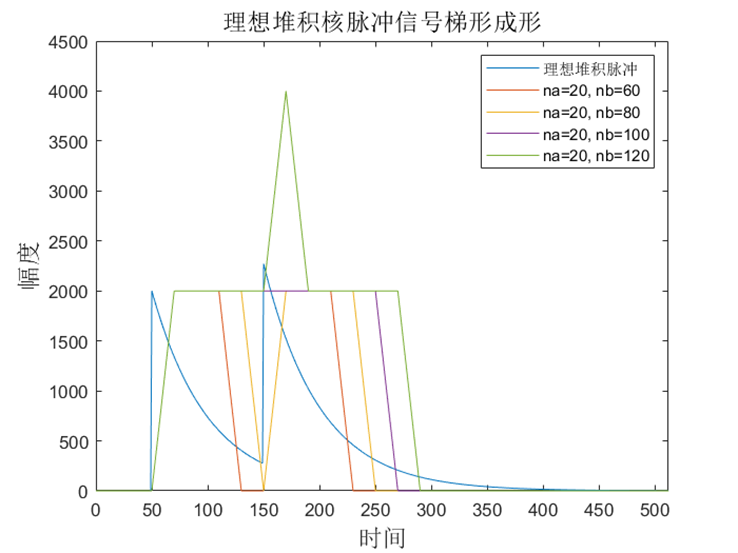
Figure 3-3 Results of stacking pulse trapezoidal shaping by changing only the nb value.
It can be observed that as the width of the flat top decreases, the accumulation of the forming pulses is alleviated. In Figure 3-3, when nb=100, it can be seen that the falling edge of the forming pulse of the previous signal disappears and the rising edge of the forming pulse of the next signal disappears, and the two flat tops are connected. This is the limit case where the accumulated pulses can be separated! Further analysis shows that nb=100 means that the sum of the rising edge and the width of the flat top of the trapezoidal forming signal is equal to the interval width of the two accumulated core pulses mentioned above. When it continues to decrease, the interval between the two trapezoidal signals becomes larger and larger. When nb is greater than this critical value, the flat top of the trapezoidal pulses begins to accumulate. At this time, it is impossible to continue to extract the pulse peak, and the accumulated peak is discarded. The reverse is not true. Therefore, when the width of the rising edge of the trapezoidal forming is fixed, the narrower the flat top, the stronger the ability to separate the accumulated pulses.
Figure 3-4 shows the result of changing only na on the trapezoidal forming of the accumulated pulses
. Figure 3-4 studies the effect of changing the rising edge width on the separation of the accumulated pulses when the width of the flat top of the trapezoidal forming is fixed (nb-na=60). It is evident that the accumulation of trapezoidal pulses decreases as na decreases. Similarly, when nb = 100, the tops of the two pulses are perfectly aligned. Therefore, combining the previous results, we can conclude that the ability of trapezoidal forming to separate the accumulated kernel pulses is affected by the forming width. When the forming parameter nb is less than or equal to the interval between the two kernel pulses, the peak value of the accumulated pulses can be completely extracted. When na + nb is less than or equal to the interval between the two kernel pulses, the trapezoidal forming pulses can completely separate the accumulation.
3.2.2 Influence of Forming Parameters on Noise Suppression
Electronic noise in actual measurement circuits is unavoidable. To ensure that high-frequency noise does not interfere with the amplitude extraction process, the trapezoidal forming algorithm derived from Z-transform is used as an IIR low-pass filter, which has a certain suppression effect on high-frequency noise. The cutoff frequency of this low-pass filter system is closely related to the trapezoidal forming parameters.

Figure 3-5 shows the effect of trapezoidal forming on noise filtering by only changing the na value.
To study the influence of forming parameters on the trapezoidal forming filtering effect, an ideal negative exponential decay signal with superimposed Gaussian noise is used for the experiment. Figure 3-5 compares the effect of different rise-edge widths on the filtering effect with a fixed trapezoidal pulse top width (nb-na=50). It is clear that as the rise-edge width increases, the high-frequency components of the output trapezoidal pulse decrease. Therefore, the longer the trapezoidal rise time, the better the filtering effect, and the lower the cutoff frequency. Figure 3-6 shows
the effect of changing the nb value on noise filtering with
trapezoidal shaping. It is evident that the filtering effect of the trapezoidal pulse does not significantly improve with the change of the top width. Therefore, based on the previous analysis, it can be concluded that the filtering effect is only related to the rise time of the trapezoidal shaping, and the longer the better.
In summary, combining the filtering effect and the de-pilling effect, it can be found that their values have exactly opposite effects on the results. Therefore, when implementing the algorithm on the FPGA, we need to comprehensively consider the noise level and the severity of the measured kernel pulse pile-up to comprehensively select an appropriate shaping parameter.
The research content of this chapter is mainly used to guide the subsequent shaping parameter setting and FPGA logic design. Very important!
4. FPGA Implementation of Trapezoidal Shaping
4.1 Overall Algorithm Framework

Figure 4-1 FPGA Algorithm Logic Framework
The FPGA algorithm is implemented based on the trapezoidal shaping algorithm derived by the Z-transform method. First, the ADC acquires data and enters the FIFO buffer. After passing through the FIR low-pass filter, the noise-reduced kernel pulse signal is output. The pulse is then subjected to trapezoidal and triangular hybrid shaping. Utilizing the characteristic of triangular shaping to easily find the peak, the arrival of the kernel pulse can be more accurately confirmed. Trapezoidal shaping is used to extract the pulse amplitude. Then, based on the pulse start signal, the trapezoidal pulse is used to extract the baseline and amplitude. Afterwards, based on the stacking rejection result, it is confirmed whether the currently calculated amplitude can be used for the final energy spectrum shaping, and the spectrum data is transferred to the PS-side DDR3 memory via DMA.
In FPGA, for the convenience of decimal calculations, it is usually stored in fixed-point decimal form. The hybrid shaping algorithm involves a large number of decimal and signed number operations. In the code writing below, a fixed decimal place of 30 bits is used for truncation representation.
4.2 Trapezoidal and Triangular Hybrid Shaping
The trapezoidal and triangular hybrid shaping are both implemented using the trapezoidal shaping algorithm derived by the Z-transform method. Based on the recursive formula derived in Chapter 4, the entire forming process is divided into four modules: Module 1 implements input signal delay, Modules 2 and 3 implement integration and summation, and Module 4 implements signal delay.
Module 1 performs a clock cycle delay operation on the input raw pulse signal. In the FPGA, the delay can be implemented by shifting registers with a certain storage depth.
always@(posedge sys_clk)
begin
if(!sys_rstn) begin
for (i=0; i
delay_temp[i]
end
end
else begin
delay_temp[0]
for (i=0; i
delay_temp[i+1]
end
end The code
above
uses a 15-bit signed register "delay_temp" with a storage depth of "REG_GLOBAL_LIMIT" (defined parameter, 400 in this article) for shift operations. The register is cleared during a global reset. The for loop iterates a fixed number of times and can be synthesized. During normal circuit operation, the input signal is first stored in the first register, and then the entire register is shifted every clock cycle. Finally, we only need to retrieve the corresponding first data in another always block to achieve the delay operation.
However, it should be noted that the shaping parameters given by the user in real-time cannot exceed the storage depth of the register (not greater than "REG_GLOBAL_LIMIT").
The integral solved in module 2 includes multiplication and division operations. To speed up the calculation, the division operation in equation (4-5) is processed at the PS end using an FPU (Floating Point Unit). The fractional part is multiplied and then passed to the FPGA for multiplication. Since the ZYNQ PL end has many DSP resources, it can easily handle multiplication operations.
assign multiple_temp1 = trapezd_alg_m1_datain * na_1;
assign multiple_temp2 = vi_delay1 * d_na;
always@(posedge sys_clk)
begin
if(!sys_rstn) begin
trapezd_alg_m2_dataout
vi_delay1
end
else begin
The `vi_delay1
trapezd_alg_m2_dataout
end
end`
module takes the result from the previous module as input and passes it in. All values are calculated by the PS terminal and then passed in. The summation process in the above code appears to have no signal delay, but the value on the right is actually the value of "trapezd_alg_m2_dataout" from the previous clock cycle, which conforms to timing requirements. Note that because this module introduces fixed-point decimal arithmetic, the register is expanded to 52 bits, with the last 30 bits being the decimal places.
Module 3 mainly implements simple summation; only timing needs to be considered.
`always@(posedge sys_clk)
begin
if(!sys_rstn) begin
trapezd_alg_m3_dataout
vi_delay1
end
else begin
vi_delay1
trapezd_alg_m3_dataout
end
end`
Module 4 implements differential and delay operations, with the delay principle consistent with Module 1.
assigntrapezd_alg_m4_dataout = trapezd_alg[29] ? (trapezd_alg[47:30] + 1'b1) : trapezd_alg[47:30];
In order to truncate the final result to an integer, the above code implements the rounding judgment. It can be calculated that the binary representation of decimal 0.5 (D) is 0.1 (B). Then, the highest bit of the fractional part is judged. If it is 1 (B), the integer part is added by one. Otherwise, the fractional part is directly truncated.
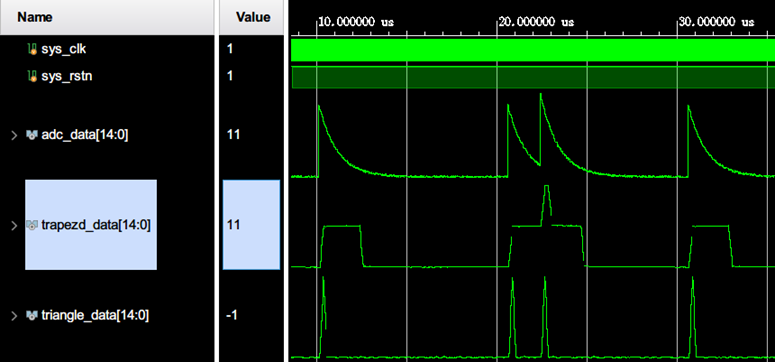
Figure 4-2 Simulation of trapezoidal and triangular hybrid forming algorithm
The above module is instantiated at the top level. Then, the simulation tool provided by Vivado is used to write a Testbench file to simulate and test the algorithm. The noisy negative exponential pulse signal generated by MATLAB is used as input. After calculating the appropriate forming parameters, it can be found that the algorithm successfully forms it into trapezoidal and triangular signals, as shown in Figure 4-2.
4.3 Pulse Initiation Detection
Due to the characteristics of the triangular shape, finding its peak is sufficient to determine the arrival of the nuclear pulse, providing a precise trigger for subsequent judgment logic. (For brevity, please refer to the documentation for the subsequent Verilog code.) The code compares the three points before and after the input triangular shape value to determine if it is a peak. Secondly, to prevent noise interference, a threshold condition "peak_threshold" must be met, which is determined by the user. To further avoid noise interference, the number of pulses exceeding the threshold before meeting the peak condition, "threshold_count", is recorded. This number must be greater than the user-defined number to avoid false judgments caused by significant noise interference. Finally, "interval_count" is used to specify the minimum interval between two pulses. If the system determines that the interval between two pulses is too small, the second pulse is considered a false pulse. This is to avoid false judgments caused by noise superimposed on the triangular shape pulse that meets the threshold condition.
4.4 Pulse Stacking Discarding
Chapter 4 conducted a detailed study of the theoretical situation of stacked pulse separation, concluding that pulses can be separated when the pulse interval is greater than or equal to the sum of the rise time and the flat-top time of the trapezoidal pattern, that is, when the pulse interval is not less than a certain value. In the code, "min_interval" represents the minimum interval value (assigned a value of 0). The always module uses the pulse start signal as a trigger for timing, and the timing remains unchanged when it reaches "min_interval". In another always module, it is determined whether the interval between two adjacent pulses is less than the minimum interval that can be separated. If so, the stacked pulse flag "stacking_flag" is output.
4.5 Pulse Baseline Extraction
This module still needs to make logical judgments based on the pulse start signal. However, after the pulse start signal is triggered, the trapezoidal pattern has already reached the peak position. If the average of several points before this point is used as the baseline data, it is obviously wrong. Therefore, the trapezoidal pattern signal needs to be delayed for 1 clock cycle (AVR represents the number of average points here, which is 8 points in this article). Then, the average of the delayed data after the pulse start signal is triggered will be the correct baseline data.
The data delay principle is the same as before, but it is also important to note that when accumulation occurs, the trapezoidal shape may overlap. In this case, the pulses can be separated, but it is obviously inappropriate to solve for the baseline of the next signal. An algorithm logic needs to be used to avoid this situation and use the baseline of the previous signal as the current value. As we know from the theoretical study of accumulation in the previous section, the baseline of the next signal can only be extracted when the interval between the two pulses is greater than a certain value. This determination is also implemented by a counter.
4.6 Pulse Peak Extraction
The calculation of the effective peak value needs to be judged based on the result of the accumulation rejection in the previous section before further action can be taken. Since the determination of accumulation requires considering the relationship between the two pulses, after the pulse start signal is issued, it is necessary to determine whether the current peak has accumulated and whether the previous pulse has accumulated before extracting the peak value of the trapezoidal shape. The judgment logic is relatively complex, and this paper uses a finite state machine to implement it.
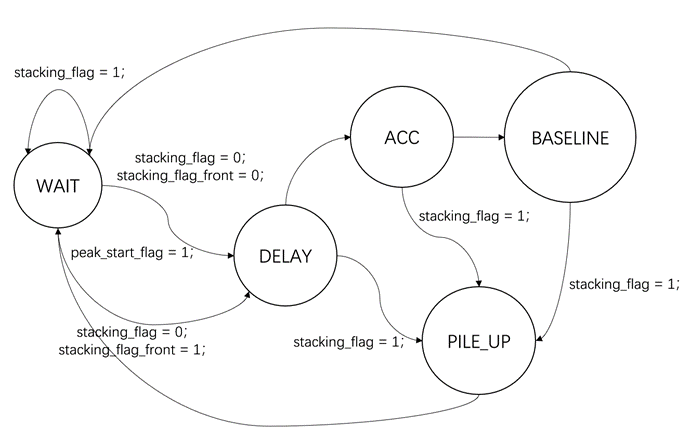
Figure 4-3 Peak Extraction Logic State Transition Diagram
Figure 4-3 is the state transition diagram of the state machine. First, when no pulse start signal arrives, the state machine waits in the "WAIT" state.
Scenario 1: When the pulse start signal arrives, and neither the current pulse nor the previous pulse has accumulated, the peak value information of the previous pulse is immediately output for use by the energy spectrum shaping module. Then, the amplitude of the current pulse is calculated. First, it transitions to the "DELAY" state for a user-specified delay (the user can specify how long to delay at the top of the trapezoid before averaging to obtain a more accurate amplitude). After the delay, it transitions to the "ACC" state to calculate the 32-point average. Finally, it transitions to the "BASELINE" state to subtract the baseline to solve for the true amplitude. At this point, the calculation of the current pulse amplitude is complete, and it returns to the "WAIT" state to wait. Secondly, during the calculation process, regardless of the state, if an accumulation signal is issued, it immediately jumps to the "PILE_UP" state to reset the register and returns to the "WAIT" state to wait, i.e., discarding the current peak value and the newly arrived accumulation peak.
Scenario 2: When the pulse start signal arrives, and the current pulse has not accumulated but the previous pulse has accumulated, the difference from Scenario 1 is that the peak value information of the previous pulse is not output, and the subsequent process is the same.
Scenario 3: The current pulse accumulates, discarding it and continuing to wait in the "WAIT" state.
The above algorithm logic was simulated, and the results are shown in Figure 4-4:

Figure 4-4 Simulation results of the forming and judgment algorithm logic
As seen in the first red box, "peak_start_flag" is triggered when the pulse arrives. At this time, the calculated baseline value "trapezd_baseline" is output. Since this is the first input pulse, there is no output of either the stacking or the amplitude information of the previous pulse. In the second red box, when the pulse arrives again, the amplitude of the previous pulse and the "peak_value_ok" signal are output to trigger the energy spectrum shaping module. When the stacking pulse arrives, the stacking signal "stacking_flag" is triggered as seen in the third red box. At this time, the amplitude of the previous pulse is not output, and the baseline value retains the calculated result of the previous peak (the interval is insufficient to calculate the baseline). In the fourth red box, the amplitude of the previous stacked pulse is not output when subsequent pulses arrive, indicating that the two stacked pulses were successfully discarded. Multiple peak stacking follows the same pattern.
4.7 Other:
I think the other parts do not need to be described further. The FIR is designed using MATLAB and the IP core, and the DMA uses the AXI IP core. Due to the large size and complex logic of the FPGA project, it may be difficult to understand; please forgive me. If you need to modify it to your own hardware connection, please modify the pin constraints and then re-synthesize and implement it.
For instructions on setting up the Vivado and Vitis development environments, please refer to the Xilinx tutorial documentation.
5. Embedded Software Design
5.1 Overall Framework

Diagram 5-1 ZYNQ SoC PS-side Application Logic Framework Diagram
The PS-side program in this paper mainly consists of two parts, running on two CPU cores respectively. The dual cores operate in AMP (Asymmetric Multi-Processing) mode. AMP mode refers to each core running its own OS or different independent instances. When running on bare metal, each core has its own independent memory space, and can also share some memory space with other cores. Each core runs different tasks relatively independently, but one core is the master core, responsible for controlling the operation of other cores and the entire system, while the other cores cooperate with the master core to complete specific tasks (Xilinx, 2014). In this application, each of the dual CPUs occupies half of the DDR3 memory as an independently accessed cache area, and data interaction between the dual cores is carried out through on-chip OCM cache in conjunction with software interrupts. CPU0 serves as the main core, handling system initialization, CPU1 startup, upper and lower computer data transfer, peripheral control, and measurement control. The coprocessor core CPU1 is only responsible for handling graphical user interface and touch input operations. Figure 5-1 shows the overall bare-metal software logic framework.
The specific code for the embedded and upper-computer software will not be discussed in detail below; please refer to the relevant documents.
5.2 Serial and Ethernet Communication
The ZYNQ SoC PS terminal has a built-in UART peripheral. After setting the baud rate to 921600Bps, it can send and receive data normally. It is important to note that in ZYNQ, all interrupts for the entire SoC are managed by the GIC (General Interrupt Controller). Therefore, the GIC must be initialized after initialization to ensure the normal operation of the entire interrupt system.
The Gigabit Ethernet protocol layer is implemented using the LwIP (Lightweight IP) open-source protocol stack. LwIP is an open-source TCP/IP (Transmission Control Protocol/Internet Protocol) stack with lightweight, customizable, high-performance, and portable characteristics. Due to its small memory footprint and overall small code size, it is suitable for use in embedded systems. In this paper, the protocol is set to static IP allocation, with a fixed default IP address of 192.168.1.10 and a default port of 7. (Refer to the internet for specific configuration details.)
5.3 TF Card Data Storage
To facilitate the management of TF card files, this paper introduces the open-source FatFS file system as a method for storing spectrum files. The FatFS open-source embedded file system provides unified API functions for reading, writing files, formatting, creating partitions or disks, etc. Furthermore, Xilinx has officially ported the FatFS file system to ZYNQ, making it easy to configure and use in Vitis.
5.4 Embedded LVGL Graphical Interactive Interface Design
LVGL (Light and Versatile Graphics Library) is an open-source graphical user interface library designed to provide lightweight, portable, flexible, and easy-to-use graphical user interface solutions for embedded systems. LVGL's core code is written in C/C++, allowing it to run on various operating systems, microcontrollers, and graphics accelerators. Its lightweight, multifunctional, flexible, portable, and easy-to-use characteristics make it highly suitable for embedded systems. The most challenging aspect of using LVGL is porting, requiring customization for specific chips and peripherals, primarily in the driver connections for input/output hardware. To facilitate porting, LVGL provides interfaces for various input devices at the top level, such as buttons, touchscreens, and joysticks. This paper uses a capacitive touchscreen LCD display; simply completing the touchscreen driver and transmitting the acquired coordinate information to LVGL is sufficient. For screen display, LVGL utilizes "video memory," allocating dedicated space in ZYNQ DDR memory for graphics rendering. The user then transfers the image information to the screen in real-time. This paper uses PL-side DMA for transferring image frame data.
6. PC Host Computer Software Design
6.1 Overall Framework

Diagram 6-1 Qt Host Computer Program Logic Composition Framework Diagram
Figure 6-1 is the overall program logic diagram of the host computer, which can be mainly divided into lower-level computer interaction, file management, user control, spectral data processing, and chart drawing parts. The overall logic of the software is as follows: When the user starts the measurement on the host computer software, the host computer sends the shaping parameters and the start measurement command through the serial port or Ethernet. At this time, the host computer starts timing. At specific intervals, the host computer notifies the lower-level computer to upload energy spectrum data, so that the host computer chart can update the displayed data in a timely manner. When the host computer timer reaches its limit, it sends a stop measurement command to terminate the entire measurement and updates the final spectrum to the host computer.
6.2 Spectral Smoothing Algorithm
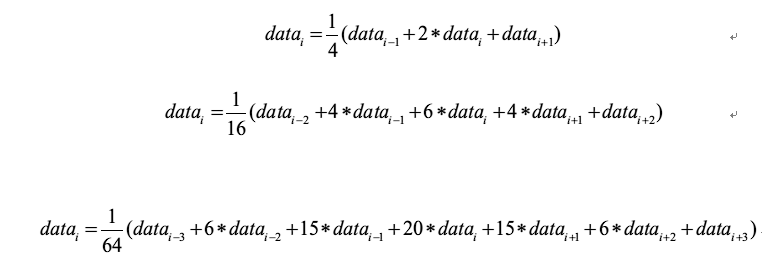
The program integrates the arithmetic moving average method, whose general formula can be expressed as:
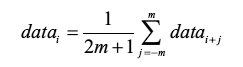
According to the basic algorithm, the host computer in this paper implements a user-defined sliding point number. The user can input all odd values between 1 and 255 for sliding filtering. The basic principle is to calculate the average of multiple points. However, this method is not recommended, as smoothing will cause spectral peak broadening, leading to a decrease in energy resolution!
Secondly, the software also integrates commonly used 3-point, 5-point, and 7-point centroid methods for spectral smoothing. Based on the derived formula
, it is recommended to use these methods. The specific operation interface is shown in Figure 6-2:

Figure 6-2 Upper Computer Smoothing Algorithm Interface.
After opening the spectrum file, please generally reduce the number of channels from 16384 to 1024 or 2048! After selecting smoothing, the red spectral lines appearing on the main interface are the smoothed spectral lines. Clicking the "Smooth Spectrum" button in the lower right corner can turn the display of the original spectral lines on/off.
6.3 Symmetric Zero-Area Peak Finding Algorithm
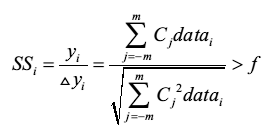
To improve the peak finding ability for weak peaks, this paper selects the symmetric zero-area algorithm and uses the zero-area Gaussian function as the transformation function. The basic idea of this algorithm is: a window function with zero area is convolved with the spectral data; its convolution transformation with the linear basis will be zero, only non-zero where peaks exist. Therefore, the symmetric zero-area transformation spectrum of the spectral data will reflect the change in peak shape. The mathematical expression of convolution is:

Where Cj is the transformation function, datai is the original spectrum, yi is the convolutional transformation spectrum, and the window width W = 2m + 1. The mathematical expression of the Gaussian transformation function in this paper is:

This algorithm generally uses the standard deviation of the transformation spectrum as the unit to find peaks. When this value exceeds a certain integer f, the channel address is considered to be a peak position. Its mathematical expression is:
The specific operation interface is shown in Figure 6-3 below:

Figure 6-3 Symmetrical zero-area peak finding operation interface
After opening the spectrum file, please reduce the number of channels from 16384 to 1024 or 2048! First, enter the Gaussian function width and window width (no specific value requirement) in the pop-up dialog box, and click Start Convolution to get the transformed spectrum on the right. Generally, there will be a relatively obvious protrusion for the position of the peak. Then, select the appropriate peak finding range and threshold f according to the convolution result. The desired peak position and peak boundary can be found.
6.3 SNIP background subtraction algorithm
In energy spectrum measurement, the Compton effect, small-angle scattering of γ rays in the detector, and natural background will cause an increase in the background count of the energy spectrum, thus burying some peaks. To more accurately calculate the net peak count, the background count in the spectrum must first be subtracted. This paper selects the most commonly used SNIP algorithm.
The algorithm first performs a logarithmic transformation on the count to improve the ability to identify weak peaks:

where x(i) is the original count corresponding to the i-th channel, and y(i) is the transformed count.
The filter window width of the algorithm is W=2m+1, and the transformed spectral data is iterated according to the algorithm requirements. In the m-th iteration, the value in the previous iteration m-1 is used:

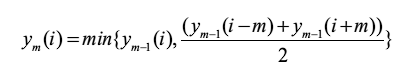
after the iteration is completed, the logarithmic spectrum of the background of the spectrum can be obtained. The background spectrum can be obtained by performing an inverse transformation according to the formula. Subtracting the background spectrum from the original spectrum completes the background subtraction.
The specific operation interface is shown in Figure 6-4 below:
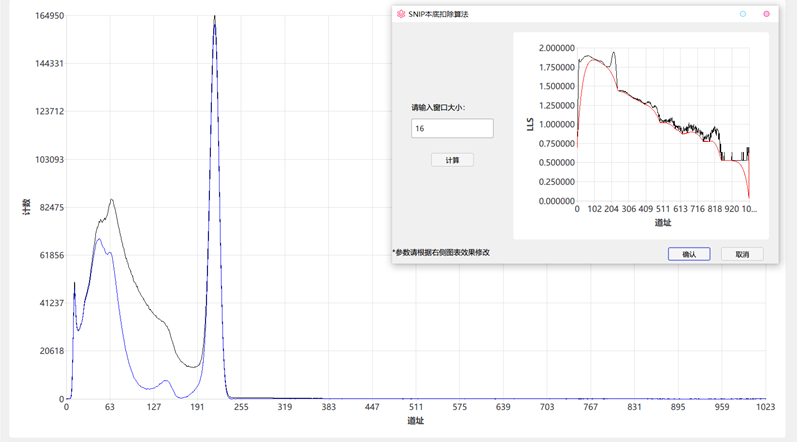
Figure 6-4 SNIP background subtraction operation interface
Figure 6-4 shows the operation result of removing the background from the original spectrum of 137Cs. It can be seen that the user can input the window width in the calculation interface and adjust the window width according to the chart on the right to make the red curve (the logarithmic background spectrum) optimal. In the main interface, the blue curve represents the energy spectrum after background subtraction, and the black curve represents the original spectrum. Comparing the 137Cs peak of the two spectra, it is found that the background is effectively subtracted.
7. Overall Testing and Evaluation
7.1 Evaluation of ADC Sampling Noise
The digital multi-channel input was left floating and connected to a JTAG downloader. After starting energy spectrum sampling, the real-time sampling data of the ADC was exported using Vivado software. In Table 7-1, Type 1 shows the result with the input floating. Three sets of data were sampled, each with 16384 points. The fluctuation range in each set was calculated, and the average of the three sets was taken to obtain the ADC sampling self-flux. Type 2 The differential drive input signal of the ADC was disconnected on the PCB and left floating. The above operation was repeated, and the results are shown in Table 7-1:
Table 7-1 ADC Sampling Noise Fluctuation Range
Type
Fluctuation Range (Channel Address)
1
50
2
10
As mentioned above, the ADC input voltage range is 2Vpp. For a 14-bit ADC, comparing the results of Type 1 and Type 2, it can be seen that the sampling noise mainly comes from the operational amplifier circuit. The ADC's own sampling fluctuation is about 1mV, while the fluctuation of Type 1 is about 6mV, which means that there is still room for optimization in the PCB design.
7.2 Instrument linearity and pass rate test
The main amplifier gain was reduced, and a negative exponential pulse generator was used to generate pulse signals of different amplitudes. The signals were input into the digital multichannel for measurement, and the channel address corresponding to the peak value was found. The signal sequences of 5mV, 50mV, 100mV, 300mV, 500mV, 800mV, and 1000mV were input, and the voltage-channel address relationship fitting curve shown in Figure 7-1 was obtained:

Figure 7-1 Input pulse voltage and channel address fitting curve
As shown in Figure 7-1, according to the fitting results, the instrument's channel address and energy have a good linear relationship of 0.9999.
Measurements were performed using a mixed 60Co and 137Cs radioactive source. The designed host computer software was then used to find the peaks and fit the energy and address. The results are shown in Figure 7-2:
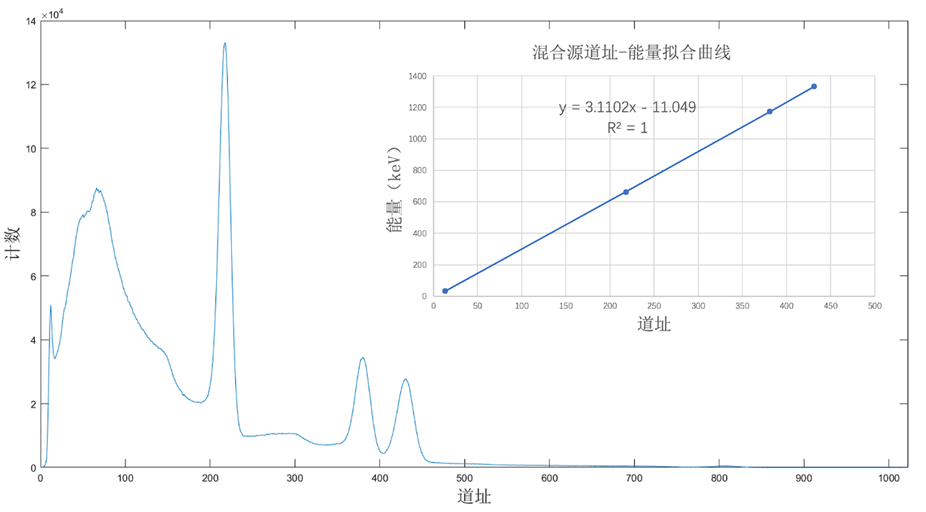
Figure 7-2 Original spectrum and fitting curve of the mixed source measured by the NaI(Tl) detector.
As can be seen in Figure 7-2, from left to right, are the characteristic X-ray peak of 137Ba at 32.0 keV, the full-energy peak of 137Cs at 662.0 keV, and the full-energy peaks of 60Co at 1173.2 keV and 1332.5 keV. Fitting the four peak addresses with the energy shows a good linear relationship of 1.0000.
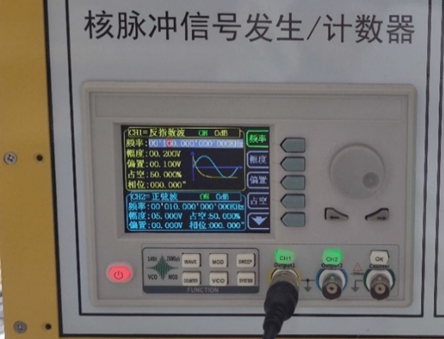
Figure 7-3 Fixed amplitude nuclear pulse generator.
To test the pulse throughput of the instrument, a negative exponential signal generator was used to generate nuclear pulses of fixed amplitude and different frequencies for testing. The signal generator is shown in Figure 7-3. Different pulse frequencies were set, and each group was measured for 120 seconds. The throughput of each frequency was averaged across three groups, and the results are shown in Figure 7-4.
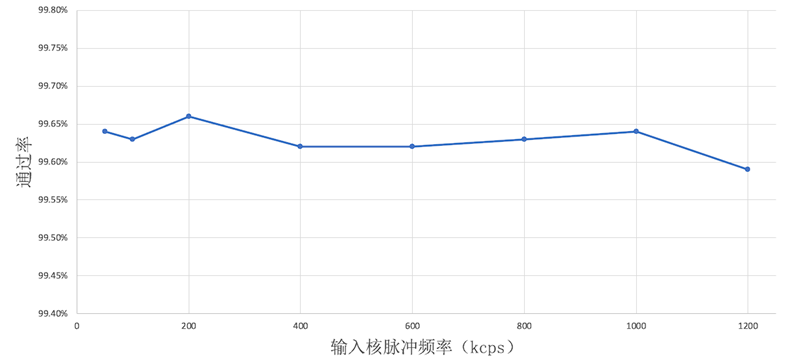
Figure 7-4 shows the pulse throughput curves for different frequencies
. Because no live time correction was performed, the throughput did not reach 100%. The results in Figu


 京公网安备 11010802033920号

 MC13055