* 1. Project Function Introduction
1. Real-time detection of blood oxygen, pulse, and temperature
2. Real-time voltage detection
3. Real-time screen display
4. Battery charging support
5. Stable power supply
6. Button control interaction
In addition, it can also be used as a development board for R7FA2E1A72DFL, supporting the following functions:
1. SWD debugging and downloading
2. Serial port debugging and downloading
3. One IIC connection to MAX30102, allowing learning about IIC and MAX30102 related knowledge
4. One SPI connection to a 0.96 LCD color screen, allowing learning about IIC and screen related knowledge
5. One programmable LED
6. Two programmable buttons
7. One ADC for detecting battery voltage
*2. Project Attributes
This project is being publicly disclosed for the first time, is original, has not won any awards in other competitions, and has not participated in any school defenses.
* 3. Open Source License
GPL 3.0
*4. Hardware Part

Figure 4-1 Hardware Structure Diagram The
hardware structure diagram of this project is shown in Figure 4-1 above. This diagram contains all the hardware content, but here only the functions related to the pulse oximeter are described in detail.
1. R7FA2E1A72DFL Main Control
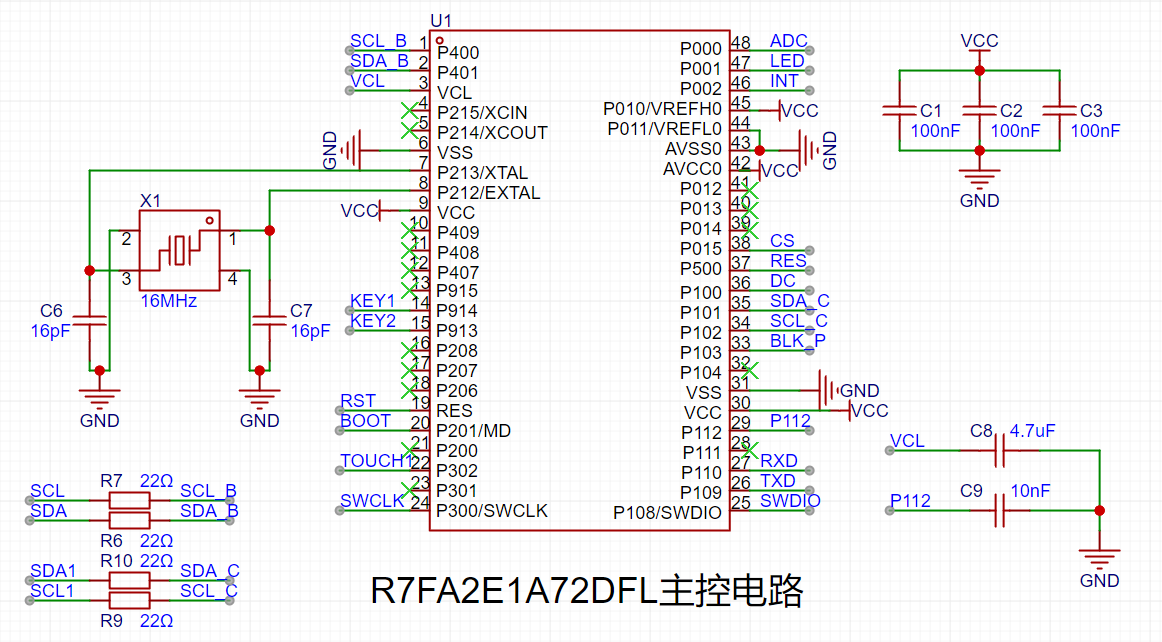
Schematic Diagram: The
main control schematic diagram of this project is shown in Figure 4-2 above. Compared with the official example, this project adds a 16MHz crystal oscillator and series resistors for SPI and IIC, and enables the ADC function.
2. Real-time Detection of Blood Oxygen, Pulse, and Temperature:

The real-time detection function of blood oxygen, pulse, and temperature in this project is implemented using a reflective scheme with the ADI MAX30102. The MAX30102 is an integrated pulse oximeter and heart rate monitor biosensor module. It integrates multiple LEDs, photodetectors, optical devices, and low-noise electronic circuitry with ambient light suppression, enabling high-precision detection of PRG (photoplethysmographic) pulse wave signals. Figure 4-3 shows the waveform detected by this device. This waveform is obtained by subtracting the minimum value from the detected raw data. The host computer software used is Anonymous Assistant.

Figure 4-3 shows the detected waveform.
Initially, the plan was to directly use the MAX30102 chip for detection. The original solution was to disassemble the chip from the MAX30102 module and then solder it onto the board for this project (the module is much cheaper than the chip, and the chip is difficult to obtain). However, the chip was likely damaged during disassembly with a hot air gun, causing it to malfunction after being soldered onto the board. Therefore, the MAX30102 module was ultimately chosen for signal detection, using IIC for communication. The MAX30102 module is shown in Figure 4-4.
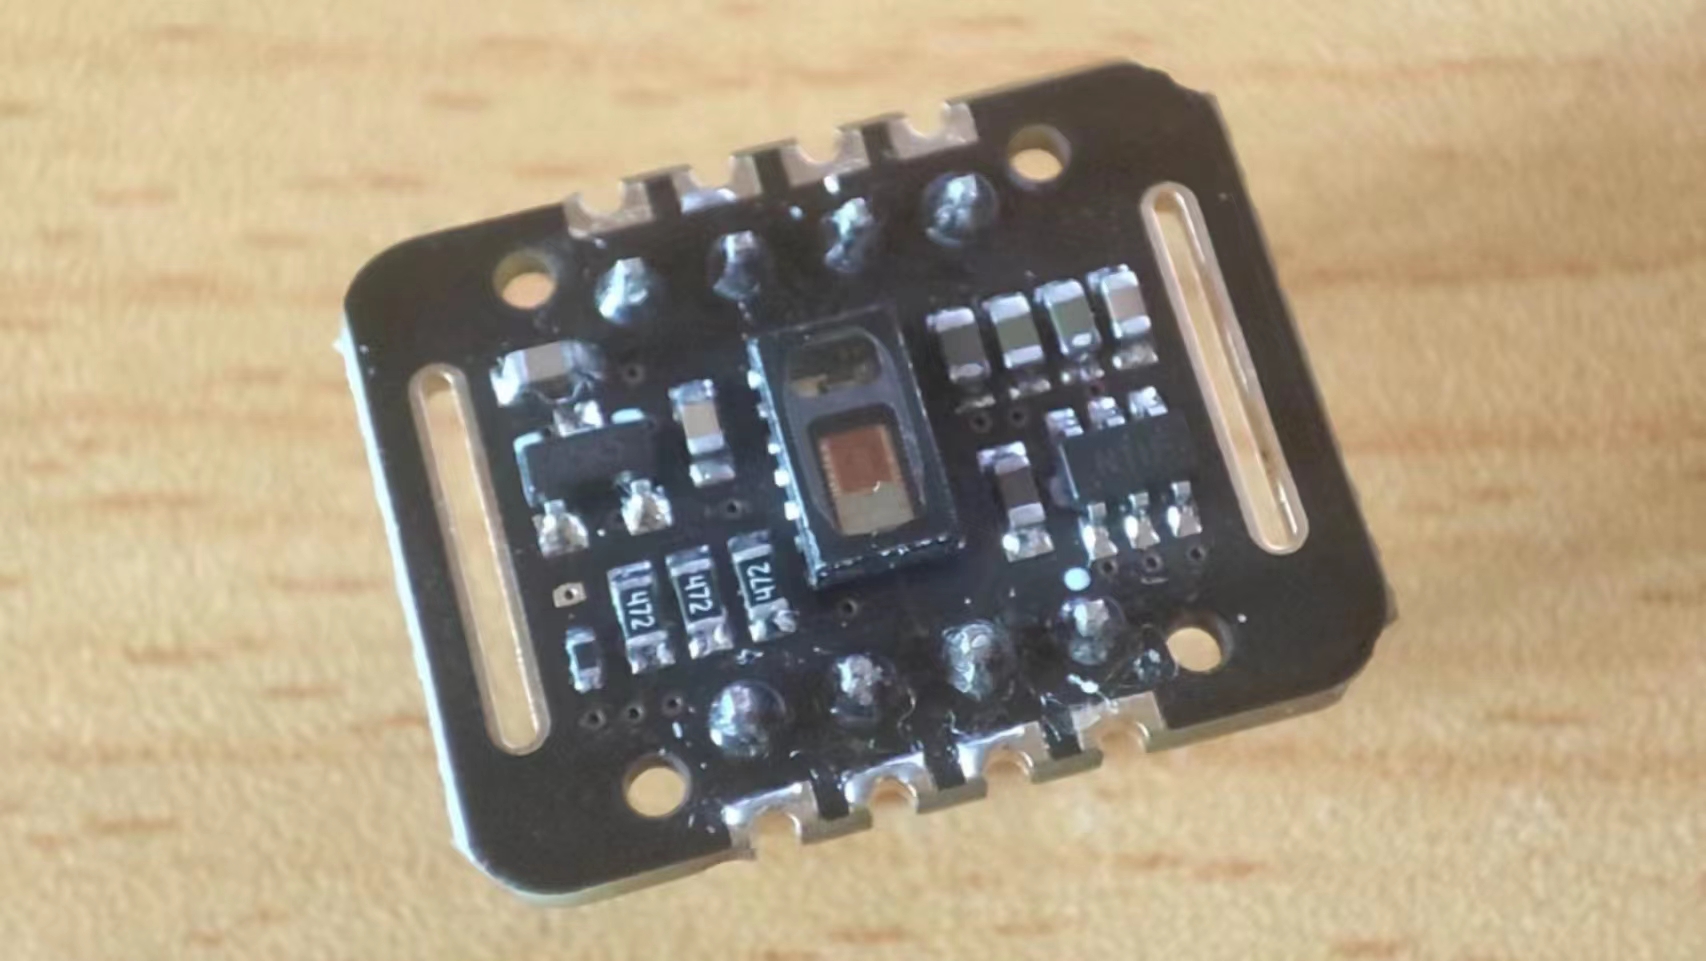
Figure 4-4: MAX30102 Module Image .
3. Real-time Voltage Detection:
Real-time voltage detection is achieved using the ADC function of the R7FA2E1A72DFL. The schematic diagram of this function is shown in Figure 4-5.

Figure 4-5: Battery Voltage Detection Schematic Diagram.
The main controller R7FA2E1A72DFL in this project uses a 3.3V power supply. The maximum voltage to be detected is 5V. Direct connection to the chip would damage it; therefore, a voltage divider is required before connection, and voltage detection is achieved through a voltage divider formula. In this design, the voltage to be detected is set as the input voltage. When the input voltage is greater than 4.2V (the voltage of a 3.7 battery can generally reach a maximum of 4.2V), it can be determined that it is charging. When it is less than 4.2V, it means the battery is supplying power normally (this judgment threshold should not be set to 4.2V, but should be slightly higher, around 4.4V). In this way, the charging status can be detected at the same time as the battery voltage.
4. Real-time screen display
The screen used in this project is a 0.96-inch LCD screen with a resolution of 160*80 and a communication interface of SPI. The schematic diagram of this part is shown in Figure 4-6.

Figure 4-6 Schematic diagram of the screen
5. Support for battery charging
The charging and discharging circuit of this project refers to the charging and discharging circuit of the official example project, with a charging indicator light. The current limiting resistor is set to 3kΩ. According to the formula in Figure 4-7, the charging current is about 400mA.

Figure 4-7 Charging current calculation formula The
schematic diagram of the charging and discharging circuit of this project is shown in Figure 4-8.

Figure 4-8 Charging and Discharging Schematic Diagram
6. Stable Power Supply
The power supply circuit of this project references the power supply circuit of the official example project, providing both TYPE-C power supply and battery power supply. When TYPE-C is connected, it supplies power and simultaneously charges the battery. When TYPE-C is not connected, the battery powers the pulse oximeter. When the power supply is connected, a 6206 linear regulator is used to obtain a 3.3V regulated voltage, providing a stable power supply for the main control and screen. The schematic diagram of the power supply section is shown in Figure 4-9.

Figure 4-9 Power Supply Schematic Diagram
7. Button Control Interaction
This project uses two buttons to implement button control interaction. Button 1 represents starting detection, and button 2 represents switching modes. The button control circuit is shown in Figure 4-10.

Figure 4-10 Button Control Circuit Schematic Diagram
8. Panel Description
There is a shell and a panel outside the PCB board. Since the buttons are designed on the front and the panel is on top of the shell, the buttons are ultimately pressed through the panel, as shown in Figure 4-11. As shown in Figure 4-12, the 3D effect of the panel, pressing the part in the red box in the figure will press the button.
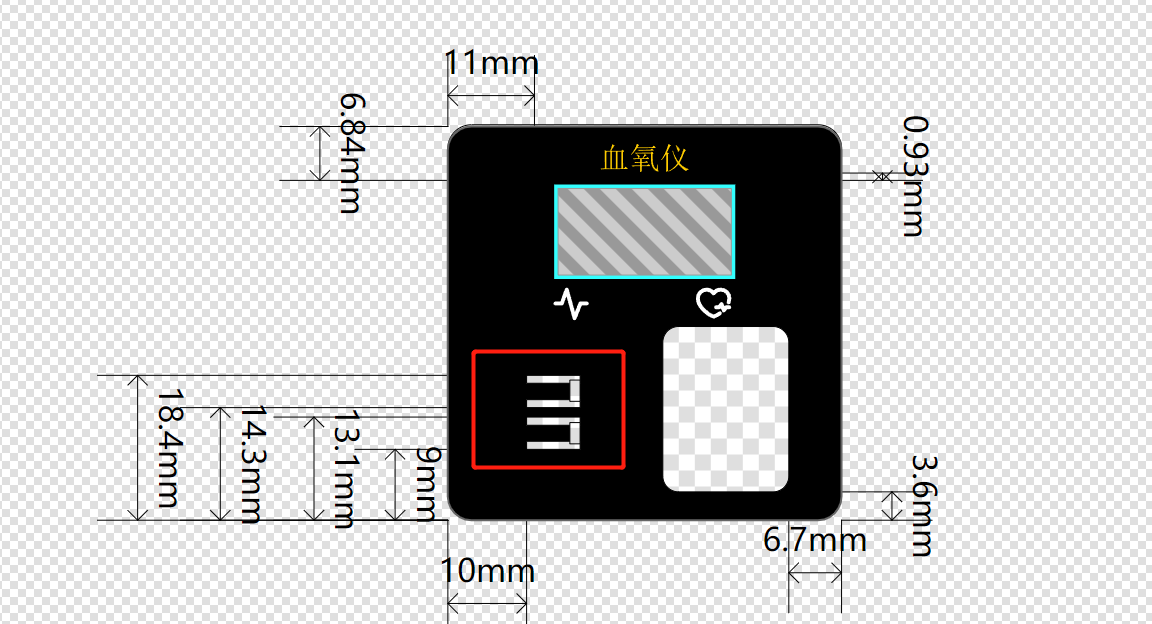
Figure 4-11 Panel Image
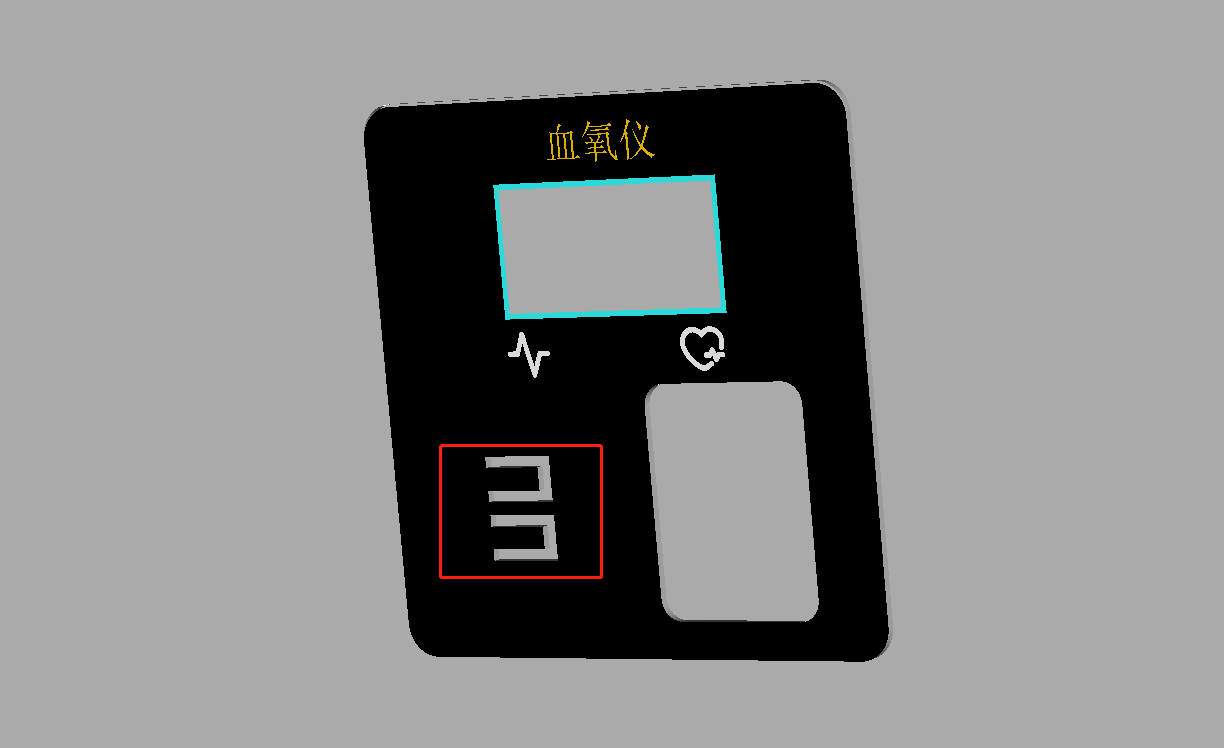
Figure 4-12 Panel 3D Rendering
9. Housing Description
When the housing thickness is too thick, the TYPE-C interface may not be easily accessible. In this case, the only option is to drill a large hole or thin the housing (this was my original approach). In this project, I used a method of drilling another hole outside the original TYPE-C through-hole outline, but not through it, as shown in Figure 4-13. The 3D effect is shown in Figure 4-14, and the actual effect is also very good, as shown in Figure 4-15.
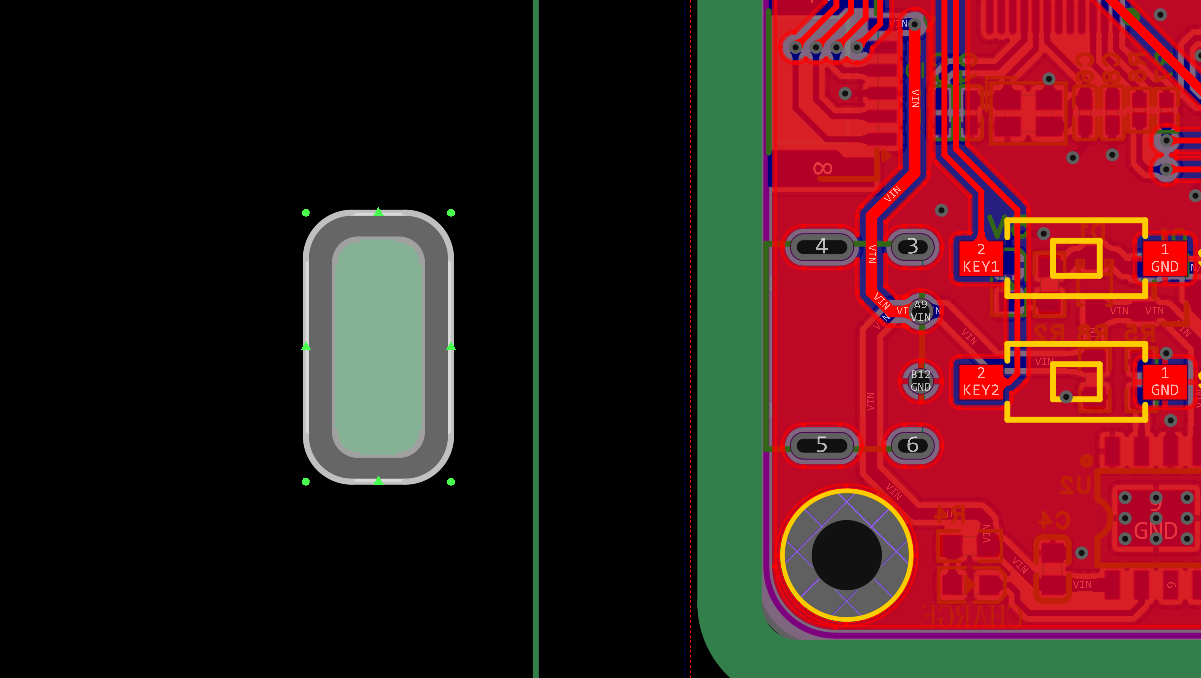
Figure 4-13 Housing Through-Hole PCB Image

Figure 4-14 Housing Through-Hole 3D Image
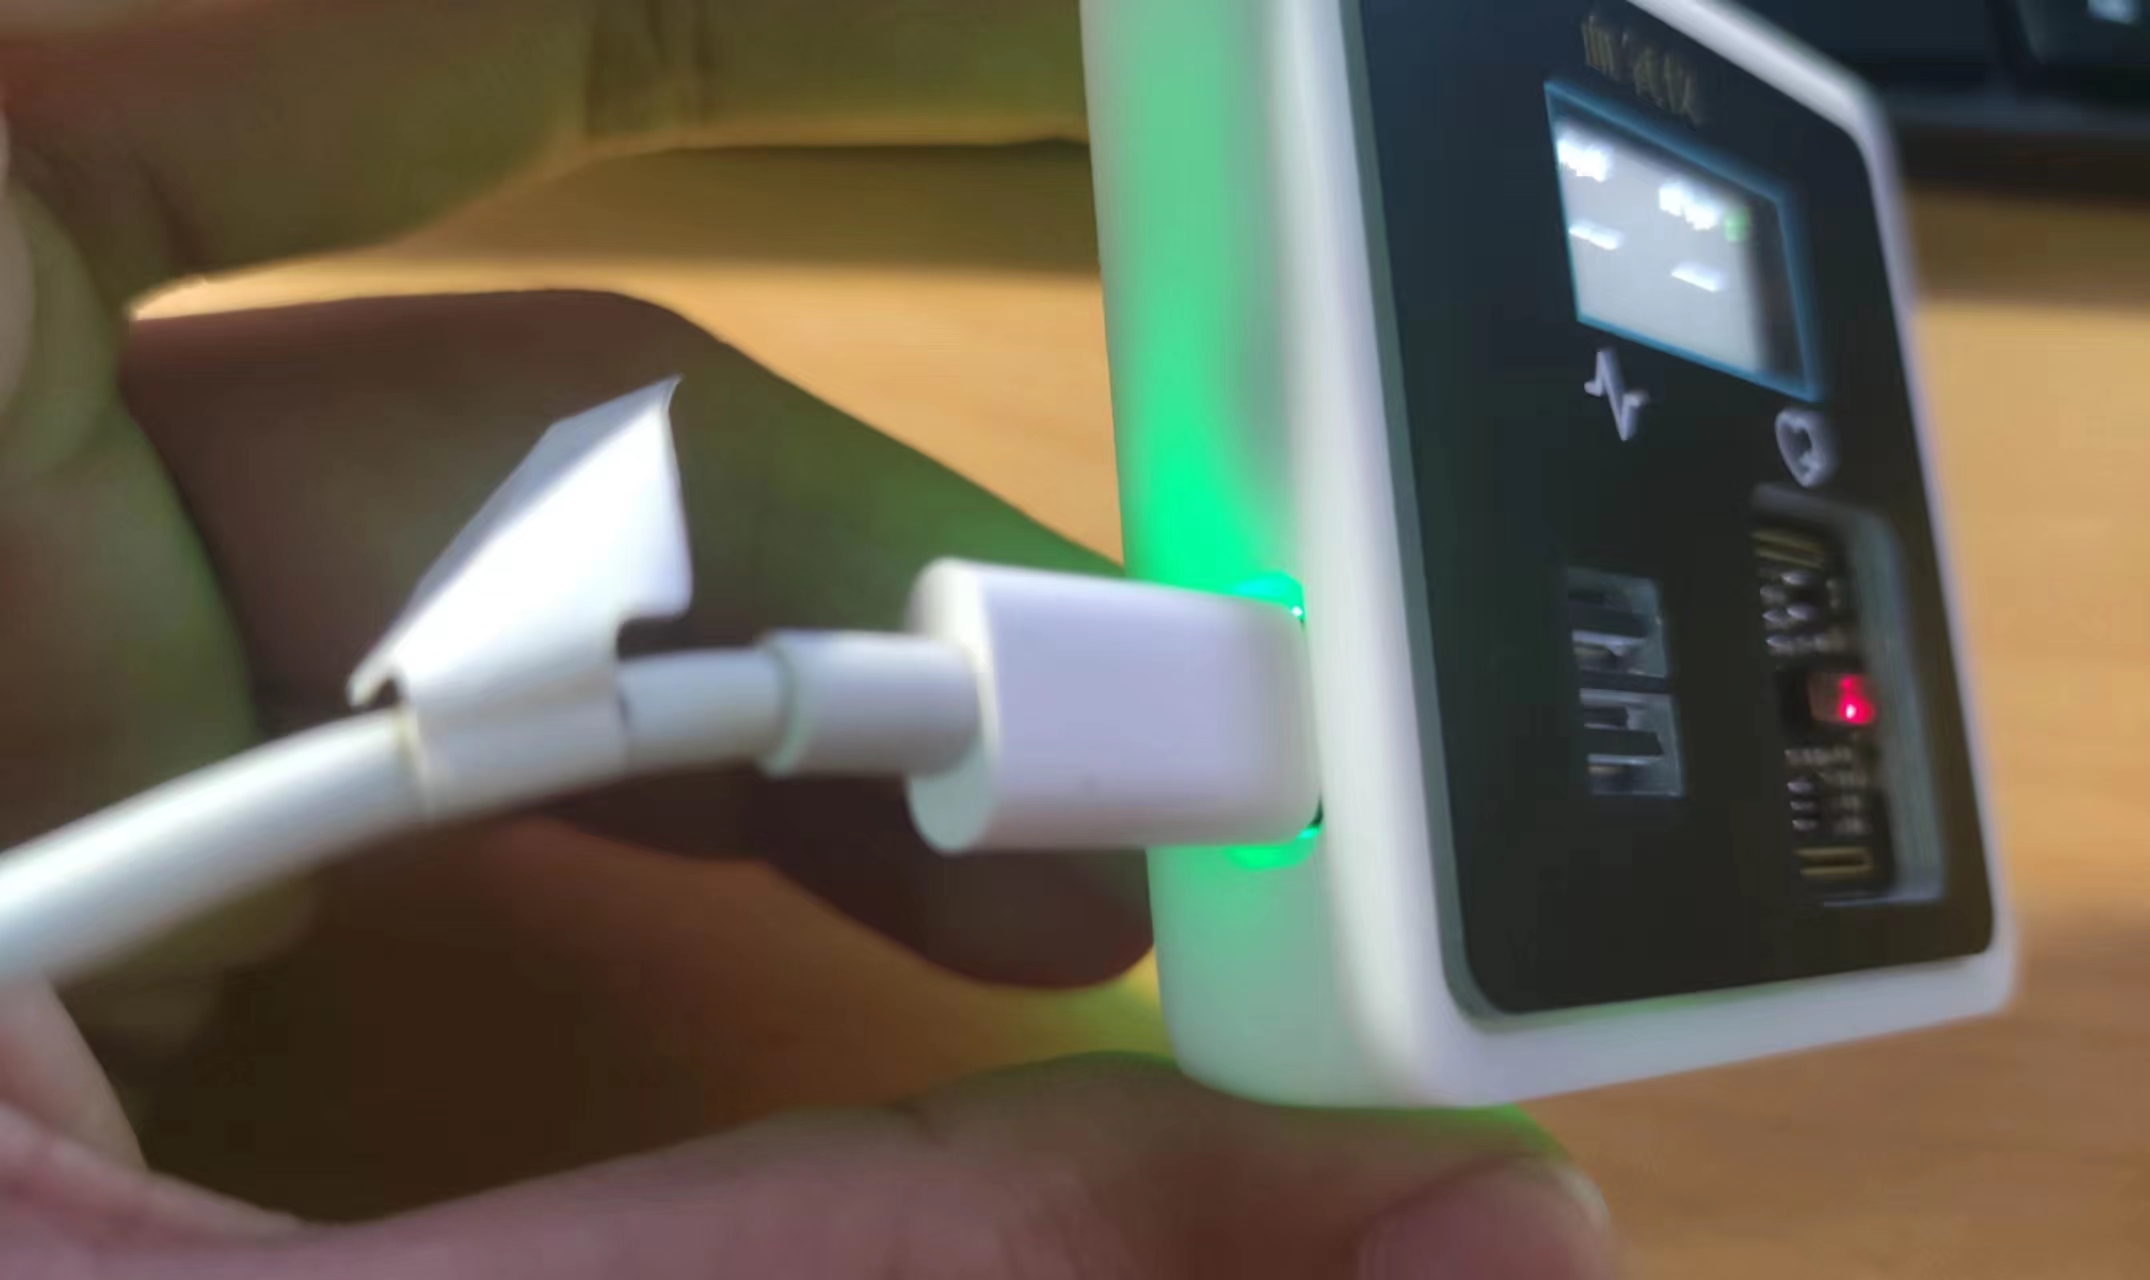
Figure 4-15 Housing Rendering The
above is all the content of the hardware part.
*5. Software Part
The software part of this project is divided into two aspects: program development and host computer debugging. The following will explain these two parts separately.
1. Program Development
For the program development, I used RASC and Keil for joint development. RASC was responsible for the chip initialization configuration, and Keil was responsible for writing the logic program. The development process of this project was both a learning process of programming and a learning process of new software. I mainly learned these two software programs through two channels: one was the official course of this training camp, the link is as follows: Making a Keil Electronic Clock Based on RASC; the other was Wildfire's tutorial course on Renesas, which currently has few video files and is mainly document-based, the link is as follows: [Wildfire] Renesas RA Series FSP Library Development Practical Guide. The configuration of these software programs can be referred to the tutorial content in the above links, so I will not elaborate further here.
1.1 RASC Initialization Configuration
Regarding the initialization configuration of RASC, the first step is stack configuration. The stack configuration of this project is shown in Figure 5-1 below.
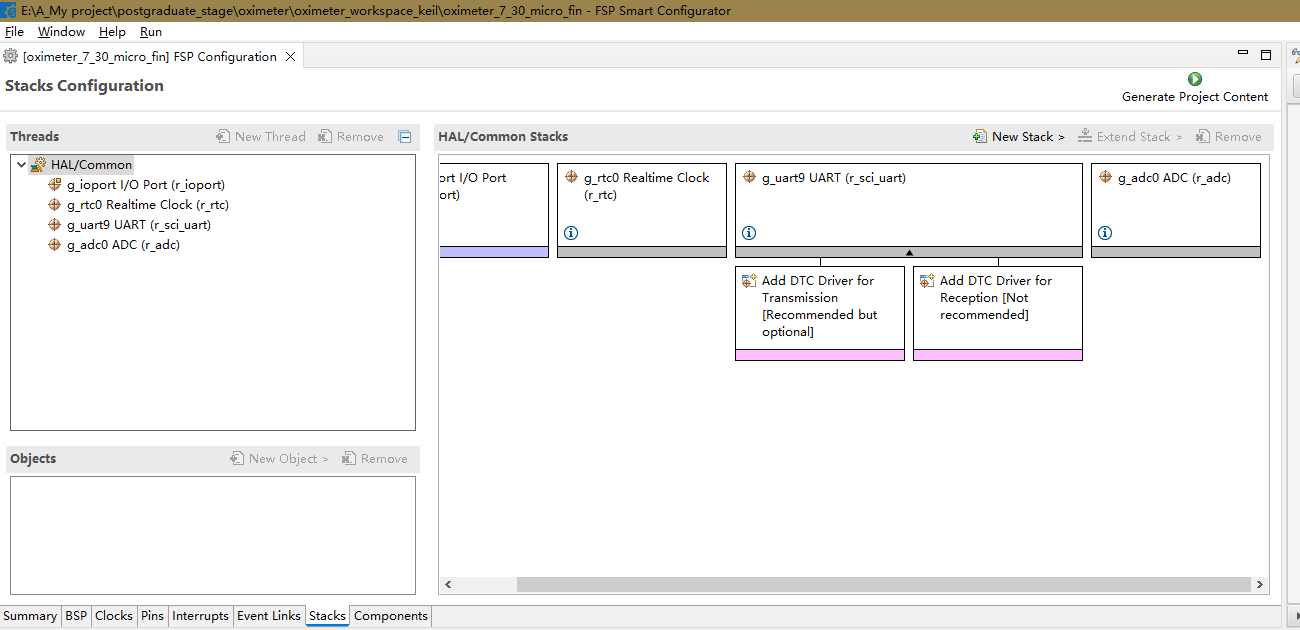
Figure 5-1 Stack Configuration
The stack used in this project mainly includes GPIO, RTC, UART, and ADC. Due to space limitations and the fact that GPIO, RTC, and UART have been explained in the tutorials above, I will not elaborate further here; I will only look at the ADC configuration. The ADC configuration is shown in Figure 5-2 below.
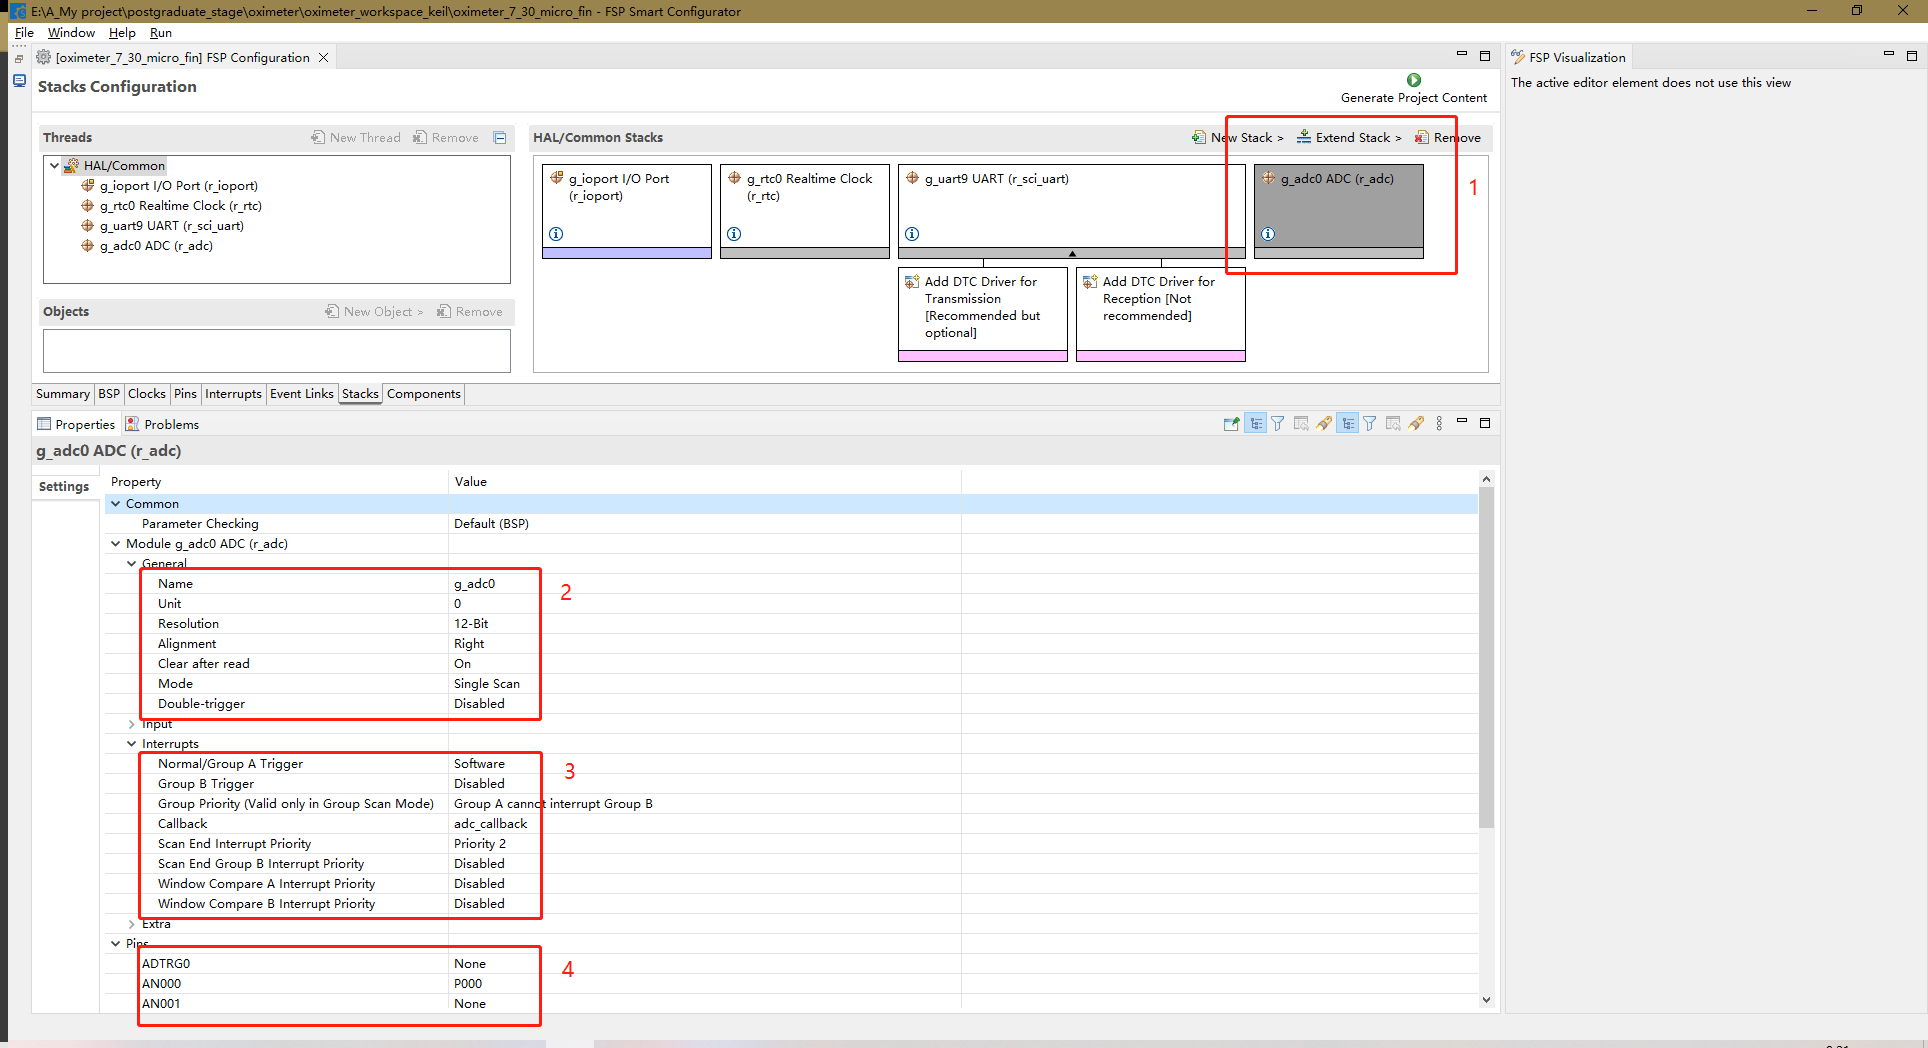
Figure 5-2 ADC_RASC Configuration Diagram.
Next is the RASC pin configuration for the chip. In this part, the pins related to IIC, SPI, ADC, LED, and buttons need to be configured. The IIC (Integrated Circuit) is used by the MAX30102. The IIC pins are software IIC, specifically pins P400 and P401, which are SCL and SDA respectively. These pins are configured as push-pull and open-drain outputs. SDA is configured as open-drain because data needs to be read while outputting. Besides the IIC pins, this section also includes an interrupt pin, INT, configured as a pull-up input. The SPI (Split SPI) is used for the screen. This section includes SPI pins and related screen pins, including chip select (CS-P015), reset (RES-P500), data/command control (DC-P100), data (SDA-P101), clock (SCL-P102), and backlight control (BLK-P103). Except for SDA, which is configured as an open-drain output, all others are configured as push-pull outputs. The LED pin is P001, configured as a push-pull output. The button pins are P914 and P013, both configured as pull-up inputs. The ADC pin configuration is different from the others, so it will be discussed later. There are many pins, so not all of them are shown in the diagram. Only one diagram is shown for each pin configuration type. Figure 5-3 below is the push-pull output configuration diagram, Figure 5-4 is the open-drain output configuration diagram, and Figure 5-5 is the pull-up input configuration diagram.

Figure 5-3 Push-pull output

Figure 5-4 Open-drain output
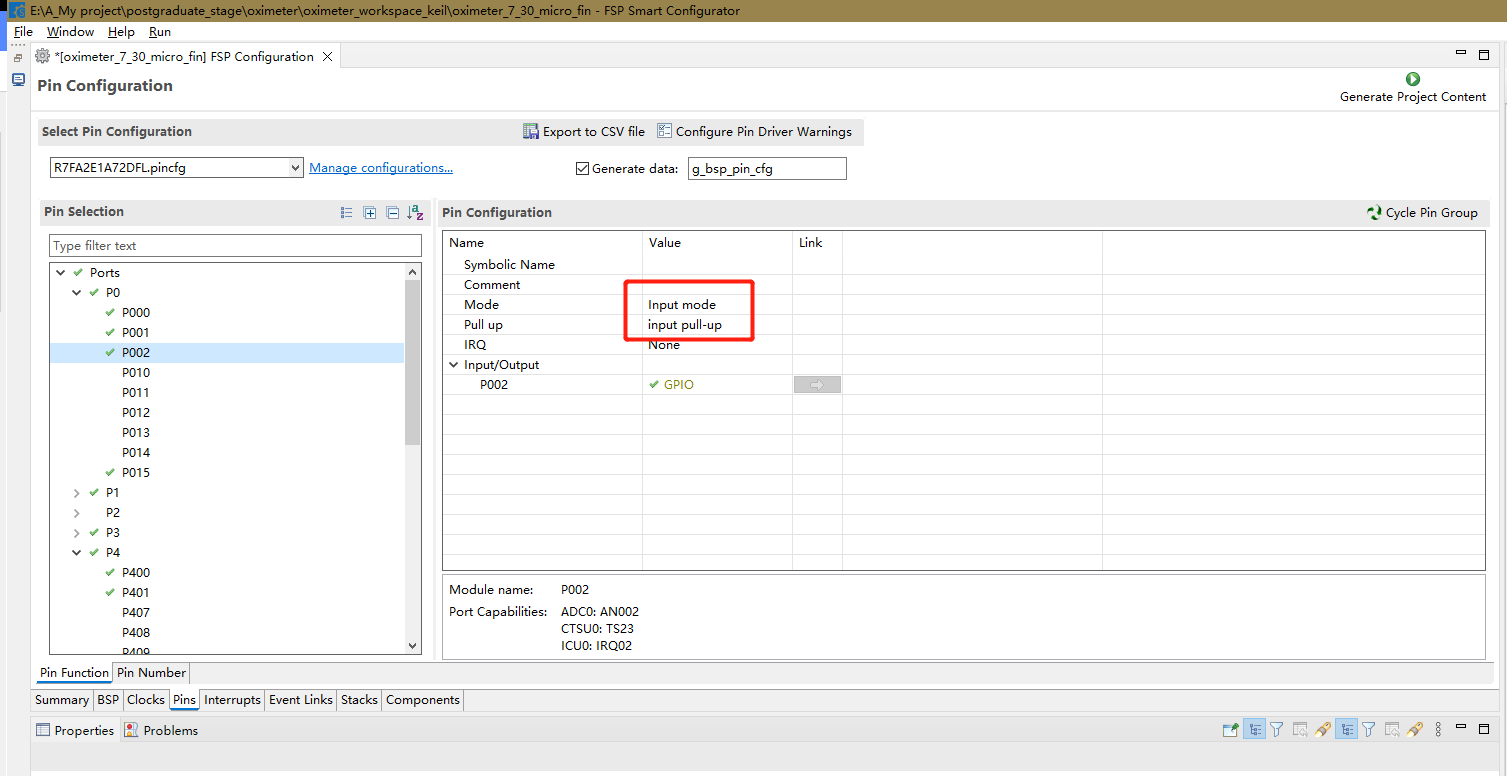
Figure 5-5 Pull-up input
ADC pin is P000, and the configuration diagram is shown in Figure 5-6 below.

Figure 5-6 ADC pin configuration diagram
The initialization configuration of RASC is now complete.
1.2 Keil logic program
1.2.1 Program description
The main flowchart of the Keil program is shown in Figure 5-7 below.

Figure 5-7 Main program flowchart
As can be seen from the main program flowchart, the program mainly consists of three functions: key scanning, sensor detection, and screen display, which are executed in a loop. The following is an explanation of the three functions.
First is the key scanning program. This program scans the key pins. When key 1 is pressed, it outputs 1; when key 2 is pressed, it outputs 2; when no key is pressed, it outputs 0. Continuous pressing is not supported. This function is based on the Zhengdian Atomic Keypad program, the link is as follows: Zhengdian Atomic Keypad Tutorial. The code is as follows:
//mode:0, does not support continuous pressing;1, supports continuous pressing;
//0, no key is pressed
//2, KEY1 is pressed
//3, KEY2 is pressed
//Note that this function has a response priority, KEY1>KEY2
uint8_t Key_Scan(uint8_t mode)
{
static uint8_t key_up=1;//Key release flag
if(mode)key_up=1; //Supports continuous pressing
if(key_up&&(KEY1_READ==0||KEY2_READ==0))
{
delay_ms(10);//Debouncing
key_up=0;
if(KEY1_READ==0)return 1;
else if(KEY2_READ==0)return 2;
}else if(KEY1_READ==1&&KEY2_READ==1)key_up=1;
return 0;//No key is pressed
}
The second is the sensor detection function, and the flowchart of this function is shown in Figure 5-8 below.
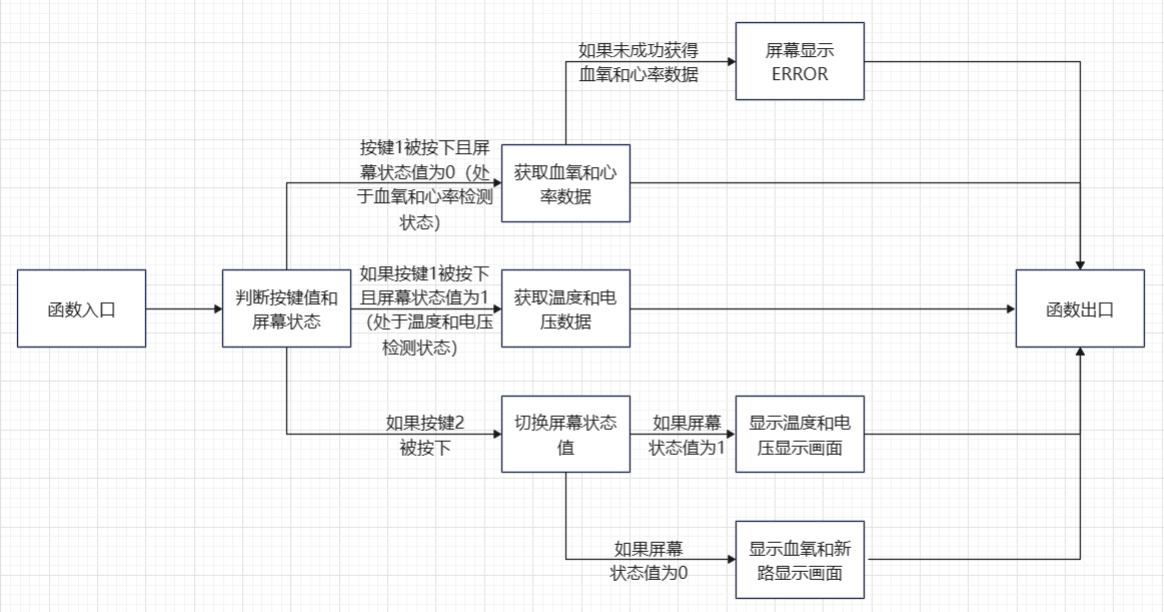
Figure 5-8 Flowchart of Sensor Detection Function.
As shown in the figure above, the main logic of this function is to perform a series of processes based on the key value and the screen status value. In summary, when key 1 is pressed, detection begins, but what is detected is determined by the screen status value. When it is the blood oxygen-heart rate status, heart rate and blood oxygen are detected; when it is the temperature-voltage status, temperature and voltage are detected. When key 2 is pressed, the screen status value is switched. The detection data is stored in a structure variable I defined, as follows:
`struct MAX30102{ uint32_t spo2_value; // Blood oxygen value uint32_t hr_value; // Heart rate value int8_t vaild_value; // Valid blood oxygen-heart rate detection value uint32_t n_ir_buffer_length; // Buffer length uint8_t temp_refresh_state; // Temperature detection refresh status float temp; // Temperature value float volt; // Voltage value };`
The sensor detection function code is as follows:
`void chedk_fuc(struct MAX30102 *max30102_data_ori, uint8_t key, uint8_t *lcd_state)
{
struct MAX30102 max30102_data = *max30102_data_ori;
if(key == 1 & *lcd_state == 0)` //When KEY1 is pressed and the LCD status is 0, blood oxygen and heart rate are detected
.
max30102_read_sp02_PR(&max30102_data);
if(max30102_data.vaild_value != 1)
{
LCD_Fill(0,22,LCD_W,LCD_H,BLACK);
LCD_ShowString(40,26,"error",RED,BLACK,32,0);
}
}
else if(key == 1 & *lcd_state == 1) //When KEY1 is pressed and LCD state is 1, check the voltage and temperature once
{
max30102_read_temp_volt(&max30102_data);
}
else if(key == 2) //When KEY2 is pressed, switch the display state
{
if(*lcd_state)
*lcd_state = 0;
else
*lcd_state =1;
LCD_Fill(0,0,LCD_W,LCD_H,BLACK); //Refresh the screen and display new content
if(*lcd_state)
{
LCD_ShowString(30,6,"temp",WHITE,BLACK,12,0);
LCD_ShowString(100,6,"volt",WHITE,BLACK,12,0);
LCD_ShowString(28,26,"--",WHITE,BLACK,32,0);
LCD_ShowString(100,26,"--",WHITE,BLACK,32,0);
max30102_read_temp_volt(&max30102_data);
}
else
{
LCD_ShowString(30,6,"%sp02",WHITE,BLACK,12,0);
LCD_ShowString(100,6,"PR bpm",WHITE,BLACK,12,0);
LCD_ShowString(28,26,"--",WHITE,BLACK,32,0);
LCD_ShowString(100,26,"--",WHITE,BLACK,32,0);
} The third function is the screen display function, whose flowchart is shown in Figure 5-9. Figure 5-9 Screen Display Function Flowchart.
As shown in the figure
, the main logic of this function is to perform a series of processes based on
the detected valid values and screen status values. In summary: when the valid value of the blood oxygen-heart rate detection is 1 and the screen status is blood oxygen-heart rate, the blood oxygen-heart rate data is displayed; when the valid value of the temperature-voltage detection is 1 and the screen status is temperature-voltage, the temperature-voltage data is displayed. Simultaneously, a counter is performed. After counting 5 times, the voltage status is checked. When the voltage value is greater than 4.35, a charging indicator "C" is displayed on the screen; otherwise, no status is displayed. Finally, all valid values are set to 0, making them invalid and preventing repeated display. The screen display function code is as follows: void LED_show_main(struct MAX30102 *max30102_data_ori, uint8_t lcd_state) { float volt; uint8_t count = 1; if(max30102_data_ori->valued_value && lcd_state == 0) { LCD_Fill(0,22,LCD_W,LCD_H,BLACK); LCD_ShowIntNum(29,26,max30102_data_ori->spo2_value,2,WHITE,BLACK,32); if(max30102_data_ori->hr_value { LCD_ShowIntNum(101,26,max30102_data_ori->hr_value,2,WHITE,BLACK,32); } else if(max30102_data_ori->hr_value >= 100) LCD_ShowIntNum(93,26,max30102_data_ori->hr_value,3,WHITE,BLACK,32); } if(max30102_data_ori->temp_refresh_state && lcd_state == 1) { LCD_Fill(0,22,LCD_W,LCD_H,BLACK); LCD_ShowFloatNum1(13,26,max30102_data_ori->temp,4,WHITE,BLACK,24); LCD_ShowFloatNum1(90,26,max30102_data_ori->volt,3,WHITE,BLACK,24); } if(count%5 == 1) //equivalent to loop 5 to check the charging status once { volt = 2 * Read_ADC_Voltage_Value(); if(volt > 4.35) LCD_ShowString(150,6,"C",GREEN,BLACK,12,0); else LCD_Fill(150,6,160,20, BLACK); count = 1; } count++;

`max30102_data_ori->valid_value = 0; // Prevent multiple screen refreshes
max30102_data_ori->temp_refresh_state = 0;
}`
1.2.2 Supplementary Explanation
Besides the above, there are a few other points to explain in this project's program.
First, regarding the MAX30102 processing algorithm, this project is based on the source code provided by a Taobao seller. This source code requires processing 500 data points per calculation, which cannot be met in this project, so it has been reduced to 100 data points. Reducing the data may affect the detection accuracy. Multiple detections can be performed, and mean filtering can be applied to improve detection accuracy. This function has been implemented in the code of this project. You can modify the `MAX_effective_detection_number` variable in the `max30102_read_sp02_PR` function in the `max30102.c` file. This variable represents the maximum number of effective detections. In the function, it means that as long as the number of successful detections reaches `MAX_effective_detection_number`, the detection is considered effective, and the data will be averaged according to `MAX_effective_detection_number` at the end. However, note that the `max30102_read_sp02_PR` function also contains the `MAX_detection_number` variable, which represents the maximum number of detections. `MAX_effective_detection_number` cannot exceed `MAX_detection_number`. The locations of these two variables are shown in Figure 5-10.

Figure 5-10: Mean filtering related code diagram
. Next is the proximity mode setting. Proximity mode refers to the mode that detects whether a finger is placed on the sensor. Enabling it can greatly reduce the false detection rate. Proximity mode essentially detects whether the value reflected back from the LED meets the condition of a finger being placed on the sensor. Based on this idea, we can set a threshold. When the average of 100 sampled values is greater than this value, it means the finger is normally placed on the sensor; when it is less than this value, it means there is an error and the data is invalid. This code is located in the `maxim_heart_rate_and_oxygen_saturation` function in the `algorithm.c` file. Figure 5-11 is the proximity mode program diagram.

Figure 5-11: Proximity mode related code
. This concludes the entire program development process.
2. Host Computer Debugging:
In order to test whether the MAX30102 has successfully detected the required PRG pulse wave signal, this project uses an anonymous host computer to display the data collected by the MAX30102 in the form of waveforms.
void AnoPTv8TxFrameF1_assistant(int32_t _ir, int32_t _red)
{
uint8_t i;
uint8_t sumcheck = 0;
uint8_t addcheck = 0;
uint8_t _cnt=0;
// Default is fine
databuf[_cnt++] = 0xAB;
databuf[_cnt++] = 0x01;
databuf[_cnt++] = 0xFE;
databuf[_cnt++] = 0xF1;
// Use these two bits to represent the number of bytes of data
databuf[_cnt++] = 8;
databuf[_cnt++] = 0;
databuf[_cnt++] = BYTE0(_ir);
databuf[_cnt++] = BYTE1(_ir);
databuf[_cnt++] = BYTE2(_ir);
databuf[_cnt++] = BYTE3(_ir);
databuf[_cnt++] = BYTE0(_red);
databuf[_cnt++] = BYTE1(_red);
databuf[_cnt++] = BYTE2(_red);
databuf[_cnt++] = BYTE3(_red);
for(i=0;i
{
sumcheck+=databuf[i];
addcheck+=sumcheck;
}
databuf[_cnt++]=sumcheck;
databuf[_cnt++]=addcheck;
R_SCI_UART_Write(&g_uart9_ctrl, databuf, _cnt);
while(uart_send_complete_flag == false);
uart_send_complete_flag = false; The
above
code is written based on the flexible format frames in the anonymous communication protocol, which can display the sent data as a waveform. It's important to note that the serial port data sending function at the end of this code cannot be changed to the printf function, because the printf function will change the format of the data sent, resulting in the serial port receiving end receiving data that is not what we want to send. Using the R_SCI_UART_Write function will send the data to the receiving end unchanged, ensuring normal communication. The anonymous communication protocol PDF file has been attached; you can download and view it if needed.
For information about the Anonymous Assistant software, please refer to the official Anonymous Assistant video, link below: Anonymous Assistant Host Computer Public Beta Version Introduction Video. Although it seems to have only been in public beta for a short time, this Anonymous Assistant is exceptionally easy to use.
That concludes the software section.
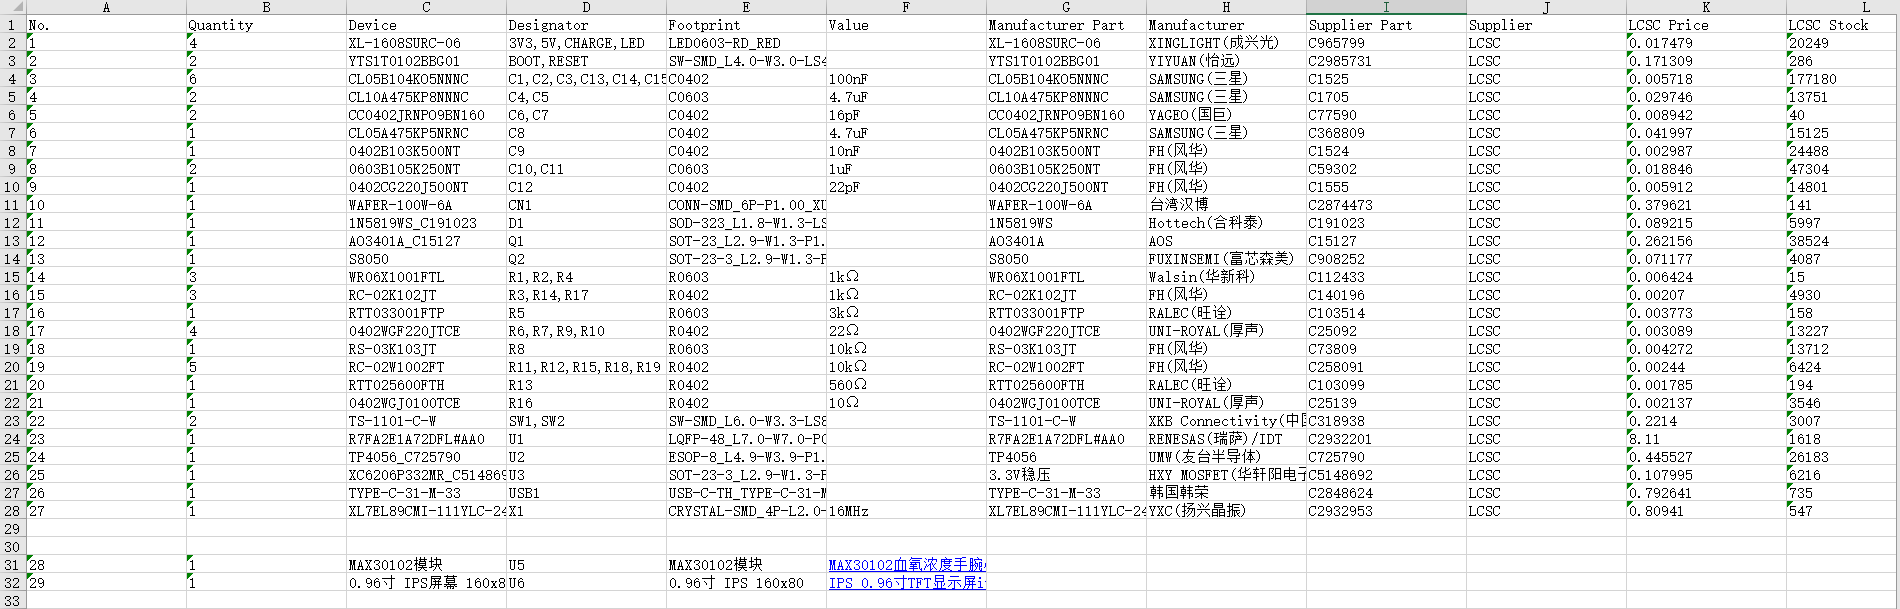
*6. BOM List
*7. Competition LOGO Verification

*8. Precautions
1. Since the MAX30102 module is used, the circuit is directly exposed, so please keep your hands dry and avoid short circuits during use.
2. Due to equipment limitations, the pulse oximeter in this project has not been experimentally calibrated and has poor accuracy. It is only suitable for testing or approximate detection and is not applicable to medical applications.
* 9. Attachment Description
1. BOM (Bill of Materials) (arranged by number)
2. Final Program
3. Anonymous Host Computer Test Program (The final program can also be debugged on a host computer, but this is not as convenient)
4. Anonymous Communication Protocol
5. A demonstration video of the overall function of the pulse oximeter
6. A test video of the pulse oximeter after exercise
7. A video of testing waveforms using Anonymous Assistant
*10. Reference
1. Reference Links
(1) MAX30102 High-sensitivity pulse oximeter and heart rate sensor for wearable health devices
(2) [LCSC Electronic Design Contest] Design of desktop electronic clock based on Renesas
(3) Keil electronic clock based on RASC
(4) [Wildfire] Practical guide to the development of Renesas RA series FSP library
(5) Tutorial on Zhengdian Atomic Keys
(6) Introduction video of the Anonymous Assistant host computer public beta version


 京公网安备 11010802033920号

 XC6201P211ML