Foreword:
1. This AFE03 expansion board requires the STM32H750VBT6 core board from Hardwood Classroom.
2. For detailed technical documentation of the core board, please refer to the official Hardwood Classroom documentation: Hardwood Classroom - Simple Oscilloscope (yuque.com).
3. LCSC Open Source Plaza: [Hardwood Classroom] AFE03 Oscilloscope Signal Source Expansion Board - LCSC EDA Open Source Hardware Platform (oshwhub.com).
4. 24pF and 220pF capacitors may cause inaccurate peak-to-peak value measurements; it is recommended not to solder them.
I. Project Description
This is an oscilloscope + signal source analog front-end expansion board used with the STM32H750VBT6 core board. Its main functions and characteristics:
1. Analog Input Section (INA/INB)
Number of Channels: Synchronous dual-channel
Sampling Rate/Bandwidth: 2MSPS/100KHz
Input Range: ±10mV ±15V
Input Impedance: 1MΩ
2. Analog Output Section (COM4)
Number of Channels: 1
Output Signal Waveform Types: Sine wave, square wave, triangle wave
Output Sine Signal Frequency: 1Hz - 20KHz
Output Range: +10V~-10V
Output Impedance: 50 ohms
Output Current Capability: ±10mA
II. Introduction to STM32H750 Core Board For
detailed technical documentation, please refer to the official documentation of Hardwood Classroom - Simple Oscilloscope (yuque.com)
III. Hardware Design Description
The pin connection positions of the core board and the expansion board are the same, and the oscilloscope expansion board can be directly plugged into the core board.

Oscilloscope Channel Introduction:

First, we need to understand that when the VREF of the STM32H750 is powered by 3.3V, the input range of the STM32's ADC is 0-3.3V. However, our maximum input signal is ±15V. Therefore, we need to solve the problem of large signal input not saturating. Let's solve an equation:
15*a+b = 3.3
-15*a+b = 0.
This gives us a=0.11 and b=1.65.
In other words, we need to attenuate the input signal to at least 0.11 times (approximately 1/9) and add 1.65V DC to meet the full-scale input of the ADC. Therefore, we use the following operational amplifier circuit. The resistor network achieves 1/20 attenuation, and the operational amplifier performs a 2x amplification and a 1.65V voltage shift, thus achieving 0.1INB + 1.65V.
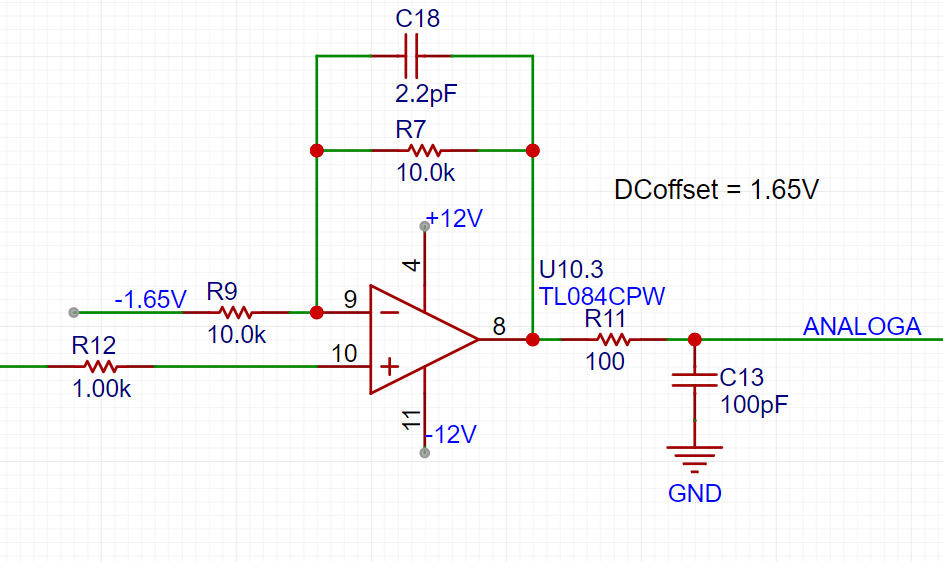
We can use the superposition theorem to analyze this circuit. First, when analyzing the contribution of the input signal INB to the output Vo, we ground the other voltage source in the circuit, -1.65V. This way, the input signal is divided to 1/20 after passing through R14 and R18, and then amplified by a factor of 2 by the non-inverting amplifier circuit. The overall gain of the input signal is 1/10. When analyzing the contribution of -1.65V to the output, we ground the input signal AIN, and the amplification factor of -1.65V is -1. Therefore, we obtain the output Vo = -1.65V * (-1) + AIN/10 = 1.65V + AIN/10.
-1.65V is obtained from -12V through a resistor divider and buffer.

The circuit above solves the problem of matching the ±15V input to the ADC's 0-3.3V input range. We also need to consider accurate sampling even with small input signals. For example, a 10mV signal will attenuate to 1mV after passing through the circuit. To maximize the signal-to-noise ratio of the input signal, we add a switching mode to the analog front-end. When acquiring small signals, a switch is used to select the direct-through signal (INB) to the op-amp's non-inverting input, instead of selecting the attenuated signal from INB. This ensures the signal entering the ADC is as large as possible. Combined with a 16-bit ADC, this ensures accurate and reliable sampling results.
INA and INB: These are the oscilloscope input terminals. Here, a 1MΩ input impedance is achieved through a series resistor divider, generating two signals for selection: one for direct input and one attenuated to 1/20.
Note that the 24pF and 220pF filter capacitors at the input do not need to be soldered; soldering will cause excessive peak-to-peak shift on the oscilloscope expansion board.
Gain: A selector switch that chooses either a direct signal or a signal attenuated to 1/20th of its input to the first-stage non-inverting amplifier. The non-inverting amplifier performs two functions: first, it amplifies the input signal at the non-inverting input by a factor of two; second, it shifts the amplified signal by 1.65V, calculated as Vo = 1.65 + 2*Vi. Therefore, the overall gain of the corresponding circuit is either 2 times or 1/10 times.
AnalogA, AnalogB: The amplified and shifted analog signals from the non-inverting amplifier are connected to the STM32H750 development board and enter the H750's ADC.
TrigerA, TrigerB: The square wave signals generated by AnalogA, AnalogB, and the DC reference level (generated by one of the H750's DACs) after passing through a comparator, enter the STM32H750's timer for frequency measurement.
Oscilloscope signal source introduction:

DAC_OUT2: The DC reference level, emitted through the STM32H750's internal DAC2 configuration. This includes signal conditioning implemented with resistor voltage dividers and operational amplifiers, and a square wave output implemented with a comparator (for triggering and frequency measurement). The STM32H750's DAC1 output ranges from 0 to 3.3V. A second-order RC filter implements a low-pass filter function. The signal source power supply section uses resistor voltage dividers and buffers to convert the 5V input to a low-impedance 2V output, which is then amplified by -5 times for output signal shifting. The output amplifier performs two functions: first, it amplifies the non-inverting input by 6 times; second, it shifts the 6-fold amplified signal by -10V before outputting it, calculated using the formula Vo = -10 + 6 * Vi. A voltage divider network is used to achieve better results when outputting small signals by utilizing analog circuit voltage division.
When the VREF of the STM32H750 is powered by 3.3V, the output range of the internal DAC is 0-3.3V. To achieve the ±10V output required in the problem, we need to solve the equations:
0*a + b = -10V
and 3.3*a + b = 10V.
Solving these equations, we get a = 6.06 and b = -10,
which allows us to design the circuit shown in the diagram above.
The 0-3.3V signal output from the STM32H750's internal DAC, after passing through a low-pass filter, is input to the non-inverting input of the TL082, forming a non-inverting amplifier with a gain of 6. The amplified waveform is 0-19.8V. Then, utilizing the -5x amplification capability of the TL082's inverting amplifier section, the +2V obtained from the 5V voltage divider is amplified by -5x to obtain -10V, which is then superimposed on the 0-19.8V signal output from the non-inverting amplifier to obtain an approximately ±10V output. The calculation formula is: Vout = 6*Vin -10.
Similar to ADCs, the resolution of a DAC is crucial for achieving a signal source output covering ±10mV to ±10V while balancing a large signal range and small signal precision. The H750's DAC is 12-bit, with a full-scale output (using all 4096 code values) of ±10V. When reducing the DAC code value to output a small signal, to achieve a 7-bit voltage resolution (128 vertical points), the waveform must be attenuated by 128/4096 = 1/32. This translates to an output voltage range of ±10V/32 = ±0.3215V. For signals smaller than ±0.3125V, further reducing the code value results in insufficient DAC resolution, leading to noticeable waveform steps. Therefore, we use analog voltage division. When outputting signals smaller than ±0.3125V, a switching resistor divider attenuates the waveform by 1/20, ensuring sufficient voltage resolution for small signals. Meanwhile, the combination of R57 and R62 makes the output resistance of the circuit 50Ω at 1/20 attenuation, and R5 makes the output resistance of the circuit 50Ω at x1.
Comparator Circuit:
To implement the trigger function and frequency counter function, we designed two comparator channels on the board to convert the waveforms of the two analog input channels before entering the ADC into square wave signals for use as timer inputs of H750. The reason for using the waveforms before entering the ADC for comparison is that the waveforms entering the ADC have been conditioned by the front-end analog circuit and have fallen within the known 0-3.3V range, making the comparison threshold of the comparator easier to design.
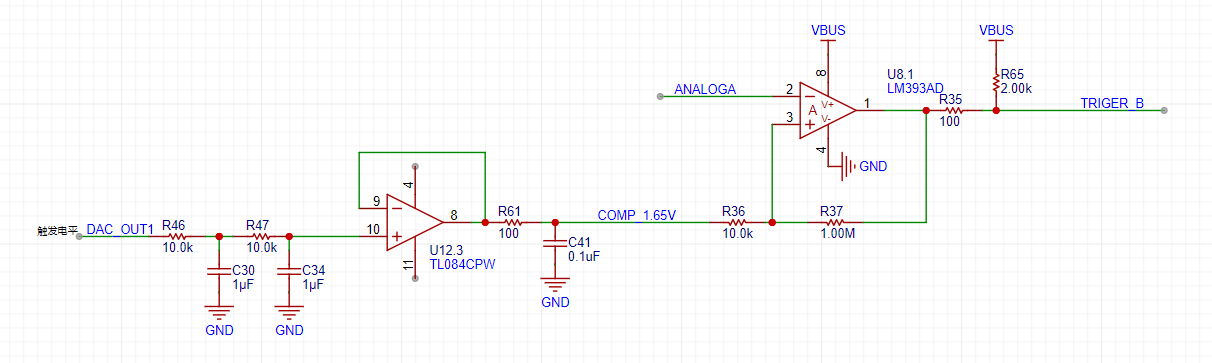
As shown in the figure above, H750 uses the internal DAC2 to output a 0-3.3V DC to compare with the waveform of channel 2 before entering the ADC, converting the waveform of channel 2 into a square wave. In this way, the timer function of H750 can use the square wave signal for interrupt processing and timer capture processing.
Power Management Module:
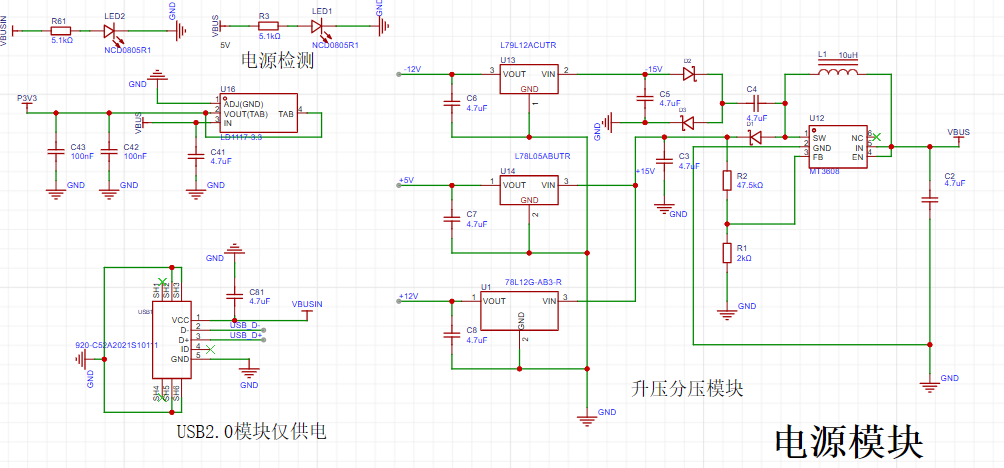
The design uses the MT3608 chip for DC-DC boost conversion. Note the difference between the L78 and L79 series LDO linear regulators. Keypad
Introduction:

Four function buttons control the oscilloscope interface: SW1 moves the cursor right, SW2 moves the cursor left, SW3 switches between channel 1 and 2, and SW4 switches the DAC.
Rotary Encoder Introduction:
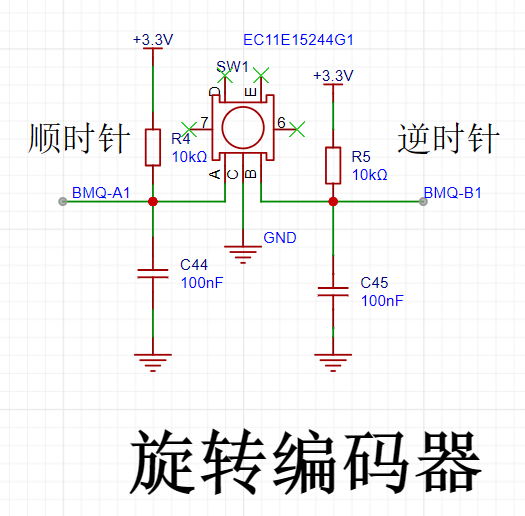
Uses an EC11 through-hole type knob. The center button is not functional; rotating left increases the value, and rotating right decreases it.
OLED Display Introduction:

The same display purchased from Taobao
is important (showing a white screen): My project progress was significantly delayed due to the screen issue, mainly because it displayed a white screen. The Hardwood Classroom official documentation provides detailed testing steps for this section; please refer to Chapter 2, Quick Refresh (yuque.com), specifically the LCD testing section. It is recommended to directly measure the waveform of the screen socket pins to prevent problems caused by poor soldering or contact. Generally, the core board output should not have this issue.
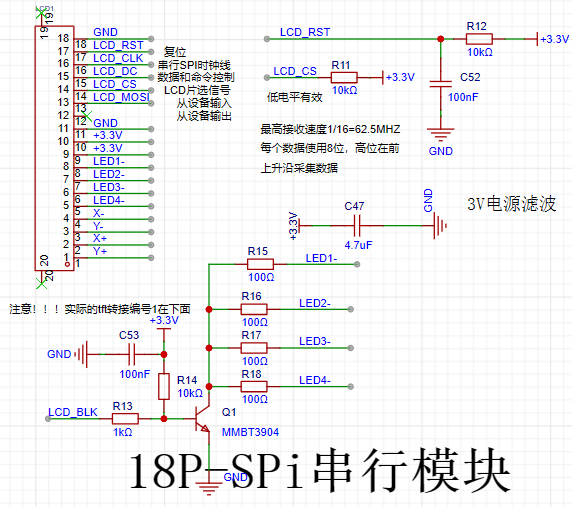
I designed a simple LCD adapter test board to test
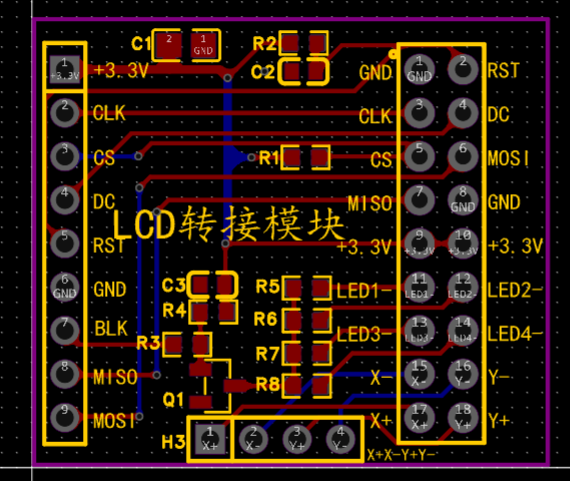
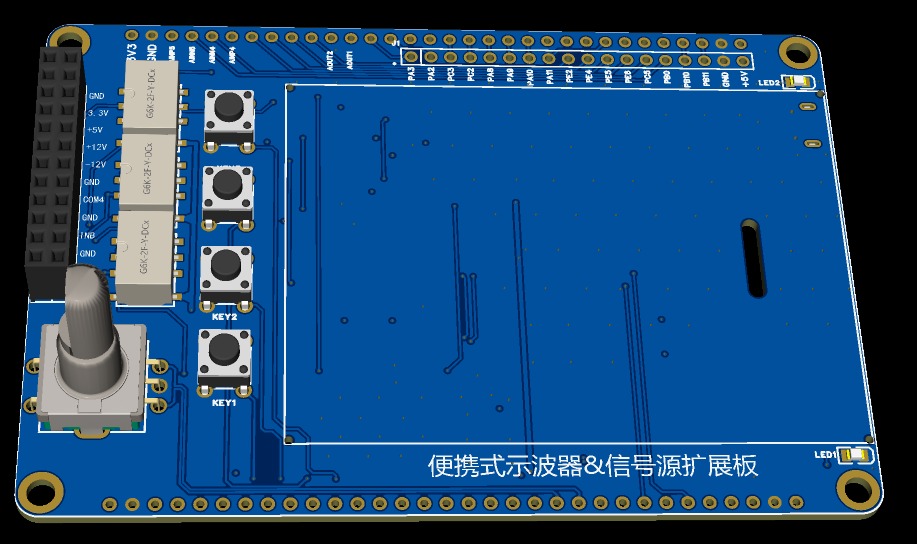
the PCB routing and casing:

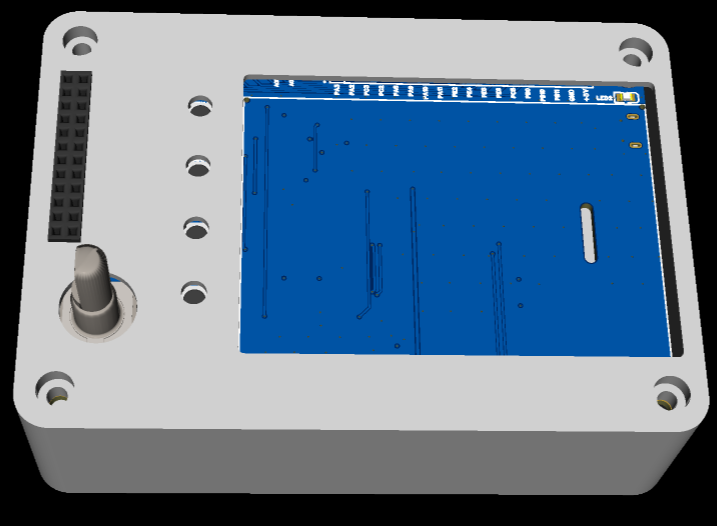
PCB 3D diagram:

PCB 3D Shell Display:
IV. Software Design Description
When connecting to the computer and opening the burning file "5_DAC_1" to run Keil, it will prompt you to install the STM32 runtime library. Just follow the prompts to install it. Please see the attachment for
the flash programming algorithm
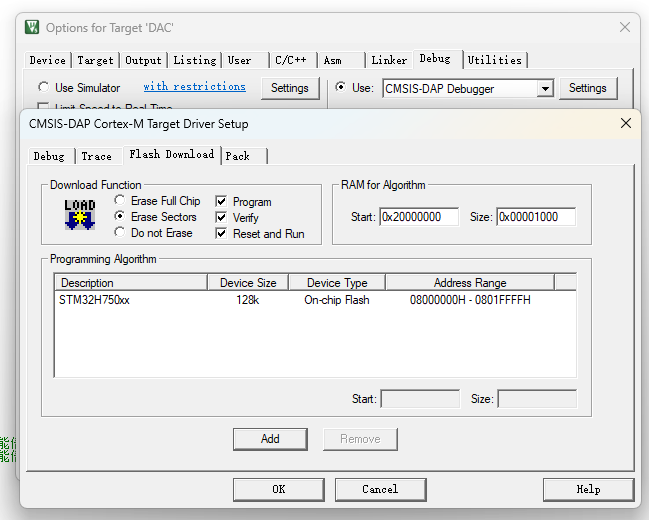
code. I won't go into too much detail here.
Oscilloscope Interface Introduction:

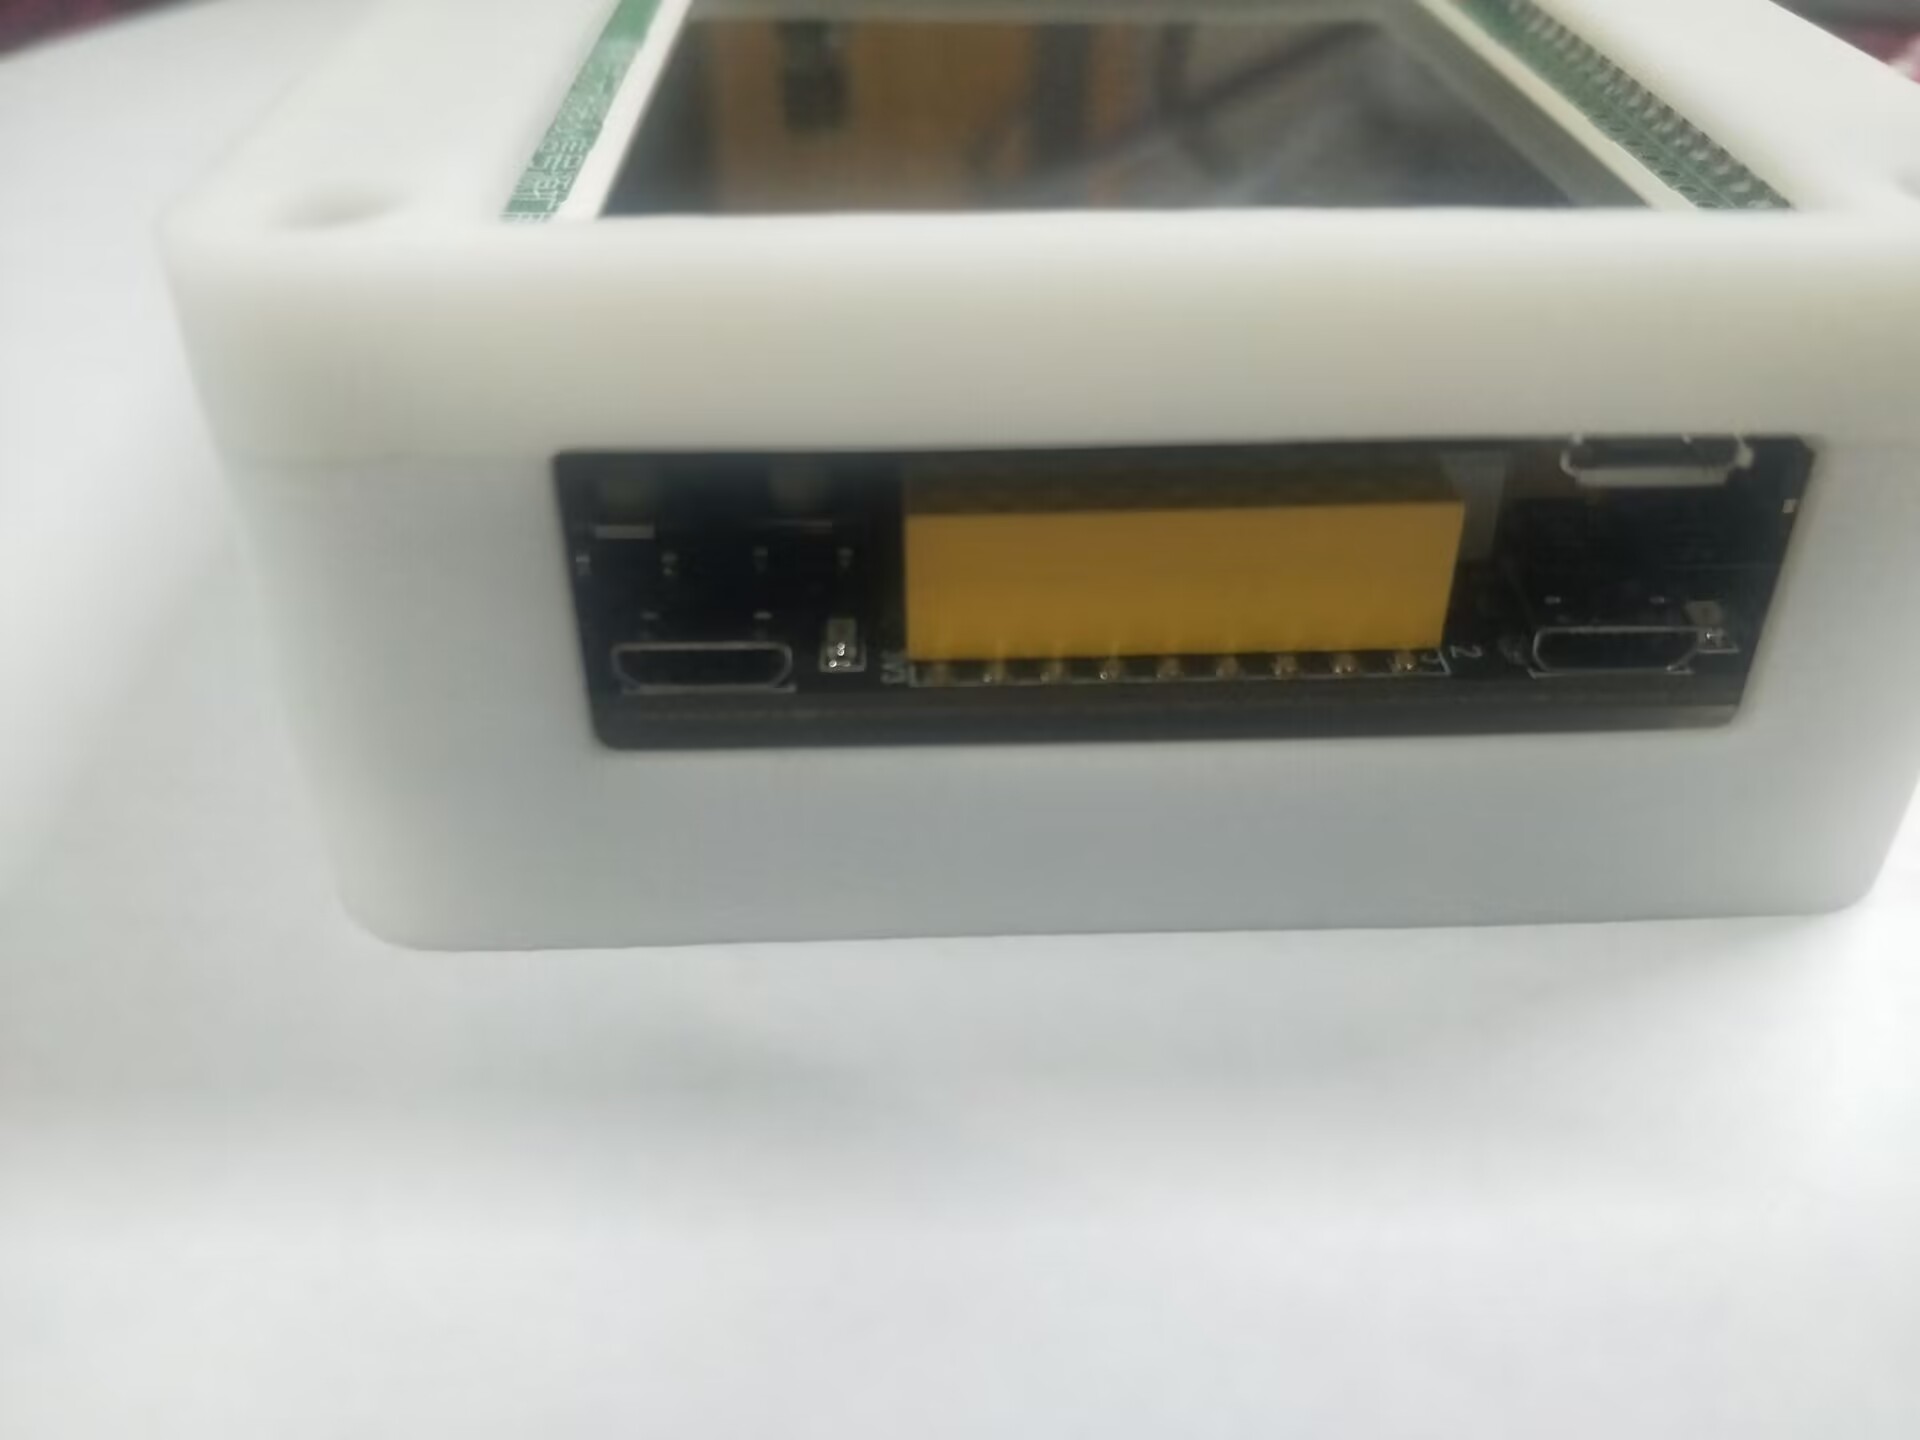
V. Physical Display
Front of Simple Oscilloscope

Back of

Simple Oscilloscope Side of Simple Oscilloscope
VI. Precautions
24pF and 220pF capacitors may cause inaccurate peak-to-peak value measurements. It is recommended not to solder them.
During the soldering process, it is recommended to solder and test a section at a time to avoid short circuits in one place that could ruin the entire circuit. Here, I soldered the power module first and then soldered the other parts.
VII. Demonstration Video
Tips: The demonstration video can be uploaded as an attachment. The maximum file size for an attachment is 50MB. Files larger than 50MB can be placed on other cloud storage or video websites. Just put the address link here.
VIII. Attachment Contents
Attachment 1: PCB board Gerber file
Attachment 2: PCB board BOM file
Attachment 3: Oscilloscope shell file


 京公网安备 11010802033920号

 M55342K04B117BMTS