The circuit shown in Figure 1 is a 12-bit, 1 MSPS data acquisition system using only two active devices. The system operates on a 3.3 V single supply and is capable of processing charge input signals from piezoelectric sensors with a total calibrated error of less than 0.25% FSR over a ±10°C temperature range, making it ideal for a variety of laboratory and industrial measurements. select.
The circuit's small size makes the combination an industry-leading solution for data acquisition systems where accuracy, speed, cost and size are critical.


The circuit consists of an input signal conditioning stage and an ADC stage. The current input signal is converted to voltage by a charge-to-voltage converter (charge amplifier of op amp U1A and capacitor C2) and amplified by a non-inverting amplifier (op amp U1D and resistors R7 and R8). The reference voltage of the ADC (VREF =2.5 V) is buffered and attenuated (op amps U1B and U1C and resistors R1 and R2) to produce an offset HREF of 1.25 V, which is used to condition the AC signal from the sensor to within the input range of the ADC . Operational amplifiers U1A, U1B, U1C, and U1D are all quad AD8608s. The output of the U1D op amp is 0.1 V to 2.4 V, matching the input range of the ADC (0 V to 2.5 V) while providing 100 mV of headroom to maintain linearity. The resistor and capacitor values can be modified to accommodate other sensor ranges described in this circuit note.
The AD8608 has a minimum rated output voltage of 50 mV (2.7 V supply) and 290 mV (5 V supply), a load current of 10 mA, and a temperature range of -40°C to +125°C. With a 3.3 V supply, load current less than 1 mA, and a narrower temperature range, a conservative estimate of the minimum output voltage is 45 mV to 60 mV.
The circuit design supports single power supply.
Taking into account device tolerances, the minimum output voltage (lower end of range) is set to 100 mV to provide a safety margin. The upper limit of the output range is set to 2.4 V to provide 100 mV of headroom for positive swings at the ADC input. Therefore, the nominal output voltage range of the input op amp is 0.1 V to 2.4 V.
The AD8608 was chosen for this application because of its low bias current (1 pA maximum), low noise (12 nV/√Hz maximum), and low offset voltage (65 μV maximum). At 3.3V supply, power consumption is only 15.8 mW.
The output stage of the op amp is followed by a single-pole RC filter (R6/C8) to reduce out-of-band noise. The cutoff frequency of the RC filter is set to 664 kHz.
The AD7091R 12-bit 1 MSPS SAR ADC was chosen because of its ultra-low power consumption of only 349 μA at 3.3 V (1.2 mW), which is significantly lower than any competing ADC currently on the market. The AD7091R also has an internal 2.5 V reference with a typical drift of ±4.5 ppm/°C. The input bandwidth is 7.5 MHz, and the high-speed serial interface is SPI-compatible. The AD7091R is available in a small 10-pin MSOP package.
When powered from a 3.3V supply, the total power consumption of this circuit is approximately 17 mW.
The AD7091R requires a 50 MHz serial clock (SCLK) to achieve a 1 MSPS sampling rate. In most piezoelectric sensor applications, lower sampling rates can be used. For the test data used in this circuit note, the SCLK was 30 MHz and the sampling rate was 300 kSPS.
The digital SPI interface can be connected to the microprocessor evaluation board using a 12-pin PMOD compatible connector (Digilent PMOD specification).
circuit design
The circuit shown in Figure 2 converts the input charge to a voltage and level-shifts it into the ADC's input range (0.1 V to 2.4 V).


Piezoelectric elements are commonly used to measure acceleration and vibration. Here the piezoelectric crystal is used together with the mass m. When the mass block is affected by acceleration a, an inertial force F = m × a will be generated on the mass block and the piezoelectric crystal. Therefore, the crystal acquires a charge q = d × F, where d (in coulombs/newtons, C/N) is the sensitivity of the crystal charge to force.
Therefore, the steady-state charge sensitivity Sa of the piezoelectric accelerometer is S a = Δq/Δa (unit is C × s2/m).
Note that acceleration can be converted to g using the relationship 1 g = 9.81 m/s2.
If an accelerometer is used with a charge amplifier with feedback capacitor C2 (as shown in Figure 2), the voltage formed on C2 due to charge Δq is ΔV = Δq/C2. The corresponding steady-state voltage sensitivity is:

The first stage of the signal conditioning circuit in Figure 1 is the charge amplifier (U1A and capacitor C2), where the output voltage varies according to Equation 1. The output of this circuit is converted to handle bipolar input signals (such as vibration measurements). Using a 1.25 V reference, the zero scale of this circuit translates to the midpoint of the ADC input range. The output voltage of the charge amplifier is:
![]()
The second stage of the signal conditioning circuit in Figure 1 is a non-inverting amplifier whose output voltage is:

Resistor R3 (100 MΩ to 10 GΩ for ceramic sensors, 10 GΩ to 10 TΩ for crystal sensors) provides DC feedback to the op amp and supplies the input bias current. This resistor must be as small as possible for the minimum measured frequency and determines the lowest limit of the frequency input range. At low frequency, the turning frequency fCL is approximately:
![]()
Placing a resistor, R4 (1 kΩ to 10 kΩ) in series with the inverting input of the op amp, helps improve stability and limit input current caused by unexpectedly high input voltages. Raising R4 further will result in a drop in high frequency response. At high frequencies, R4 can be comparable to the sensor's impedance ZS (1/ωCS, where CS is the capacitance of the piezoelectric sensor).
The turning frequency fCH under high frequency conditions is:

Using Equation 1 through Equation 5, the circuit parameters (C2, R7, R8, fCL, and fCH) can be calculated for the specific application.
For example, the Kistler model 8002K quartz accelerometer has the following specifications:
For an output voltage swing of ±1 V at VO1, C2 can be calculated using Equation 1.
![]()
For an ADC input voltage swing of 0.1 V to 2.4 V (1.25 V ± 1.15 V), the gain of the non-inverting amplifier must be equal to 1.15, with an R7/R8 ratio = 0.15. If a standard value resistor R7 =10 kΩ is chosen, then R8 = 66.67 kΩ.
Choose R3 = 100 MΩ and ignore the input resistance of the op amp and the insulation resistance of the piezoelectric sensor. The corner frequency under low frequency conditions is (see Equation 4):

When R4 =1 kΩ is selected, the corner frequency under high frequency conditions is (see Equation 5):
![]()
Therefore, the protection resistor R4 = 1 kΩ does not affect the high-pass frequency response because the upper limit of the sensor's frequency response is only 6 kHz.
From Equation 3, the gain of the signal conditioning circuit can be obtained:

The relative gain error is:
![]()
According to the principle of logarithmic derivative, we get:
![]()
Derivating lnGAIN gives:

If the tolerance of components R7, R8, and C2 is 1%, the summed gain error can be estimated.
Relative gain error under worst-case conditions:

Mean square error (root sum square error):

From Equation 3, the output offset of the signal conditioning circuit can be obtained as:

The relative offset error is:
![]()
If the tolerance of R1, R2, and VREF is 1%, the summed offset error can be estimated.

After completing the calibration process, errors caused by resistor tolerances, the offset of the AD8608 op amp (75 µV), and the AD7091R ADC are eliminated. It is still necessary to calculate and verify that the U1D op amp output is within the required range (0.1 V to 2.4 V).
Gain and offset errors due to resistor and reference temperature drift
Using Equation 7 and Equation 9, the error due to component temperature drift can be calculated. For example, if the resistor temperature drift is ±100 ppm/°C and the reference voltage drifts ±25 ppm/°C, then under worst-case conditions the gain error is less than ±0.013%/°C and the offset error is approximately ±0.01 %/°C, which equates to a total error of less than ±0.25% over a temperature variation of ±10°C.
Effect of active component temperature coefficient on total error
The DC offset of the AD8608 op amp (75 µV) and AD7091R ADC is removed by the calibration procedure.
The offset drift of the AD7091R internal voltage reference is 4.5 ppm/°C typical and 25 ppm/°C maximum.
The offset drift of the AD8608 op amp is 1.5 μV/°C typical and 6 μV/°C maximum.
Note that if a 100 ppm/°C resistor is used, the largest source of total drift is resistor drift and the drift from active components is negligible.
Calibration and testing
Before connecting the charge amplifier to the sensor, its sensitivity should be tested to calibrate the system gain. Figure 3 shows an electronic calibration system that does not require the application of any mechanical loads (acceleration, force, pressure, etc.). The charge input is driven by an adjustable amplitude and frequency low impedance output voltage source in series with the calibration capacitor C CAL . The output of this voltage source must float relative to board ground in order to operate with a HREF common-mode voltage of 1.25 V.


The input charge amount is Q = CCAL × VIN. For example, an input sine wave voltage with an amplitude of 1 V and a calibration capacitor of 1 nF produces a peak charge input of ±1000 pC. This can be used to calibrate the system. It is important for CCAL to use capacitors with a tolerance of no greater than 1% to minimize errors. Please note that CCAL's tolerance affects calibration accuracy. The tolerance of C2 determines the output range, but temperature changes in C2 affect accuracy.
On this basis, the external simulation capacitor CSIM can be used to check and adjust the circuit. Another way to check the circuit is to use the CAL input and an adjustable voltage source. For calibration and simulation needs, the capacitance CCAL can be changed by connecting an external capacitor of appropriate value and accuracy in parallel between TP1 and TP2. For other input ranges, capacitor C2 can be changed by connecting an external capacitor of appropriate value and accuracy in parallel between TP3 and TP4.
Figure 4 shows the ADC output measured with a 1V 1 kHz sine wave input and CSIM = 1 nF. Therefore, the charge input is ±1000 pC.


Figure 5 shows the actual output using a Loudity LD-BZPN-2312 piezoelectric sensor, where excitation was achieved with a speaker vibrating sinusoidally at approximately 120 Hz. The circuit is calibrated with a peak input sine wave voltage of 1 V and CCAL = C2 = 10 nF.


Printed circuit board (PCB) layout considerations
In any circuit where precision is important, power and ground return layout on the circuit board must be carefully considered. The PCB must isolate the digital and analog parts as much as possible. The PCB of this system is made of a simple double-layer board stack, but better EMS performance can be obtained by using a 4-layer board. See the MT-031 guide for a detailed discussion of layout and grounding, and the MT-101 guide for information on decoupling techniques . The power supply to the AD8608 must be decoupled with 10 μF and 0.1 μF capacitors for proper noise suppression and ripple reduction. These capacitors must be as close as possible to the corresponding device, and the 0.1 μF capacitors should have low ESR values. For all high frequency decoupling, ceramic capacitors are recommended. Power traces must be as wide as possible to provide a low impedance path and reduce the effects of glitches on the power lines.
High-impedance circuits used to condition the output of piezoelectric sensors require attention to resistance, insulation (dielectric), and wiring. The low-impedance input circuitry of the charge amplifier greatly reduces wiring problems, but the requirements for resistors, insulators, and electrometer amplifier layout also apply to charge amplifiers built with discrete components. It is recommended to place a guard ring around sensitive inputs on both sides of the PCB to minimize input leakage current. A guard ring surrounds the positive terminal and is connected to the reference (common-mode) voltage source HREF.
For a complete documentation package, including schematics, board layout, and bill of materials (BOM), please refer to: www.analog.com/CN0350-DesignSupport .

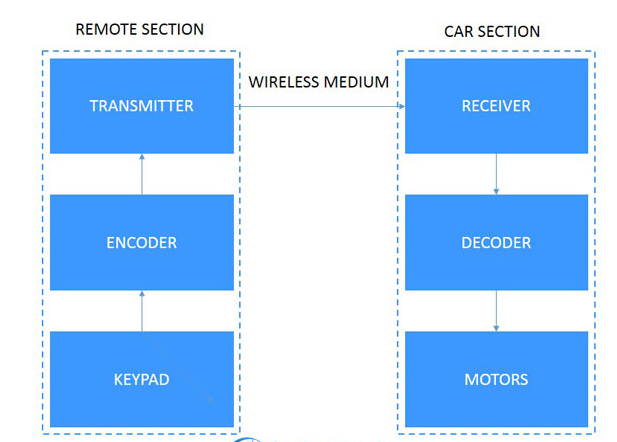
Blockdiagram
All reference designs on this site are sourced from major semiconductor manufacturers or collected online for learning and research. The copyright belongs to the semiconductor manufacturer or the original author. If you believe that the reference design of this site infringes upon your relevant rights and interests, please send us a rights notice. As a neutral platform service provider, we will take measures to delete the relevant content in accordance with relevant laws after receiving the relevant notice from the rights holder. Please send relevant notifications to email: bbs_service@eeworld.com.cn.
It is your responsibility to test the circuit yourself and determine its suitability for you. EEWorld will not be liable for direct, indirect, special, incidental, consequential or punitive damages arising from any cause or anything connected to any reference design used.
Supported by EEWorld Datasheet
EEWorld
subscription
account

EEWorld
service
account

Automotive
development
community

Robot
development
community

About Us Customer Service Contact Information Datasheet Sitemap LatestNews


Room 1530, 15th Floor, Building B,
No.18 Zhongguancun Street,
Haidian District,
Beijing, Postal Code: 100190
China
Telephone: 008610 8235 0740
 京公网安备 11010802033920号

 2020LN103K9