As the introduction states, this is a wireless measurement and control platform applied to engineering experiments.
**Wireless Measurement v2.1 was released on December 1, 2023, at https://oshwhub.com/starsky2019/micro_measure.** This project has been improved, increasing its integration.
**Demo video address: https://www.bilibili.com/video/BV1ru4y1G7Xt/**
1. What is Wireless Measurement and Control?
Experiments cannot function without data; the values of various physical quantities are collected by sensors. Simply put, this process is measurement. In experiments, we need to continuously adjust devices such as valves, lasers, and motors. This process is control. Measurement and control is the integrated process of measurement and control. Wireless measurement and control is a more convenient and flexible method developed based on traditional measurement and control technologies. It uses radio frequency transmission signals, eliminating the large amount of wiring in traditional measurement and control systems, facilitating installation, and offering good scalability. However, its disadvantages are also obvious: limited signal coverage, susceptibility to interference, and potential data security risks.
2. What did this project accomplish?
This project began with a thermocouple signal acquisition board customized for a hypersonic laboratory. Later, after redesigning the PCB, hardware compatibility was greatly improved. Finally, the author improved the software support and open-sourced the project on OshWhub, aiming to provide a stable and efficient wireless measurement and control solution for a wider audience.
The wireless measurement and control system described in the project consists of two parts: a wireless measurement system and a wireless control system. The two operate independently and do not interfere with each other.
(1) Wireless Measurement
● Acquires voltage signals from -6mV to 54mV, or current signals from 4 to 20mA
. ● Uses AD7327 chip as analog-to-digital converter to achieve 12-bit accuracy
. ● Each measurement PCB supports eight channels of asynchronous acquisition
. ● Supports real-time display of data on a webpage
. ● Logs and data are backed up on the server
. ● The microcontroller at the experimental site is connected to an SD card, so data is not lost when the network is disconnected.
(2) Wireless Control
● Remotely controls the conduction and cutoff of DC voltage on a certain channel, which can be used to drive valves, etc.
● Maximum continuous load current reaches 5A.
● Each PCB supports eight channels.
● Supports timing control and manual control, with timing accuracy reaching 1ms and synchronization delay less than 0.3ms.
● Equipped with an emergency stop device
. ● Logs are backed up on the server.

In experimental environments with a large number of measurement and control channels and inconvenient wiring, the wireless measurement and control system has high application value.
3. System Design Concept
The entire system comprises two servers (using WebSocket and HTTP protocols respectively) and several nodes, as shown in the diagram below.

The nodes are distributed across the experimental site, divided into measurement and control nodes, responsible for measuring sensor signals and issuing control voltages respectively. The servers connect users to the nodes, allowing users to observe node data and change the state of the control channels.
The WebSocket server supports connections to a maximum of 98 nodes, with addresses ranging from 001 to 098. Address 099 in the WebSocket network hosts an auxiliary window program (hereinafter referred to as the "auxiliary program") used to check server status and manage server restart and shutdown actions. Because address 099 also connects to the server via WLAN, it does not need to run on the same computer as the server.
Note: Node addresses are prefixed with 's' and 'm' to distinguish between the control server and the measurement server. That is, in the control server, node addresses are s001-s099; in the measurement server, node addresses are m001-m099.
The HTTP server broadcasts two web pages, one for wireless measurement and the other for wireless control: the measurement page allows real-time viewing of node data; the control page allows manual changes to the status of a specific channel. The HTTP server is built on Apache 2.4. The provided software package will install Apache 2.4 and PHP 8 along with the server installation and automatically modify the web page root directory.
The following three sections will explain the principles and functions of the server and the measurement and control nodes. Section 7 will introduce how to use the system for wireless measurement and control.
4. Server and Auxiliary Programs
The release versions of the server and auxiliary programs have been uploaded to Lanzou Cloud; the download address is https://wwer.lanzoue.com/iNjXz1hd9weh.
4.1 Server Installation
(1) Download and extract the compressed package, open the Server folder.
(2) Double-click setup.exe, select the installation path.
※The installation path cannot contain Chinese characters.
※The installation path cannot contain spaces or special characters
. ※Try not to select the C drive as the installation path, otherwise file access may be denied.
(3) Wait for the server installation to complete.
(4) Return to the desktop and double-click DoubleClickMe.lnk.
(5) Wait for the program to finish running, press any key to exit.
At this time, DoubleClickMe.lnk on the desktop will be automatically deleted, leaving two shortcuts: ApacheMonitor and WS_Server. The former is the entry point for Apache 2.4, and the latter is the startup shortcut for the WebSocket server.
Note: If you want to recompile the server, the cpp source files are provided in the installation path. Please install the WebSocketpp and boost libraries for C++ from GitHub.
4.2 Server Startup
(1) Go to the desktop, double-click WS_Server, and the following prompts will appear in sequence:
① Do you want to get the local IP information?
If you select Y, ipconfig will be executed in the program to display the server's IP; if you select N, skip this step.
The author suggests selecting Y to view the IP and remember it, as this IP is needed in the process of connecting the auxiliary program and configuring the node network.
② Number of measurement node connections:
How many measurement nodes are expected to join the network, and the auxiliary program is also counted as a node. Enter an integer, such as: 2
③ Number of control node connections:
Same as above
④ Sampling frequency (sps) of measurement nodes:
Enter an integer to represent how many times the measurement node samples per second.
This value only changes the time coordinate of the data refresh in the webpage and must be consistent with the sampling frequency of the microcontroller in the measurement node. The sampling frequency of the microcontroller is 1000sps by default, and the method for modifying it will be introduced below.
⑤ Do you want to start the server?
Enter Y to start.
After (1), the computer has established two WebSocket servers in the WLAN. The address of the wireless control server is ws://localhost:9002, and the address of the wireless measurement server is ws://localhost:8002. If the server fails to start, please check if there is any port occupation.
(2) Go to the desktop, double-click ApacheMonitor, and start Apache2.4
. At this time, the computer has started broadcasting web pages to the local area network. Access localhost/user_measure through the browser to view the measurement web page, and access localhost/user_control to view the control web page. Other users outside the server should replace localhost with the server's IP address and then access the web page.
4.3 Server Function Description
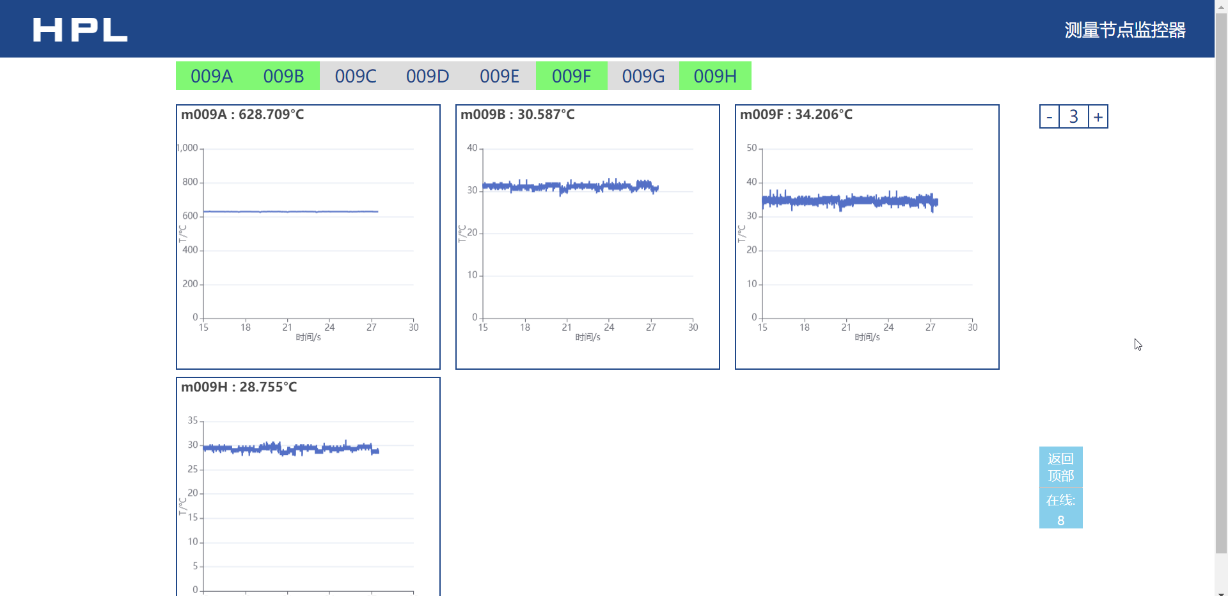
(1) The measurement web page
interface is shown in the figure below:
In the interface, the gray-green background squares at the top display all the online channel names, and the bottom is the drawing area. Click to select a channel, and its background will change from gray to green, and the corresponding chart will be displayed below. Click again to deselect the channel, and the corresponding chart and historical data will disappear. The banner at the bottom will fade out of the interface after clicking. The number in the upper right corner indicates the number of charts displayed in each row, which can be adjusted by clicking "+" and "-".
Note: Drawing many charts at the same time may cause high CPU usage.
Note: The microcontroller can distinguish different physical quantities by modifying the data suffix. The webpage will automatically assign units after parsing these physical quantities. The method of distinguishing different physical quantities will be introduced in Section 5.
(2) Control Webpage
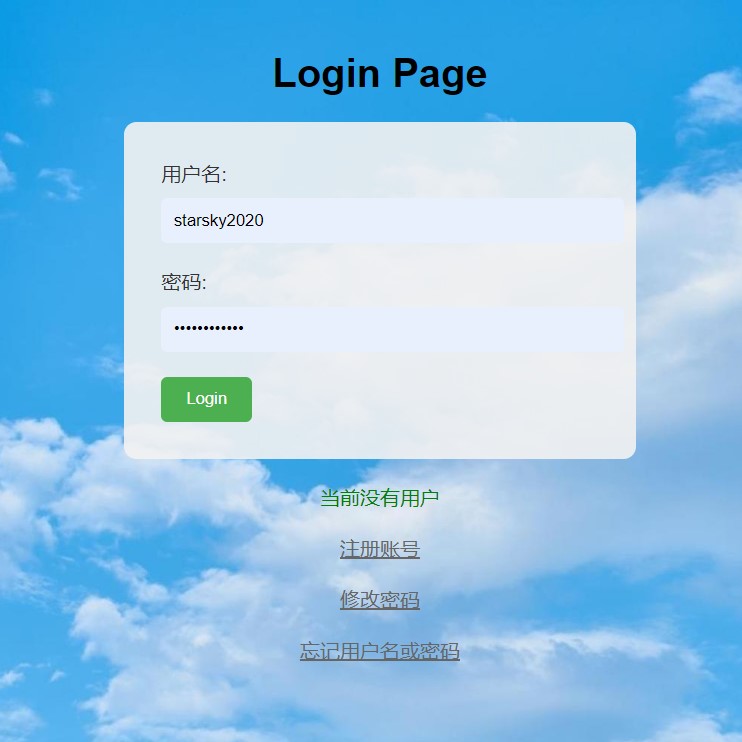
To prevent command conflicts, the control webpage only allows one user to operate online. Therefore, authentication is required.
When the control page is opened for the first time, the browser will prompt that the identity information has expired. Clicking "OK" will automatically redirect to the login page. Enter the username and password. After successful login, you will be redirected to the control page and allowed to operate the status of each node channel through the webpage.
If a user is already operating the control page, all subsequent login processes will be blocked. It takes about 3-6 seconds for the server to update the online status. After the previous user closes the webpage, please wait for a while before logging in.
On the login page, you can also choose "Register Account" or "Change Password". The initial verification code for "Register Account" is "ABCDEFG". Website administrators can modify the configuration file "Apache24htdocsuser_controlconfig.txt" in the installation directory. The configuration.txt file stores a JSON string, with the field corresponding to the verification code being "vfCode".
The main interface of the control page is shown in the image below. Clicking "+" and entering a channel name creates a new control channel. Clicking "ON/OFF" changes the channel's on/off status. Clicking "X" closes the current channel. The banner at the bottom can also be closed by clicking.
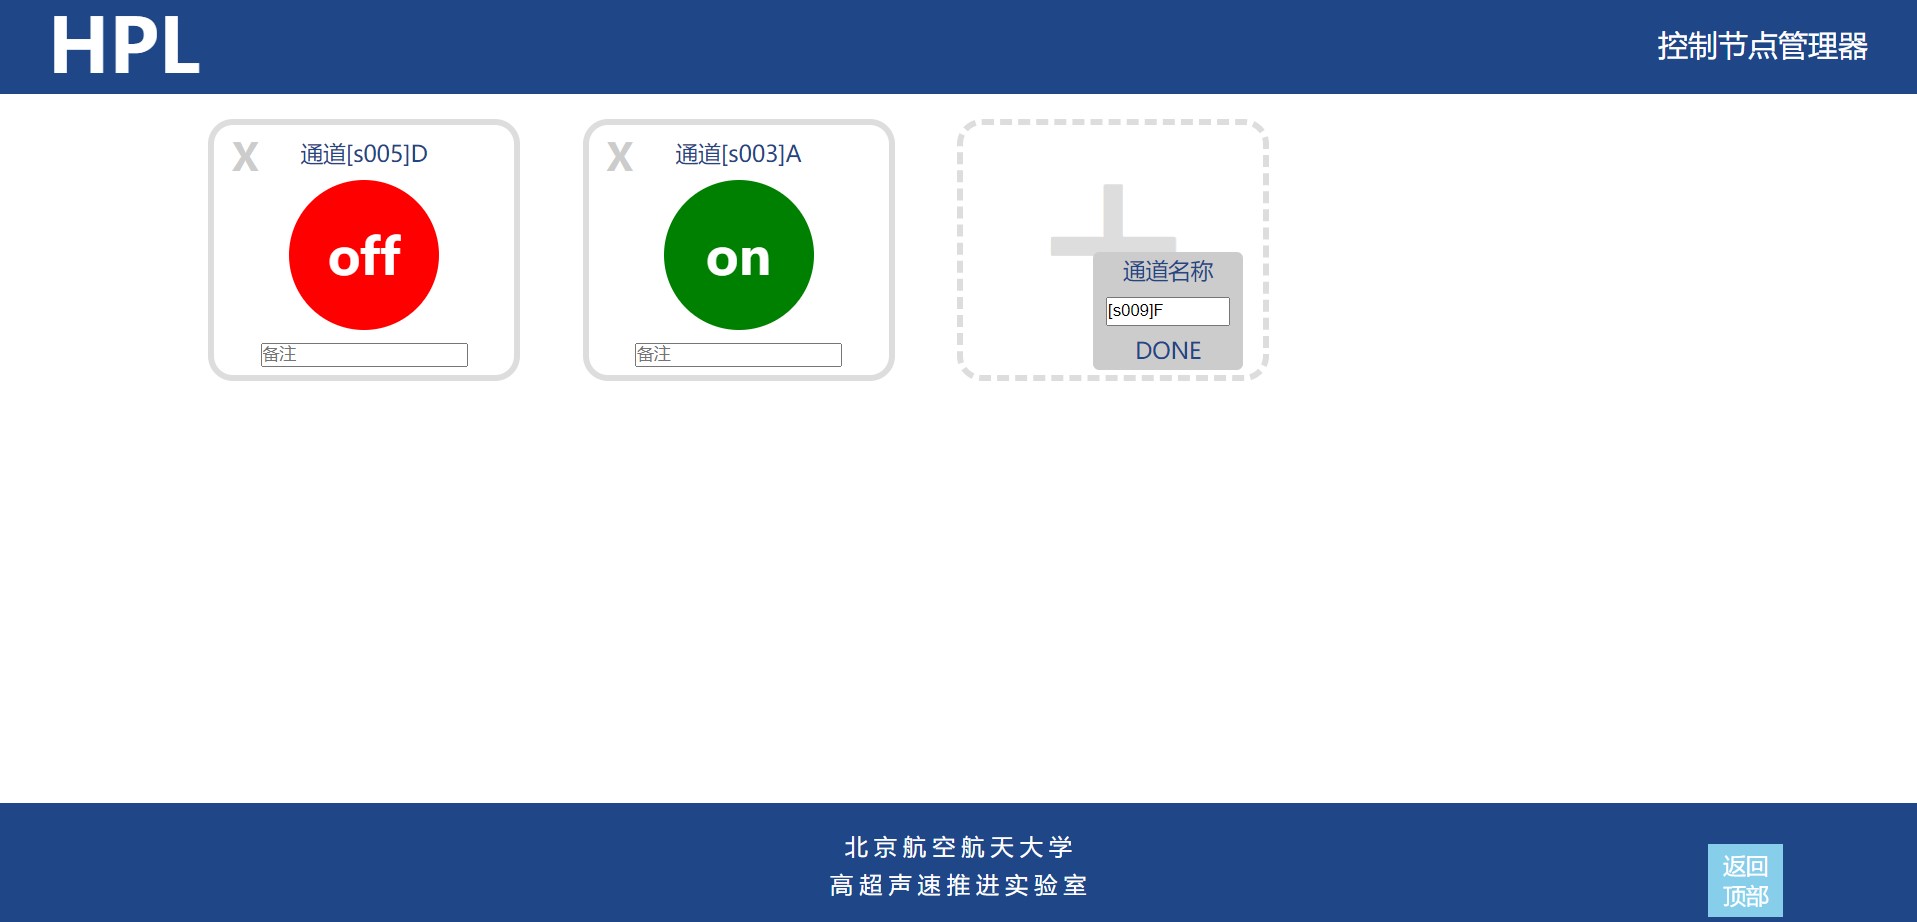
Note: The control page supports manually changing the status of a channel, but it still connects to the server via WebSocket. Please ensure that the operation assistant and the control page are not running simultaneously, otherwise conflicts may occur.
Note: Sometimes, due to abnormal server shutdown, the control login page may incorrectly display the currently operating user. Please confirm that all users are offline, then go to "Apache24htdocsuser_controlconfig.txt" in the installation directory and change the value of "numofcon" to 0, then refresh the page.
4.4 Installation of the auxiliary program
(1) Download the compressed package and decompress it, open the Client folder
(2) Double-click setup.exe, select the installation path, and start the installation.
※ The installation path cannot contain Chinese characters. ※ The
installation path cannot contain spaces or special characters.
※ Try not to select the C drive as the installation path, otherwise file access may be denied.
(3) Wait for the auxiliary program to finish installing
. After all is completed, a shortcut for MS_User will appear on the desktop. This is the entry point for the auxiliary program.
4.5 Description of auxiliary program functions
Double-click to open MS_User. You can see a total of 6 tabs, namely "Welcome", "Control Node Management", "Measurement Node Management", "Timing Editing", "Timing Viewing" and "Timing Startup".
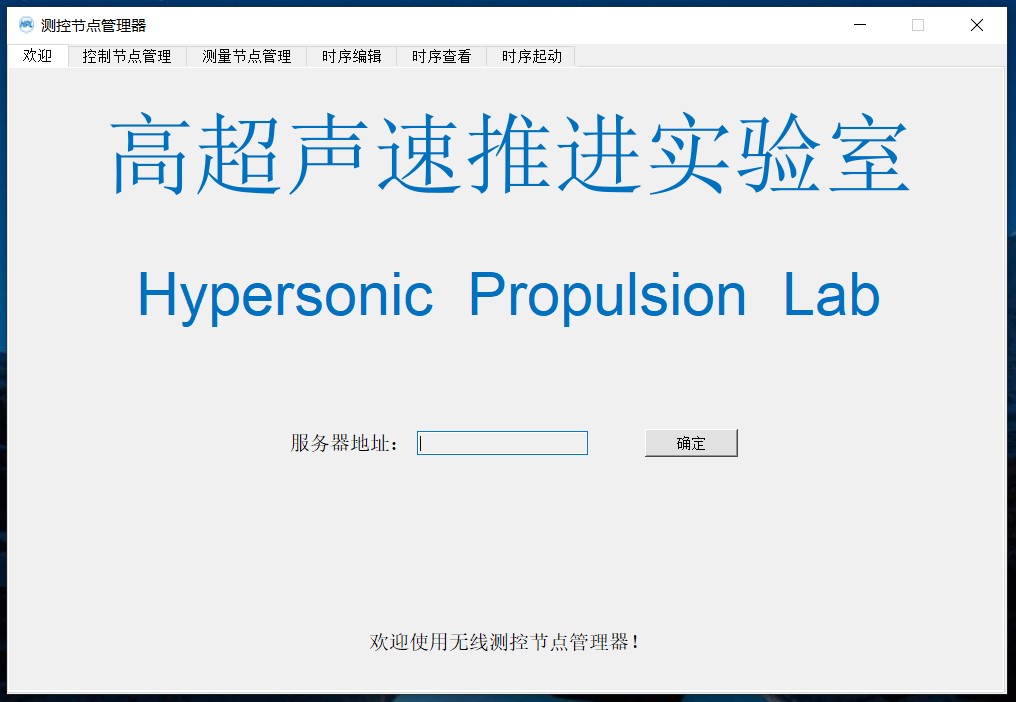
After the program is opened, it is offline by default and all functions are disabled. Please enter the server address in the "Welcome" interface and click "OK" to connect to the server. If you do this, a new command line window will be launched, which records the debugging information of WebSocket.
Open the "Control Node Management" tab. The interface is shown in the figure below. The rightmost part is the server's incoming and outgoing messages, the upper left part has many buttons, and the lower left part is a scrolling area.
Once a control node joins the network, clicking "Update" displays the number of online connections;
clicking "Check Ping" retrieves the latency between each node and the server, with the latency in milliseconds displayed in a scrolling area;
clicking "Start Injection" distributes the timing file (explained below) stored on the server to the corresponding nodes and checks if they have successfully received it;
clicking "Execute Preparation" puts each control node into a "waiting for trigger" state, a necessary condition for starting control timing;
clicking "Server Restart" or "Server Shutdown" restarts or shuts down the server corresponding to ws://localhost:9002.

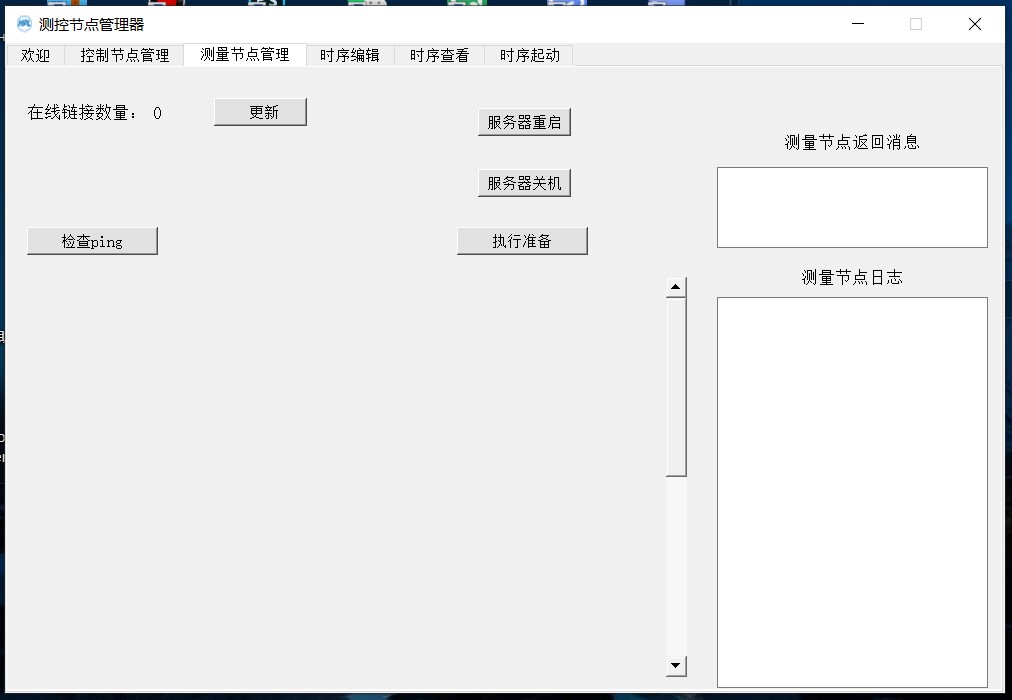
Open the "Measurement Node Management" tab; the interface is shown below. In this tab, the "Execute Preparation" function is slightly different: after a node joins the network, it is in a standby state by default. Clicking "Execute Preparation" at this time will cause all nodes to start collecting data and continuously uploading it to the server. If "Execute Preparation" is clicked again, the node will stop collecting and uploading data and return to the standby state. Other functions are similar to the "Control Node Management" tab and will not be described further here.
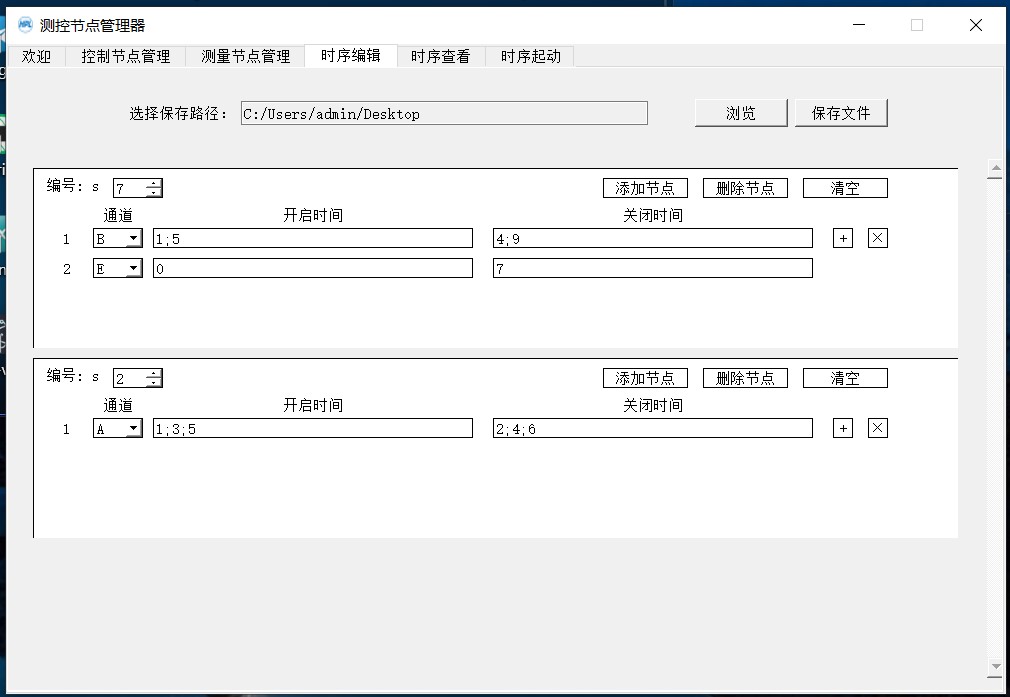
Open the "Timing Edit" tab; the interface is shown below.
Timing control is a common control method used to automatically execute a series of operations according to a predetermined time sequence. In this tab, we can select specific channels and specify their on/off times, then create a timing file. Clicking "Browse" allows you to choose the path to save the timing file. Clicking "Add Node" creates a new node below the current node; clicking "Delete Node" deletes the current node; clicking "Clear" clears all entered on/off times. Clicking "+" adds a control channel to the current node; clicking "x" deletes the last control channel of the current node. "On Time" and "Off Time" are in milliseconds; enter several integers separated by semicolons ";". After editing the timing file, clicking "Save" will generate a "server_seq.SEQ" file in the target folder.
Open the "Timing View" tab; the interface is shown in the figure below. Open the saved timing file (*.SEQ); the timing graph will be automatically displayed below. After checking that everything is correct, click "Send to Server" to transfer the file to the local server.

Open the "Timing Start" tab; the interface is shown in the figure below. Enter the correct start key and click "Start." The program will enter a 5-second countdown. Then, a start command is sent to the synchronizer, which generates a trigger signal, causing each control node connected to it to start executing the timing simultaneously.
The function of the synchronizer and its wiring to each control node will be described below.
Note: Successful timing start requires the following conditions to be met:
① The synchronizer and each control node maintain a wireless connection to the server.
② The key in the auxiliary program is consistent with the key entered in the synchronizer.
③ The trigger terminals of each control node are connected to the synchronizer and are in "waiting for triggering state."

5. Design and Function of Measurement Nodes
5.1 PCB Board
Measurement Nodes mainly consist of three PCB boards: a power board, board A for measuring K-type thermocouple signals, and board B for measuring 4-20mA current signals.
(1) Power Board
The function of the power board is to provide a stable 5V voltage for both measurement boards and to provide interfaces for battery status and charging status indication. For the measurement nodes, the PCB name used by the power board is "UPS2". As shown in the figure below:
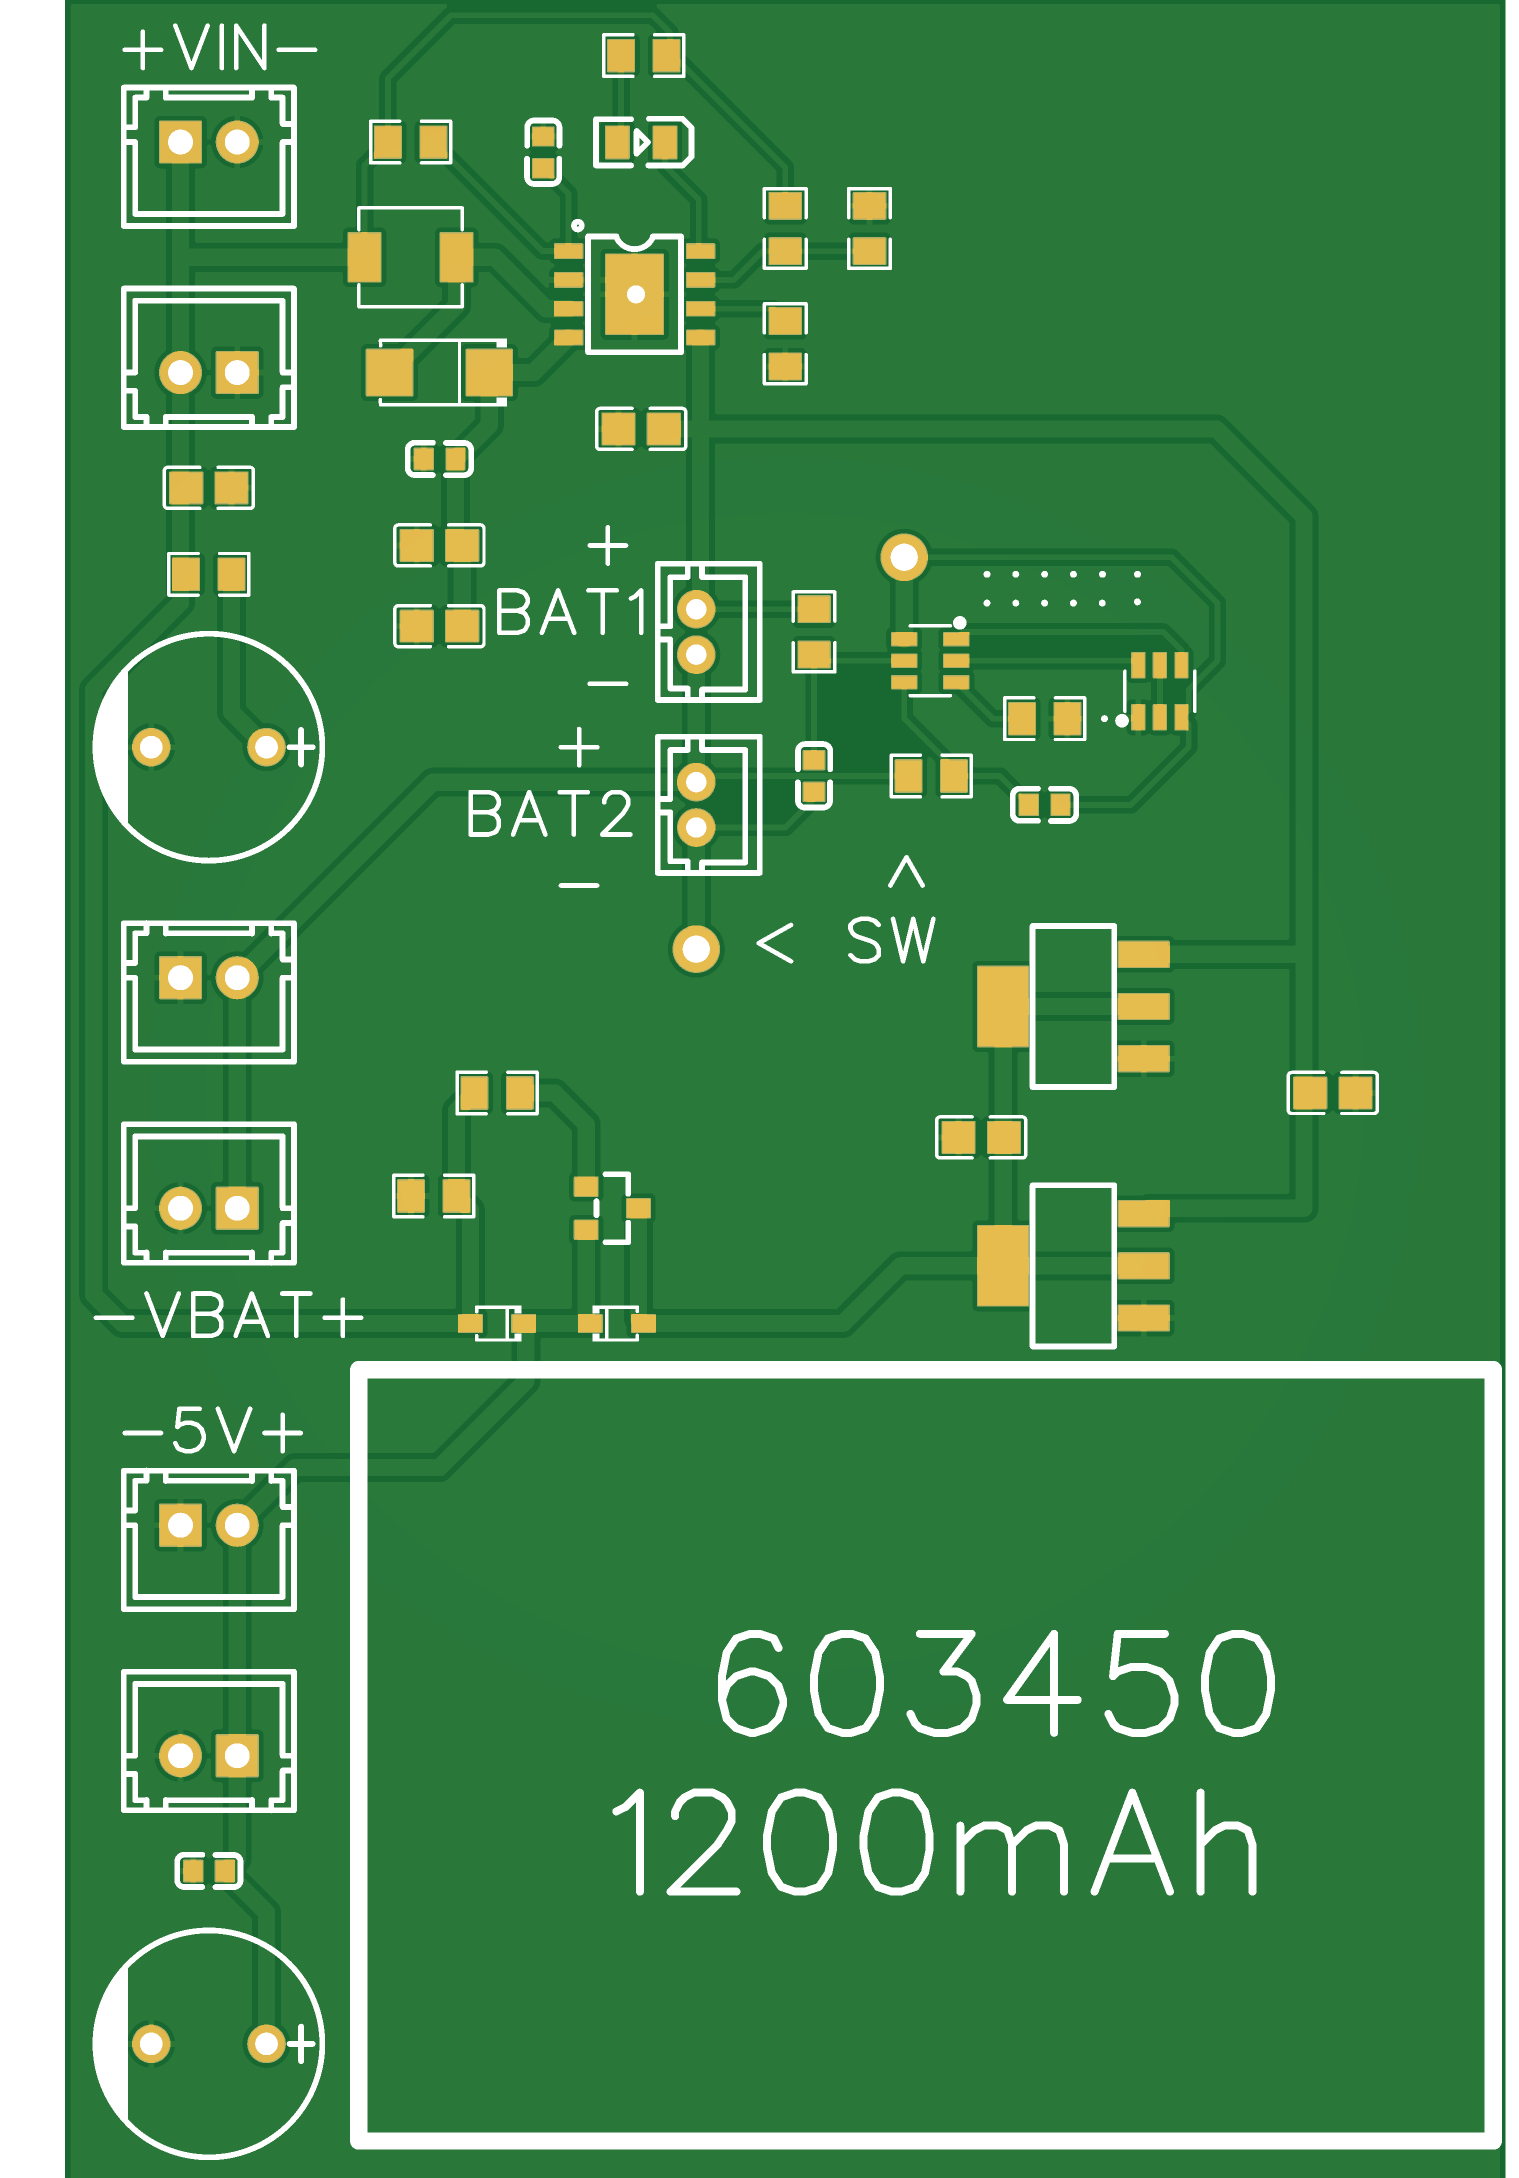
The power board uses two 3.7V lithium batteries in series, which are regulated to 5V by an AMS1117-5.0.
In the figure, BAT1 and BAT2 are two PH2.0 sockets used to connect the batteries (!Please make sure the positive and negative terminals of the batteries are consistent with the silkscreen before connecting!). The two circular pads with through holes indicated by the silkscreen "SW" are the switch connection positions. The battery will only have output when the two are shorted.
Two AMS1117 soldering positions are reserved on the PCB, which are connected in parallel. If the load current requirement is less than 1A, only one AMS1117 needs to be soldered.
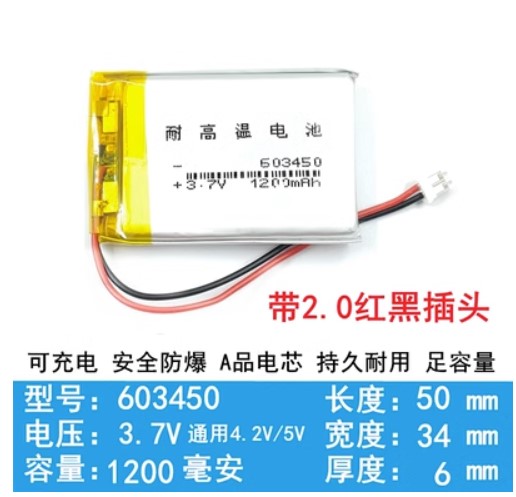
A lithium battery mounting position is reserved in the lower right corner of the PCB. The author used 603450 batteries (from Taobao), which were stacked and fixed with glue. The batteries are shown in the figure below. Of course, if space permits, a larger capacity and larger battery can be used. However, the 3D casing provided in this project may not be able to accommodate it, so please redesign.
There are six XH2.54 sockets on the far left of the PCB, divided into three groups: "VIN", "VBAT", and "5V". Each group is shorted to each other and provides both positive and negative soldering positions, with the positive and negative terminals matching the silkscreen markings.
The power board uses a PL7501C to charge two lithium batteries and a PL7022B to protect them. When charging, connect a 5V voltage to one of the XH2.54 sockets in "VIN". The default maximum charging current is 1A; please ensure the power adapter's output current is sufficient.
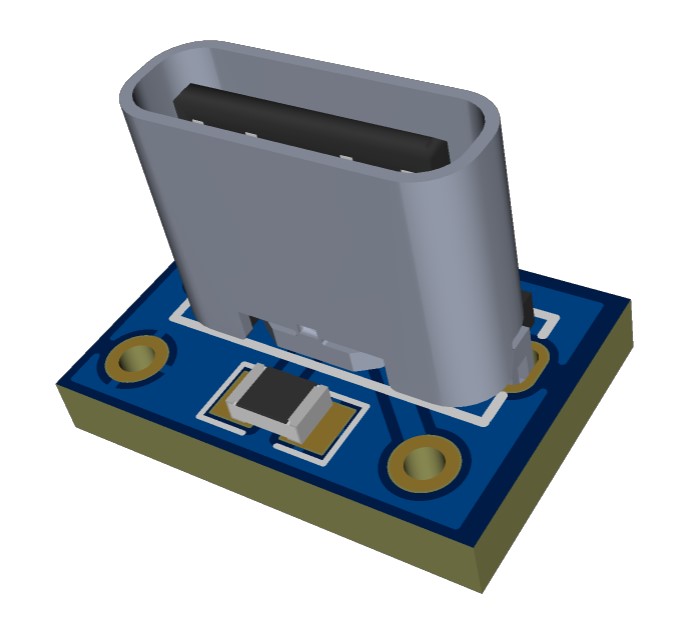
This project also provides a small Type-C to 5V adapter board, named "TypeC-5V". After soldering XH2.54 terminal wires to it, it can be directly plugged into the sockets on the power PCB.
The "VBAT" socket is connected to the positive and negative terminals of one of the batteries, outputting the current voltage of that battery for power monitoring on the measurement board.
The “5V” output provides a stable 5V voltage to power both types of measurement boards. When charging, this voltage is directly output from VIN; when discharging the battery, this voltage is output from AMS1117. The switching process will not affect the operation of the measurement board.
Note: There is another power supply option: boosting the 3.7V of a single lithium battery to 5V, the corresponding PCB name is “UPS”. There is an empty slot on the left side of the PCB, and a lot of solder needs to be piled on the edge pads to connect to the power module (Taobao) (as shown in the figure below). The recommended PCB thickness is 1.2mm.

Note: The above boosting scheme is not recommended for use in the measurement board. This scheme has a large ripple, which will bring considerable noise to the measurement data.
Note: Try not to perform measurements while charging. The output voltage quality of some power adapters is poor, which will also interfere with the measurement results.
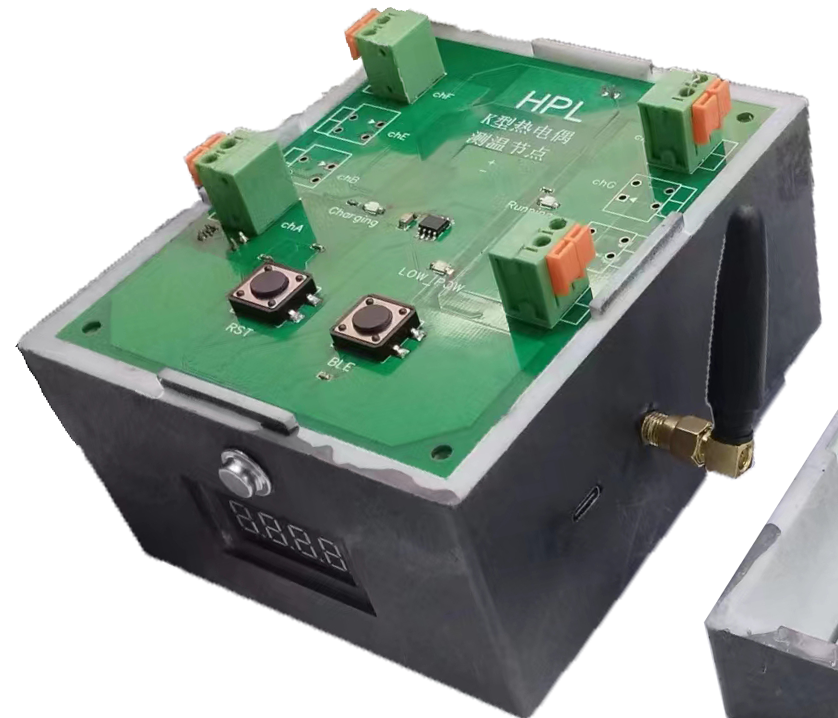
(2) Measurement board for K-type thermocouple
The measurement board for K-type thermocouple is um_op. Eight terminals are installed on the back of the PCB, which are directly connected to the K-type thermocouple. It uses an OP07 to form a differential amplifier, amplifying the thermocouple signal, and then inputs the amplified signal to an AD7327 analog-to-digital converter. The AD7327 is connected to an ESP32 microcontroller and configured as a slave, transmitting data via SPI. The microcontroller also has a MAX6675 and an SD card connected, responsible for cold junction compensation and data backup of the thermocouple, respectively.
An SGM3204 is mounted on the PCB to generate a negative voltage. This allows the measurement board to still acquire data normally even if the hot junction of the thermocouple is lower than the cold junction temperature.
The top and bottom surfaces of the PCB are shown in the figure below.

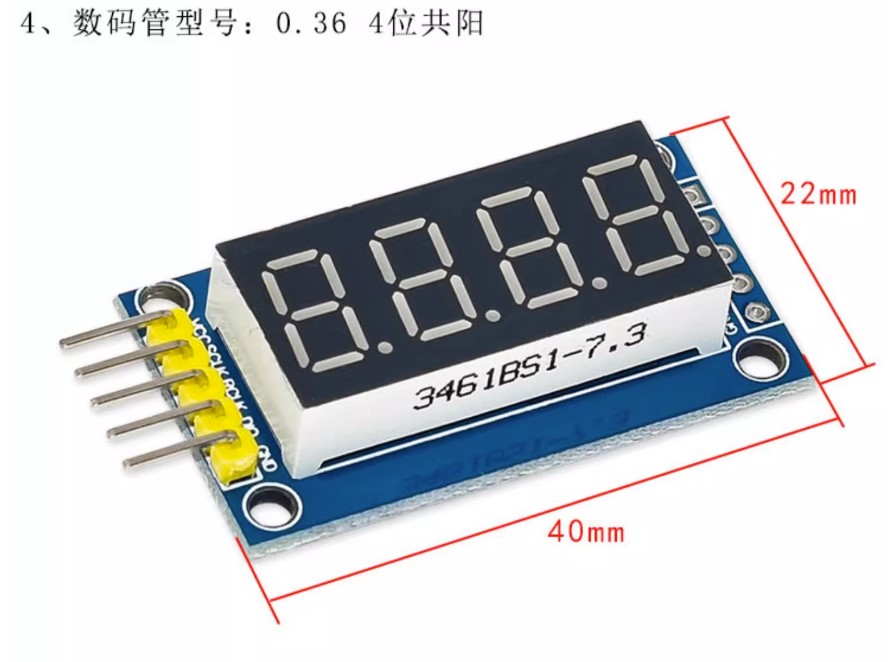
The top surface has three XH2.54 sockets, labeled "5V", "VBAT", and "VIN", which correspond to the three sockets on the power board. "5V" is the power supply socket; "VBAT" is the battery level monitoring socket, which illuminates the indicator light when the battery is low when connected, and can also work normally without being connected; "VIN" is the charging status indicator socket, which illuminates the indicator light when charging when connected, and can also work normally without being connected. On the lower left of the top surface, the socket indicated by the silkscreen "LED" is an XH2.54-1x5P socket. It is connected to a four-digit LED display to show the node number. As shown in the picture below (Taobao)
, there are three LEDs on the bottom. The silkscreen "Running" indicates that the measuring board is powered on, "charging" indicates that it is charging, and "LOW_POW" indicates that the battery is low. There are two buttons on the bottom: the silkscreen "RST" indicates that the microcontroller is restarted, and "BLE" indicates that Bluetooth is turned on (the function of Bluetooth will be explained below).
(3) Measuring board for 4-20mA current signal
The measuring board for 4-20mA current signal is um_420. It uses a 150Ω precision sampling resistor to directly collect 4-20mA current, which will cause a maximum voltage drop of 3V. In my test environment, the current loop allows a maximum voltage drop of 12V. If the sampling resistor is too large, the sampling resistor can be reduced and an operational amplifier can be added. It should be ensured that the output voltage of the operational amplifier corresponding to 20mA is 3V.
The PCB of um_420 is basically the same as that of um_op, with the top and bottom surfaces shown in the following figures:

The um_420 PCB does not have a negative power supply and has two additional terminals. This is because 4-20mA signals generally require an external power supply (mostly 24V), and using a lithium battery would result in high energy consumption. The two terminals marked "External Power Supply" are shorted. One is connected to the power supply, and the other can be connected to another measurement board for cascading.

5.2 The microcontroller
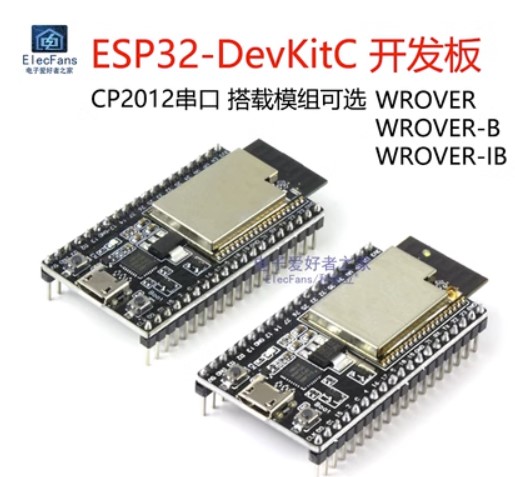
program is compiled using the Arduino IDE. Due to the large memory usage of the program, the ESP32-WroverB module (available on Taobao) is used as the microcontroller for the measurement board, directly inserted into the outer column of the two rows of 2*19P parallel surface mount headers.
Note: The author recommends enabling PSRAM and changing the microcontroller partition to "HugeAPP".
The microcontroller-related programs are attached. Among them, um is the measurement program for mounting an SD card. The program will not run properly if the SD card is not inserted. If the SD card is damaged or does not need to be mounted, please burn um_noSD: except for the SD card, the function is the same as um. The K-type thermocouple measurement board and the 4-20mA measurement board both use the above microcontroller program.
The microcontroller program needs to import an external Websocket library. The library file is attached "arduinoWebsockets-master".
The following are some explanations of the program:
(1) Bluetooth mode description
Each node has its own independent number and measurement mode. Each server also has a specific wireless LAN and IP address. This information often changes. If it needs to be re-burned every time it changes, it will be a tedious task, and the applicability of the system will be greatly reduced.
Therefore, the microcontroller uses Bluetooth + EEPROM to store this key information. If they need to be modified, the user can directly access the microcontroller using a Bluetooth device without going through the serial port. The advantage of this is that the information is easy to edit and will not be lost when power is off, and there is no need for repeated configuration; the disadvantage is that Bluetooth needs to be configured separately, and the program size increases significantly.
① How to enter Bluetooth mode?
If the microcontroller can connect to WLAN, click the "BLE" button to turn on Bluetooth while it is working normally.
If the microcontroller cannot connect to WLAN, first ensure that the microcontroller is powered on correctly, then press and hold the "BLE" button while clicking the "RST" button. Release "RST" for about 3 seconds, then release "BLE". This will make Bluetooth turn on before WLAN.
② How to connect to the microcontroller?
Download "Bluetooth Serial Port Debugging Assistant" (or other similar applications) on your mobile phone (or other Bluetooth device), turn on the device's Bluetooth switch, find the Bluetooth corresponding to the microcontroller's name (default is "ESP-BLE002", which can be modified). Finally, click "Connect" to establish a Bluetooth connection with the microcontroller.
③ How to modify the information saved in EEPROM?
For the measurement board, you can send messages to the microcontroller in the following format to modify certain parameters:
● "number:XXX": Set the address of the microcontroller to XXX. XXX is a three-digit integer, such as 001.
● "kind:X": Set the measurement mode of the microcontroller to X. X is a character, which can be 'k', 'p', or 'v'. These represent measuring a thermocouple, measuring a 4-20mA current, and directly measuring the voltage of an ADC channel, respectively.
● “ipv4:XXX.XXX.XXX.XXX”: Sets the server's IP address in the WLAN to XXX.XXX.XXX.XXX. For example: “ipv4:192.168.0.13”.
● “ssid:XXXXX”: Sets the SSID for connecting to WiFi, for example, “ssid:MYSSID”.
● “psw:XXXXX”: Sets the password for connecting to WiFi, for example, “psw:123456”.
One or more of this information can be modified. After all data is sent, sending “end” will exit Bluetooth mode. Simultaneously, the microcontroller will save these modifications to EEPROM. After modification, please restart the microcontroller immediately for the changes to take effect.
④ How to change the microcontroller's Bluetooth name?
Open the um program (or um_noSD), find the predefined “this_BLE_no”, and modify its value.
(2) Modify the sampling frequency.
Open the um program (or um_noSD), and in the setup function, find "timerAlarmWrite(timer1, 1000, true);". This code indicates that sampling occurs every 1000us, with a sampling frequency of 1ksps.
Then find the predefined "#define M_Size 500". This line of code indicates that data is uploaded every 500 data points. At a sampling frequency of 1ksps, data is sent twice per second.
Suppose you want to modify the sampling frequency to 2ksps, first modify the timer to: timerAlarmWrite(timer1, 500, true); setting it to sample every 500us. Then modify the predefined #define M_Size 1000 so that it still sends data once every 0.5 seconds.
Note: The author does not recommend modifying the sampling frequency, as this may cause a series of problems, including: data transmission delay, increased packet loss rate; increased microcontroller memory usage; decreased sampling quality, etc. Generally speaking, 1ksps can meet the needs of most experiments. For lower sampling frequency requirements, please obtain effective data through numerical processing methods; for higher sampling frequency requirements, please contact the author to customize new microcontroller and server programs: rm-f@qq.com.
(3) Custom data processing function
The microcontroller does not obtain precise physical quantity values, but uploads the raw data of the collected voltage to the server. Data processing and conversion are completed by the JavaScript of the measurement webpage.
Each data packet of the microcontroller contains all the sampling data of a channel in the past 0.5s, and its last five bits are used to distinguish the data type. This data will be sent to the WebSocket server. After simple processing, the WebSocket server sends a data in a specific format to the HTTP server, and then the HTTP server presents them on the webpage.
The JavaScript program of the webpage maps the K-type thermocouple data to the range of -260℃ to 1300℃ according to the calibration table, maps the 4-20mA current signal to the range of 0-100MPa according to the linear mapping, and outputs the -5~5V voltage signal according to the original value for plotting.
To modify these mappings or redefine the data processing functions, open the "Apache24htdocsuser_measurescript.js" file in the installation directory, find the " sendRequest ( ) " function , and locate the following structure for
( var i = 0 ; ...
The first element of `new_data[i]` is the address bit, the last element is the pattern recognition bit, and the middle element is the valid data. If the last bit of this array is "P", it means that the microcontroller is measuring a 4-20mA current signal; if it is "V", it means that the microcontroller is measuring a voltage of -5~5V; if it is a floating-point number, it means that the microcontroller is measuring a K-type thermocouple, and the floating-point number represents the temperature of the cold junction.
In the valid data, -4095~4096 represents a voltage of -5~5V. Please process these data one by one according to the custom rules. For the array recording K-type thermocouples, the last element should be changed to "T" after processing.
The `unit` object on line 192 stores the units displayed when drawing under different measurement modes, which can be modified according to the requirements.
var unit = { //unit P: 'MPa', T: '°C', V: 'V' }
5.3 Measurement Node Housing
The housing of the measurement node consists of two parts: the bottom shell and the top cover. Its 3D model is shown in the "um shell" in the engineering attachment.
Note: The model scheme of the bottom shell is applicable to the power supply "UPS2".
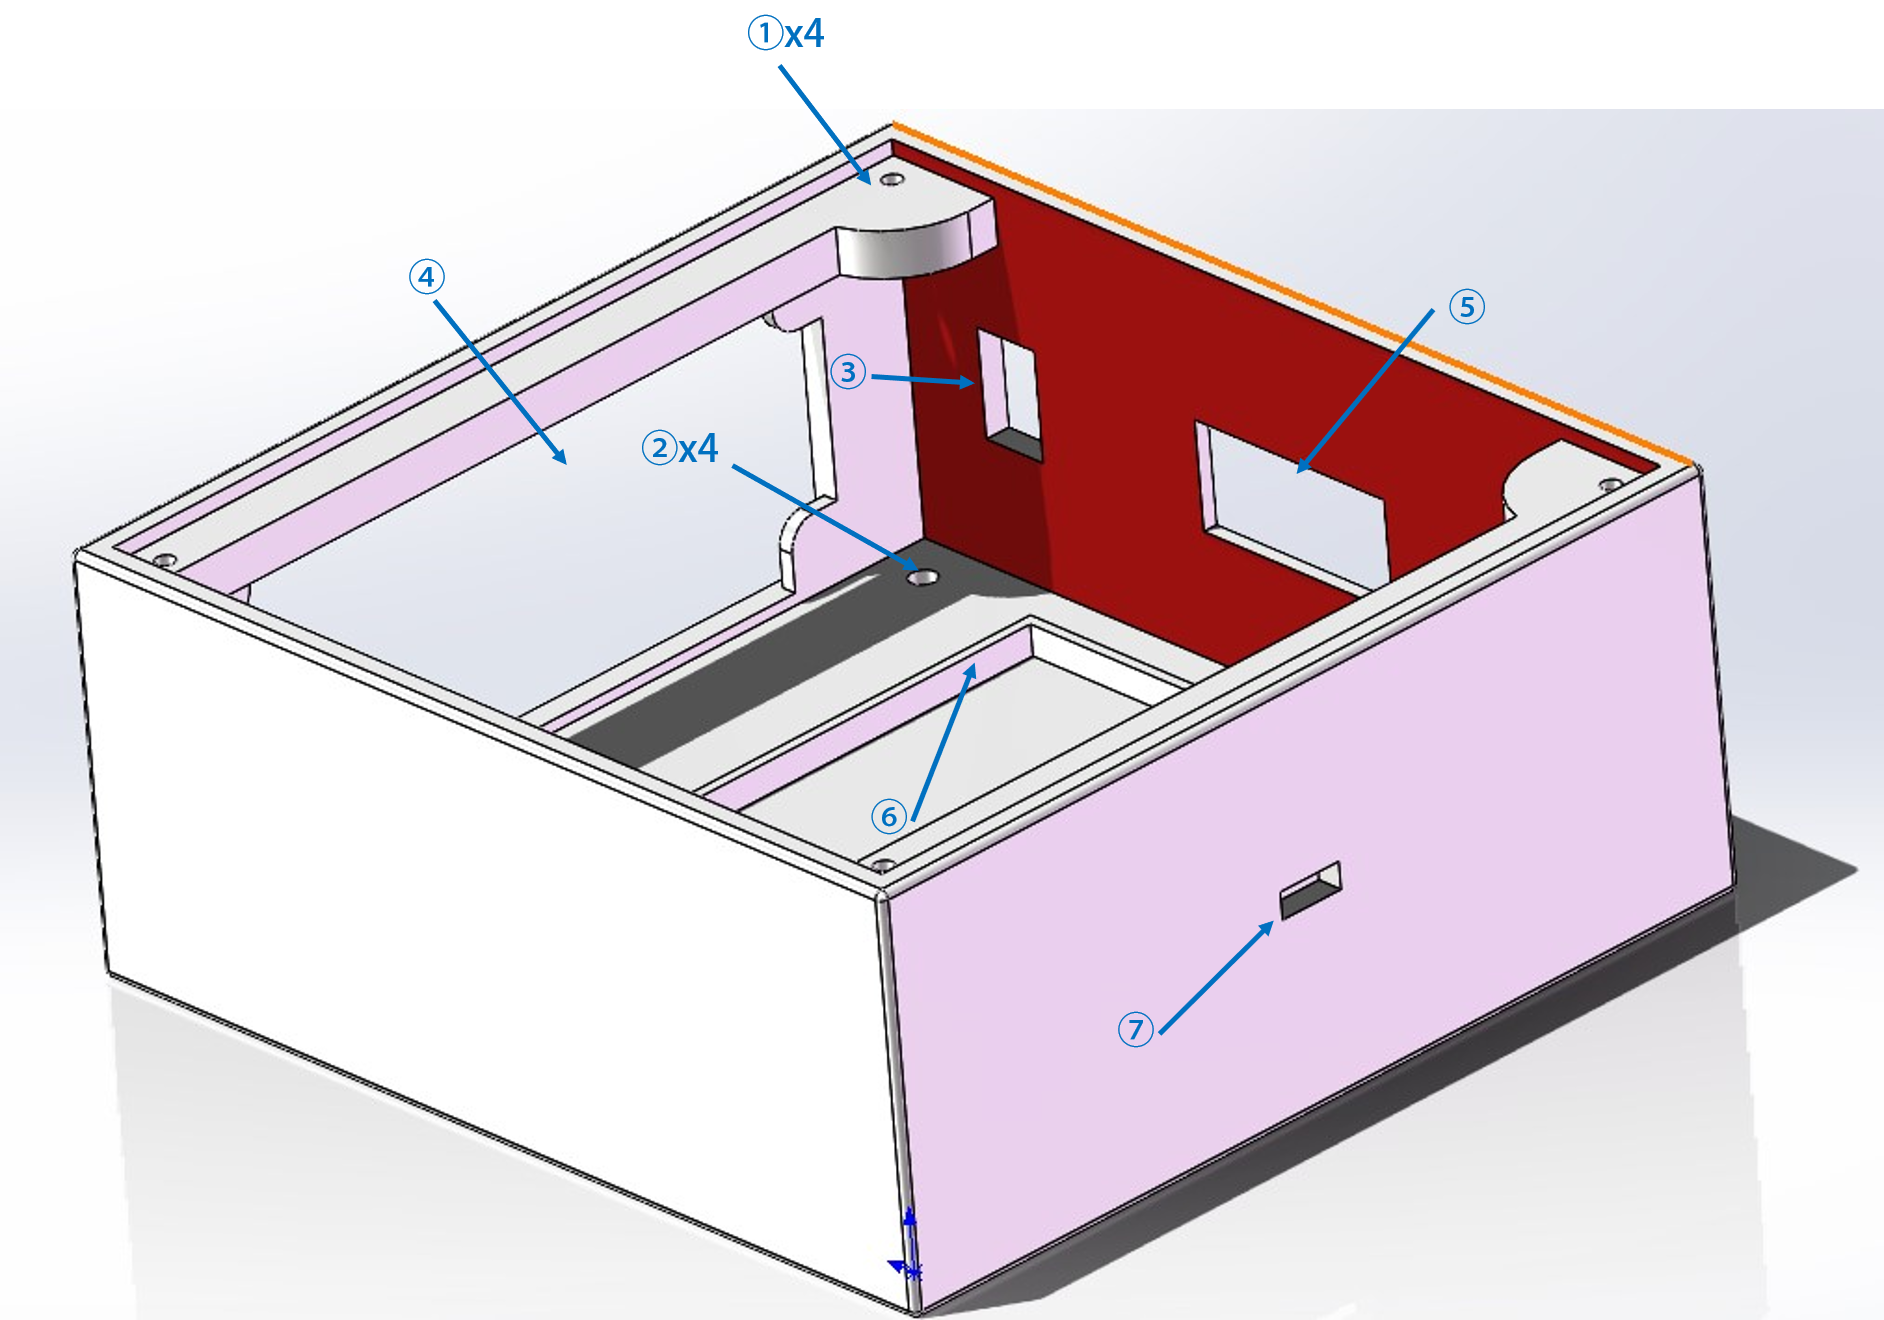
(1) Bottom
shell The side view of the bottom shell is as follows:
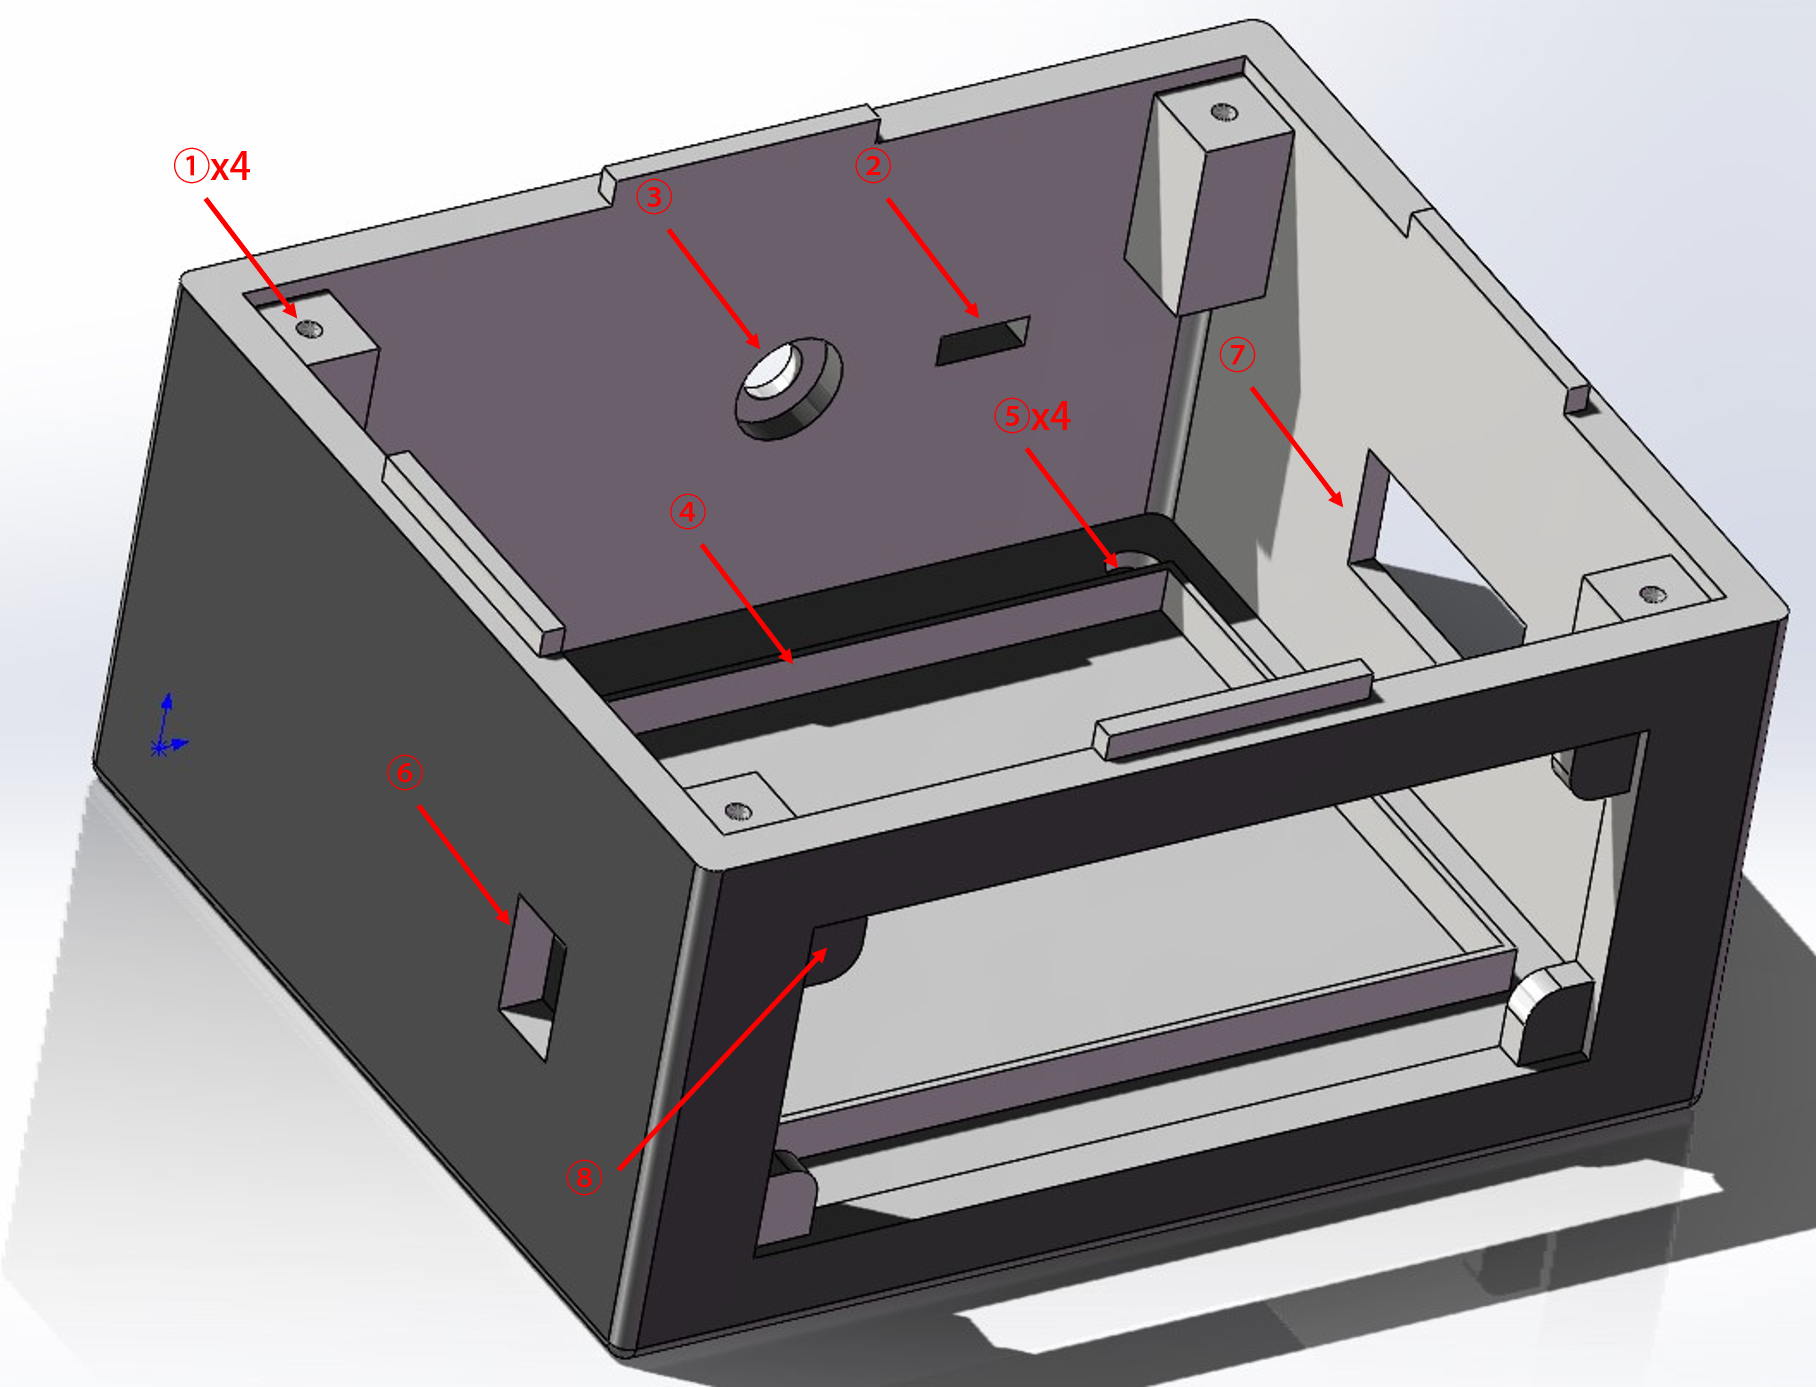
①: The four platforms with through holes on the top of the bottom shell are used to install the measurement board. These through holes are 2.5mm in diameter and correspond to the positions of the four through holes on the PCB board. Please use a tapping wrench to make M3 threads and then use bolts to fix the PCB on it.
②: Type C interface position. Please solder the PCB of "Type C-5V" (see 5.1-(1)), solder the positive and negative pads to the XH2.54 terminal wire, and then insert the male end of the terminal wire into the "VIN" socket of the power supply board "UPS2" (note the positive and negative directions). The type C socket is inserted into the square hole shown in ② through the inside of the bottom shell and fixed with glue.
③: Antenna interface reserved position. Since the signals collected by the measurement board are very small, they may be affected by strong electromagnetic fields around them. Therefore, such a hole is reserved on the shell to bring out the antenna of the microcontroller.
If this is necessary, first solder the IPEX 1st generation antenna mount to the reserved position on the ESP32-WROVERB module, and change the soldering position of the nearby 0Ω resistor to connect it to the antenna mount (Baidu). Then use the IPEX to SMA adapter cable, connecting the IPEX end to the antenna mount, and leading the SMA mount end out from the inside of the bottom shell through the hole shown in ③, and fix it with glue. Then select the appropriate antenna according to the SMA interface type and install it on the SMA mount. The effect after installation is as follows:
Finally, apply tin foil to all exposed surfaces of the top and bottom shells to shield against electromagnetic interference.
④: Reserved position for the power board. Its size is basically the same as the PCB size of "UPS" or "UPS2". After the power board is soldered, it can be installed in this position. For "UPS2", there are two 3.5 diameter through holes on the PCB board and the bottom shell, which can be fixed with M3 bolts.
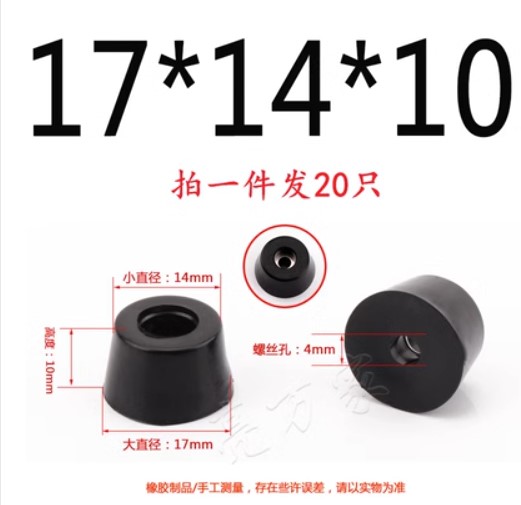
⑤: Four mounting feet. Fix them to the bottom shell with M3 bolts. You can refer to the following specifications (Taobao):
⑥: Rocker switch mounting port. The rocker switch uses a 14*9 single-pole single-throw specification. Press it into the mounting hole shown in ⑥ from the outside, and then solder the wires on both feet to the corresponding pads on the power PCB (see 5.1-(1)).
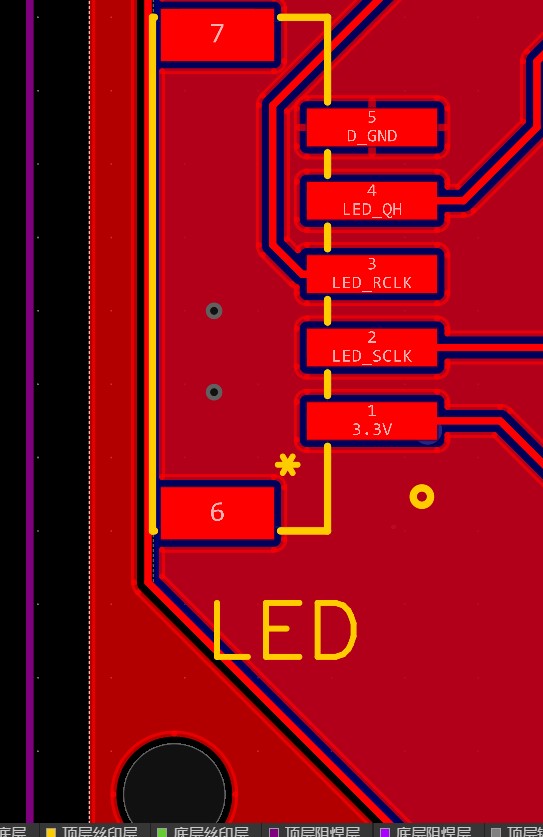
⑦: Four-digit LED display mounting port. Install the four-digit LED display from the inside and fix it with glue. Connect the pins to the XH2.54-1x5P socket on the measuring board using an adapter cable. The pins corresponding to each pad on the PCB are shown in the figure below. Please pay attention to the correspondence between the LED display pins and the XH2.54 socket when soldering.
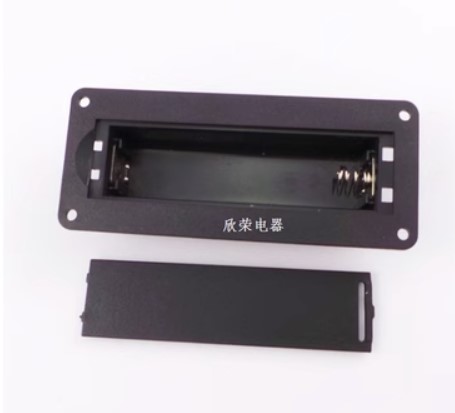
⑧: 18650 embedded battery box mounting position. In the new power supply design (“UPS2”), the 18650 battery is no longer used. Please leave this position empty. If using a PCB power supply solution called “UPS”, please install the battery box (from Taobao) shown in the figure below from the outside and fix it with glue.
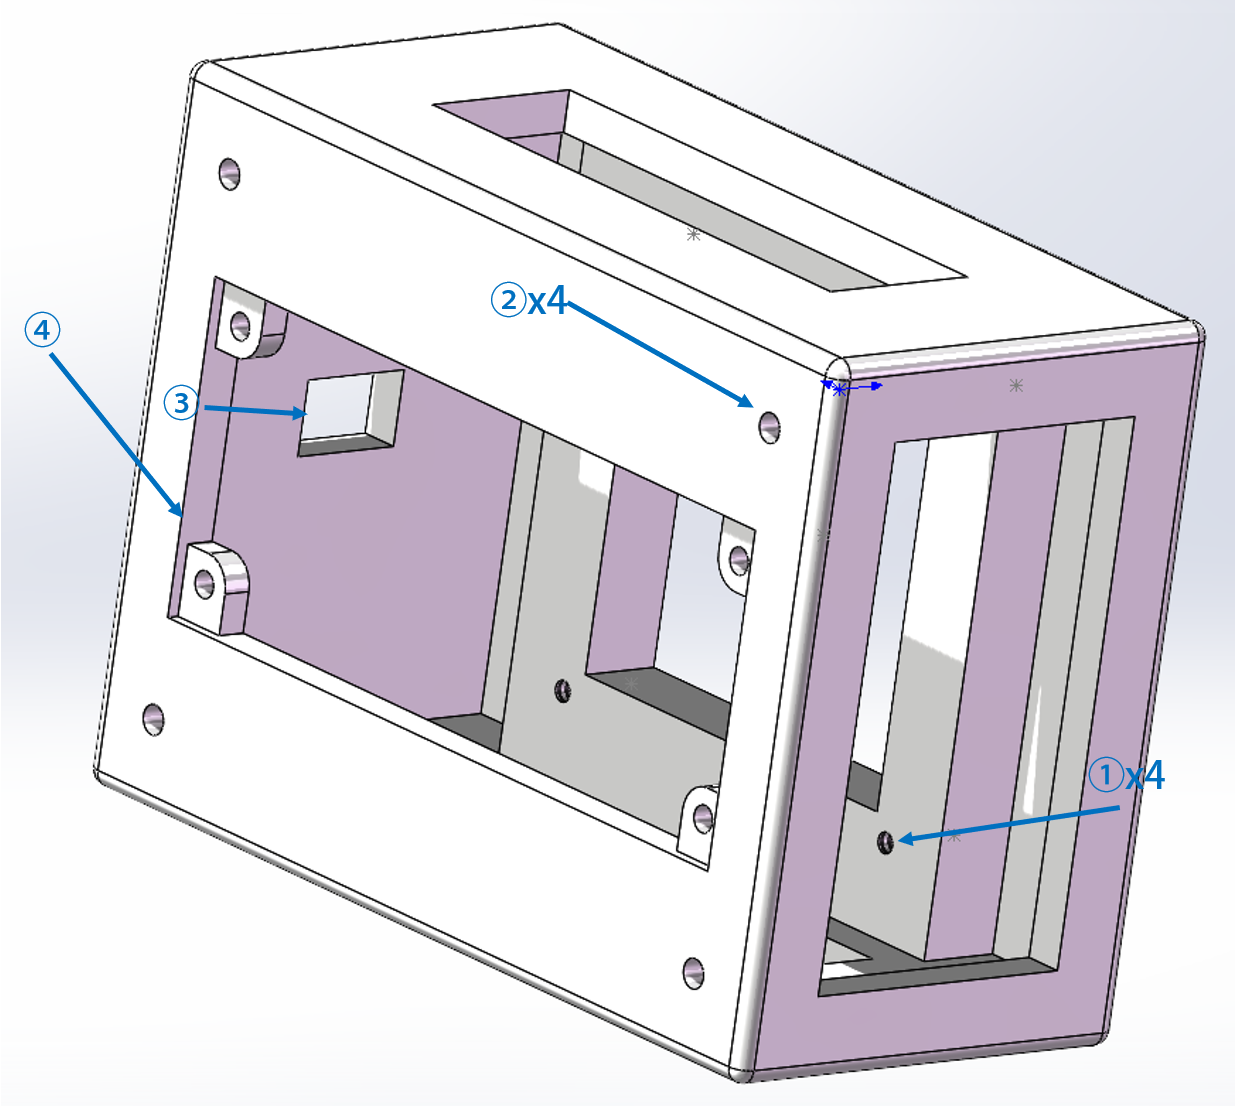
(2) Top cover
The side view of the top cover is as follows:
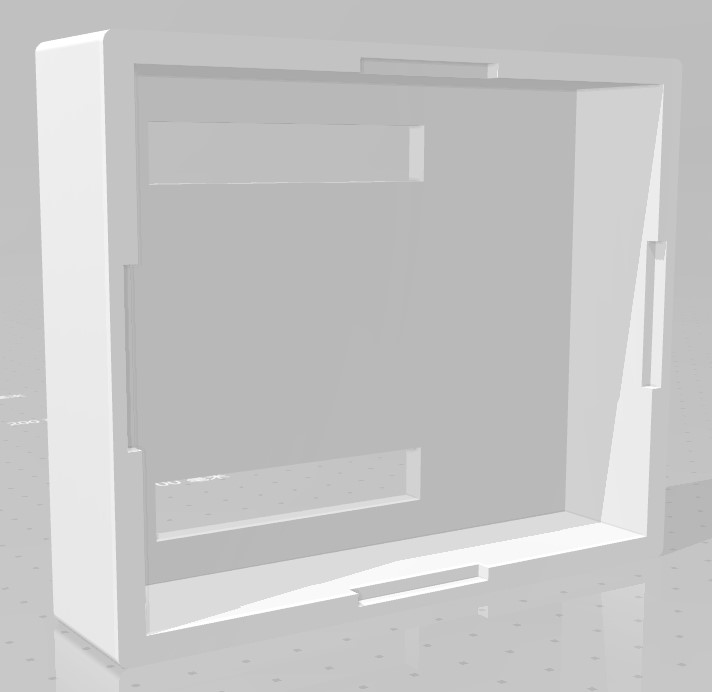
The top cover is installed on the bottom shell. There are two rectangular cutouts on the upper surface of the top cover. The wiring terminals of the measuring board PCB and the external wiring can be introduced through these cutouts.
6. Design and Function of Control Node
6.1 PCB Board
The control node consists of two PCB boards: a power supply board and a control board. In addition, the normal operation of the control node also requires a synchronizer and an emergency stop circuit, each of which has a PCB board.
(1) Power
Supply The power supply scheme is the same as that of the measurement node, so it will not be repeated here. Since the control node does not have high requirements for power quality, both the "UPS" and "UPS2" PCB boards can be used. The author recommends using the PCB board named "UPS" because it supports 18650 lithium batteries and is easy to replace.
(2) Control Board
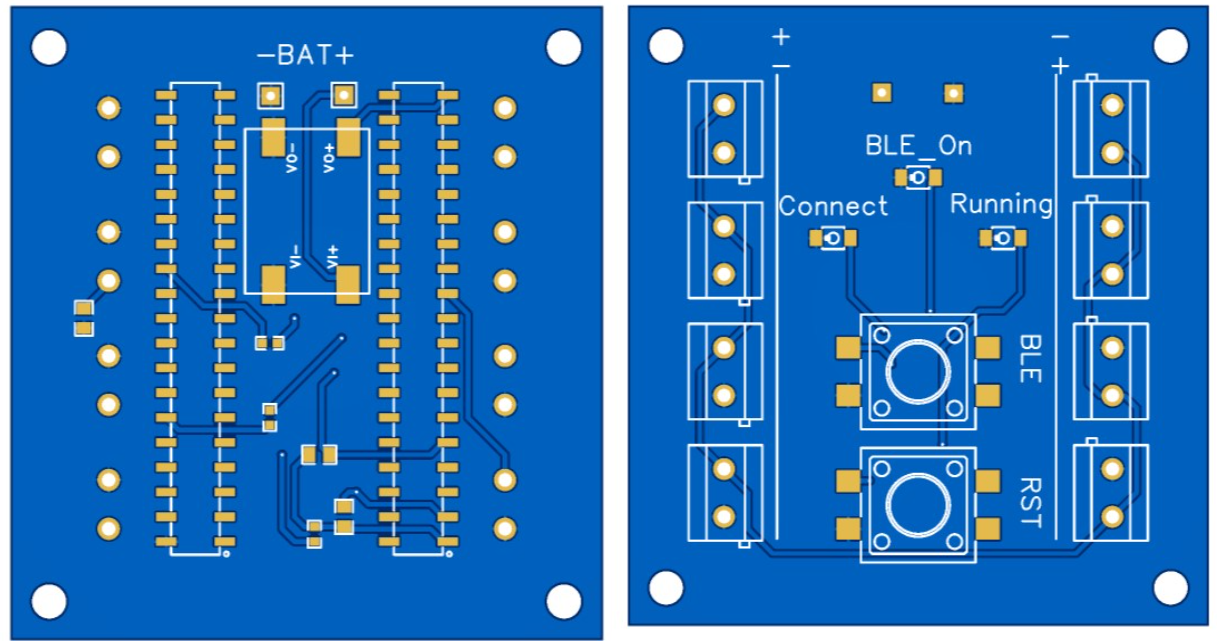
The PCB name of the control board is "USER_CTRL". It has an external power supply and uses a microcontroller to send control signals to change the state of eight solid-state relays, thereby changing the conduction and disconnection of the eight terminals with the power supply. The 2D diagram of the top and bottom surfaces of the PCB is as follows:

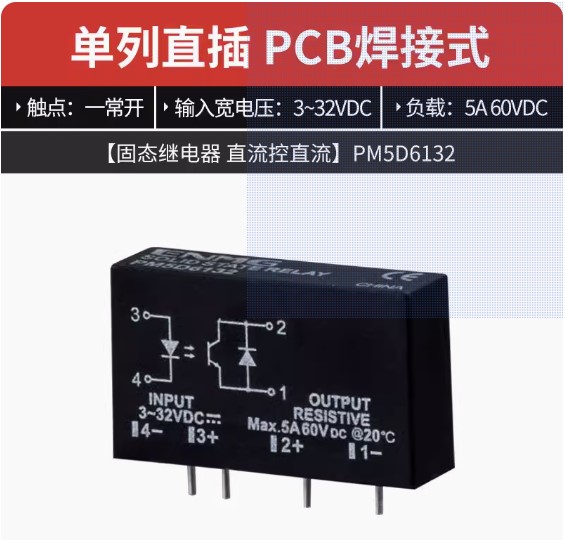
On the top surface of the PCB, the bottom is the installation position of the eight solid-state relays. The relay used is the pin-type PM5D6132 (from Taobao), as shown in the figure below:
The functions of each socket on the top surface are exactly the same as those of the measurement node.
On the bottom of the PCB, the "DC_in" silkscreened terminal on the left is the external power input terminal, directly connected to a DC power supply; the "Trig" marked on the upper right is the trigger signal input terminal, connected to the synchronizer's output channel.
Eight terminals are mounted on both sides of the bottom of the PCB. When a channel is open, a voltage will appear between the corresponding terminals, approximately the same magnitude as the external input voltage, in the same direction as the silkscreen; when the channel is closed, the terminals will exhibit a high impedance state.
The "RST" and "BLE" buttons on the bottom have the same function as the measurement nodes.
Six LED indicators are mounted on the bottom of the PCB, with the following functions:
① Ready: Lighting on indicates that the timing command from the server has been received, and the timing can be executed immediately upon the arrival of the trigger signal (the trigger signal will be explained below); not lighting on indicates that the timing command from the server has not been received, and the timing will not be executed upon the arrival of the trigger signal.
② BLE: Lighting on indicates that the device is in Bluetooth mode; not lighting on indicates that the device has exited Bluetooth mode.
③ Low_Power: Lighting on indicates that the battery is low
. ④ Running: Lighting on when the control board is powered on and off when power is lost.
⑤ Charging: Light up indicates charging.
⑥ Connect: Flashing indicates attempting to connect to WiFi; solid light indicates already connected to WiFi.
(3) Synchronizer
An experiment may require two or more control nodes to start executing the timing simultaneously. The latency of wireless networks can be tens of milliseconds. We cannot simply use sending and receiving commands to start these nodes simultaneously, which can sometimes lead to significant deviations or even cause the experiment to fail.
Therefore, the author designed a synchronizer, which connects to the trigger terminals of all control boards via wires. The microcontroller within the synchronizer stores a key beforehand; when the experiment begins, the server sends a start password containing the key to the synchronizer (see 4.5). If the two keys match, the synchronizer simultaneously generates a rising edge on all trigger wires, serving as the start signal for each control board. Testing showed that the synchronization deviation of the control boards under this start method does not exceed 0.3ms.
The synchronizer's PCB is named "TRIG2," and its top and bottom surfaces are shown below:
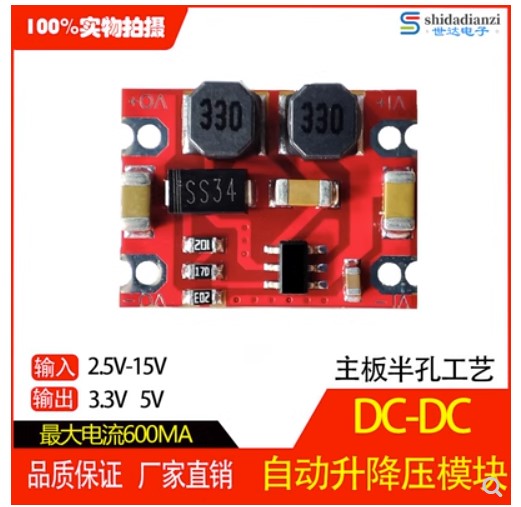
On the top surface, the pad with the silkscreen "BAT" is the single-cell lithium battery interface. The lithium battery leads are directly soldered to the corresponding position on the PCB. Below this, the component with four rectangular pads is a 5V DC-DC boost converter (available online), as shown below:
On the bottom surface, there are eight trigger signal transmitting terminals on each side, connected in parallel, with the positive and negative terminals as indicated by the silkscreen. During use, these terminals must be connected to the trigger receiving terminals of the control boards.
On the bottom, the functions of the indicator lights and buttons are the same as those on the control board, and will not be repeated here.
(4) Emergency stop board
experiment In case of an emergency, people can quickly press the emergency stop button to achieve protection. For the control board, in an emergency, some channels need to be closed, and the rest need to be kept open.
The PCB name of the emergency stop board is "EMER", and its schematic diagram is as follows.

In order for the emergency stop to work, please distinguish in advance which channels of each control board need to be closed and which need to be open in the emergency stop state. Then perform the following operations on the power supply of each control board and the channels that need to be open:
a. Solder the two ends of the DC power supply to the connection positions of +24V and GND respectively.
b. Lead out a wire from GND as the negative terminal of the external power supply of each control board; lead out a wire from the pad shown in ② as the positive terminal of the external power supply of each control board.
c. Select two normally open pins of an emergency stop switch, solder one end to the pad of +24V, and the other end to the pad shown in ①.
d. There are seven green terminals around the emergency stop board. For channels that need to be closed in emergency stop mode, connect the negative terminal of the channel directly to the load, connect its positive terminal to the positive terminal of the green terminal on the emergency stop board, and then lead a wire from the negative terminal of the green terminal on the emergency stop board to the load. Looking down from the top, in a clockwise direction, the two terminals of each green terminal are the positive and negative terminals respectively. See 6.1-(5) for the specific wiring diagram.
e. Press the emergency stop switch in emergency mode to disconnect all external voltages of all control boards. Channels not connected to the emergency stop board will be in a high-resistance state, and channels connected to the emergency stop board will output power supply voltage.
Note: When selecting wires, especially power supply wires, please pay attention to the magnitude of the load current on the wires and select the appropriate wire diameter according to the allowable temperature rise.
Note: One emergency stop board can support a maximum of seven channels that need to be open. If more emergency stop boards are needed to work together, please connect them to the same power supply and emergency stop switch.
Note: The pads of the emergency stop board are relatively compact. Please be careful to avoid short circuits caused by wire contact.
(5) The connection method of the control board, emergency stop board, trigger, power supply, emergency stop switch and load
is shown in the figure below (the microcontroller and its power supply have been omitted):
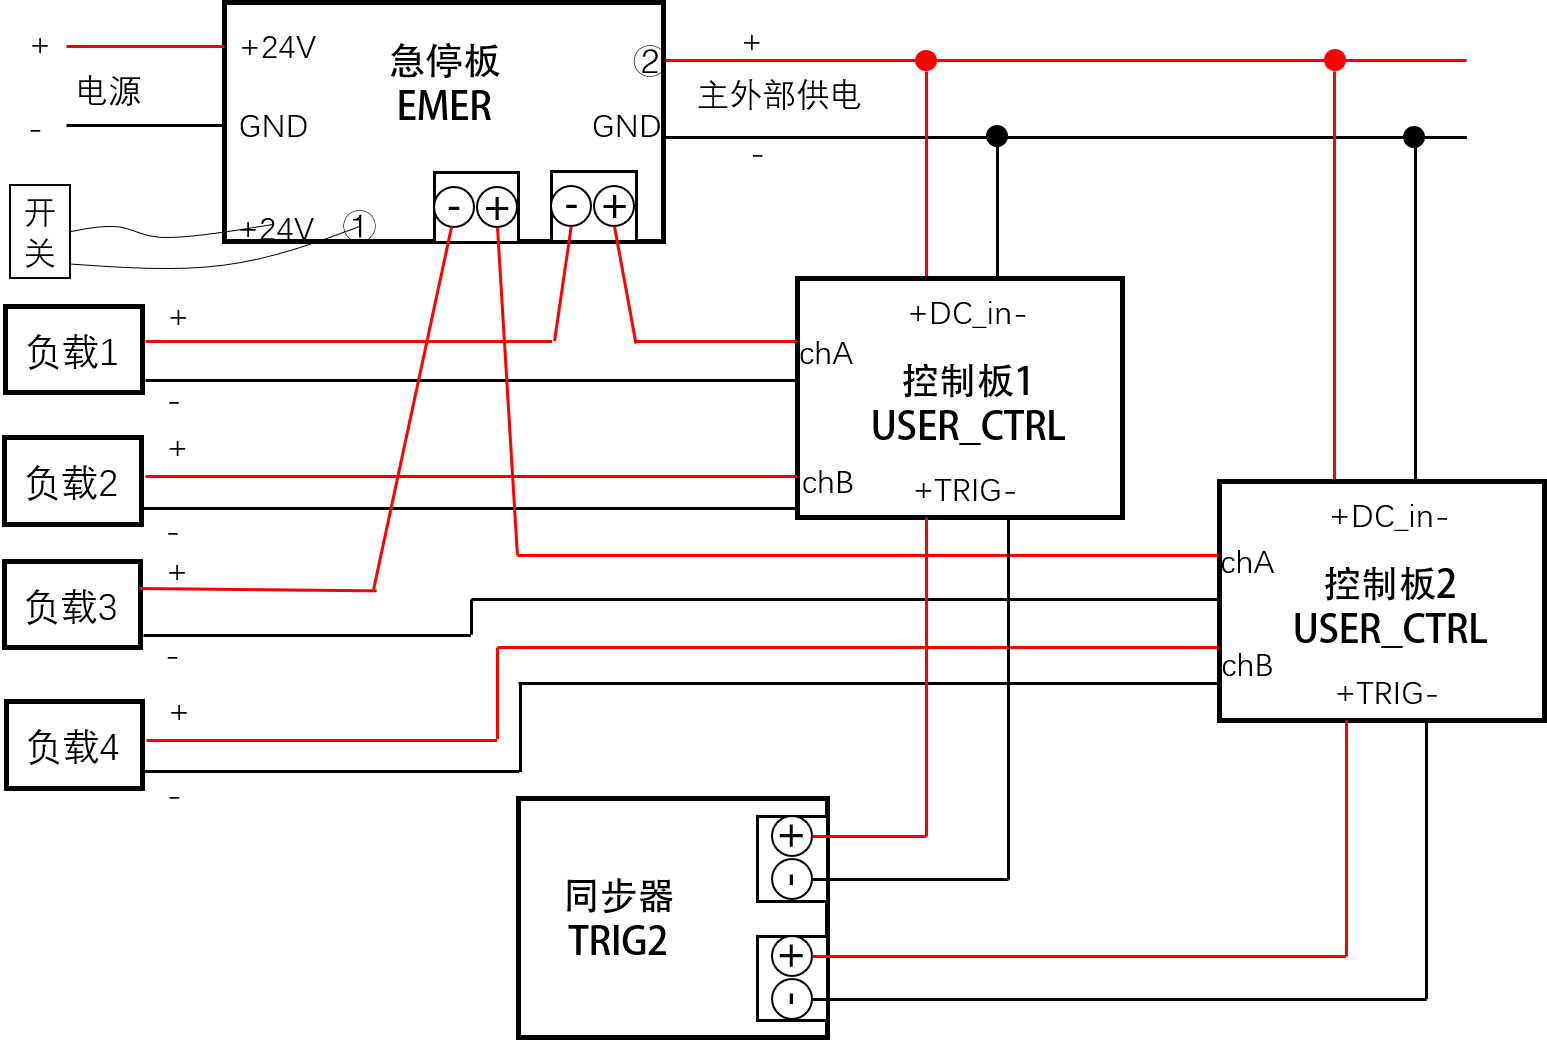
In the figure, loads 1 and 3 need to be powered on in emergency situations, and loads 2 and 4 need to be powered off in emergency situations.
Since the author used a 24V DC power supply during debugging, some pins have network names related to "24V". In fact, the input range of the external power supply is 5-30VDC, depending on the load.
6.2 The microcontroller
control board and synchronizer both use ESP-WROOM32 microcontrollers, as shown in the figure below (Taobao).
Both programs are compiled by ArduinoIDE. The Websocket library file can be found in the attachment "arduinoWebsockets-master".
6.2.1 Control board microcontroller program
The microcontroller program of the control board is USER_CONTROL.ino. Since the program calls Bluetooth and WiFi libraries, it requires a large memory footprint. Please adjust the partition mode to Huge_APP.
The following is an explanation of the microcontroller program:
(1) The timing trigger mechanism
is as described in 6.1-(3). If the control board wants to start the timing, it must first send a message to the microcontroller through the server to make it switch to the "waiting for trigger state" (see 4.5, at which time the "Ready" indicator light is on). Then, the synchronizer is operated to generate a specific level signal (trigger signal) and transmit it to the trigger terminal of the control board.
The trigger terminal is connected to a certain pin in the microcontroller. The microcontroller sets an interrupt for the trigger signal. After the trigger signal arrives, the microcontroller immediately starts to execute the already parsed timing until the timing is fully executed. Subsequently, the Ready indicator light goes out, the microcontroller waits for 1 second and then the state is restored, and the timing can be re-edited and sent to it.
The function of manually changing the state of a certain channel shown in 4.3-(2) is effective at any time when the microcontroller is not executing the timing. That is to say, manual control through the webpage does not require the microcontroller to be in the "waiting for trigger state", but timing start does.
(2) Bluetooth Function
Control Board The Bluetooth function of the microcontroller is basically the same as that of the measurement board, and supports the following message formats:
● “number:XXX”
● “ipv4:XXX.XXX.XXX.XXX”
● “ssid:XXXX”
● “psw:XXXXXXXX”
For details, see 5.2-(1).
6.2.2 Synchronizer Microcontroller Program
The microcontroller program of the synchronizer is TRIG2.ino. Since the program calls the Bluetooth and WiFi libraries, it requires a large amount of memory. Please adjust the partition mode to Huge_APP.
The following is an explanation of the microcontroller program:
(1) Bluetooth Function
In addition to the functions described in 6.2.1-(2), the microcontroller of the synchronizer also supports saving and modifying the startup key. The specific message format is:
sce:XXXXXXXX
Note: The startup key must be an eight-character visible string. If the length of the Bluetooth input key is greater than 8, the first eight characters will be truncated as the key and saved; if it is less than 8, an error will be reported and the key will be discarded.
(2)
Similar to the network synchronizer and control board, both set their own addresses through the corresponding values of the number parameter in the EEPROM and join the WebSocket network.
The author suggests setting the synchronizer's address to 080-089 and the control board's address to 001-079 for differentiation.
6.3 3D Shell
6.3.1 Control Board Housing
The side view of the control board housing is as follows:
Most of the housing design is similar to the bottom housing of the measurement node in 5.3-(1), and is only briefly described here:
① Four 2.5mm diameter through holes, tapped with M3 screws, for mounting the control board PCB
② Machine foot mounting holes, 3.5mm diameter
③ Boat switch mounting port, 14*9mm
④ Embedded battery box mounting port, installed from the outside, glued
⑤ LED four-digit digital tube mounting port, installed from the inside, glued
⑥ Power board mounting position. Either "UPS" or "UPS2" power board can make the microcontroller work normally. If the "UPS2" PCB is used, the battery box shown in ④ does not need to be installed.
⑦ Type C interface mounting position, installed from the inside, glued.
Since most of the signals in the control board are digital signals, they have strong anti-interference capabilities and generally do not require special protection against electromagnetic waves in the air.
6.3.2 Synchronizer Housing
The side view of the synchronizer housing is as follows:
Most of its design is similar to the bottom shell design of the measurement node in 5.3-(1), and is only briefly described here:
① Four through holes with a diameter of 2.5mm, used to install the synchronizer PCB. Please tap M3 and fix the PCB with bolts.
② Through hole for the machine foot, with a diameter of 3.5mm
③ Boat-shaped switch mounting port, 14*9mm
④ Embedded battery box mounting port, installed from the outside, glued.
There are some rectangular holes around the synchronizer, which are used to facilitate the installation of the PCB and the microcontroller. When installing, please complete all the soldering except for the switch first, install the PCB from the outside of the top surface of the housing, insert the microcontroller from the inside of the housing, and then install the battery box. Finally, lead out the wire from the switch hole, solder it to the pin of the switch outside the housing, and install the switch.
Note: The synchronizer does not support charging. If the 18650 battery is low, please remove it and charge it.
6.3.3 Emergency Stop Board Housing
Due to the large number of wiring connections and complex usage of the emergency stop board, a 3D housing has not yet been designed. This will be added in the subsequent project update.
7. How to use this system?
(1) Preparation:
● Create a reliable WiFi signal for the experimental area;
● Read the project instructions, prototype and solder all PCB boards
; ● 3D print the housing in the accessories, purchase the necessary parts, and assemble the measurement nodes, control nodes and synchronizers ;
● Refer to the “3.3V” pin of the microcontroller base in the PCB file and insert the microcontroller in a reasonable direction.
(2) Start measurement:
① Power on all the measurement nodes that need to be used and connect the sensors, then configure the nodes and network information via Bluetooth (ignore if already configured) (see 5.2-(1)).
② Modify the data processing function according to the requirements (see 5.2-(3)), and then start the server.
③ Open the auxiliary program and connect to the server.
④ In the “Measurement Node Management” tab of the auxiliary program, check the number of online links and their network latency.
⑤ After confirming all nodes are online, click "Execute Preparation" to start the measurement.
⑥ Open localhost/user_measure in your browser to view real-time data. For other users in the WLAN besides the server, please replace localhost with the server's address in the WLAN, for example: 192.168.43.5/user_measure
. ⑦ After the experiment, click "Execute Preparation" again to stop the measurement.
⑧ Go to the "installation directory datagetRCV" folder and find the corresponding log file (named by time, regenerated every time the server starts), which contains all the raw data collected.
⑨ Find the "work_dir" folder in the attachment, compile "data_deal.cpp" to obtain "data_deal.exe". Copy the log file from ⑧ to the "work_dir" folder, and then double-click "data_deal.exe". After a while, a CSV file with the same name as the log file will be automatically generated.
⑩ Open the CSV file, which contains all the collected data from the start to the end of the experiment, and has been automatically converted into physical quantity values.
Note: `work_dir` is a data processing program written in C++, which requires referencing `nlohmann/json.hpp` (see the attached file "json_develop", add the "single_include" folder to the reference directory). The functions for processing K-type thermocouples, 4-20mA current, and voltage signals in the program are `del_T`, `del_P`, and `del_V`, respectively. These functions take the raw voltage data (-4095~4096, mapped to -5~5V) as input and return the processed physical quantity value. For the K-type thermocouple processing function, the program includes a temperature-voltage calibration table, and its interpolation results are generally accurate; the author does not recommend modifying it.
⑪ If the microcontroller signal is lost during the experiment, please remove the SD card from the measurement board and insert it into the computer's card reader. The "dataRCV" directory on the SD card stores all historical measurement data, with filenames named "mXXX.txt", where larger filenames indicate more recent acquisition times.
Note: Naming errors may occur when there are too many historical files. The author suggests backing up the data on the SD card after each experiment, then clearing the "dataRCV" folder, and modifying the content of file_no.txt to "0" (without quotes, without newlines, just the number 0).
(3) Start control:
① Power on all the control nodes and synchronizers that need to be used, wire them as shown in 6.1-(5) and connect the load. Then configure the network information of the control nodes and synchronizers via Bluetooth (ignore if already configured), and configure the start key of this experiment via the synchronizer's Bluetooth (see 6.2).
② If timing control is used
, a. Open the auxiliary program and connect to the server
. b. Enter the "Timing Edit" tab to configure the timing of each channel and save the file locally.
c. Enter the "Timing View" tab to open the timing file, check the timing graph, and send it to the server (see 4.5).
d. Enter the "Control Node Management" tab to check the number of online links and their network latency. Click "Start Injection" to send the timing file to each node.
e. Click "Execution Preparation" to put each node into the waiting trigger state.
f. Go to the "Timing Startup" tab, enter the startup key, and click "Start". The timing will begin execution after 5 seconds.
g. In case of an emergency, immediately press the emergency stop button. The channel connected to the emergency stop board will open instantly, and the other channels will close instantly.
③ If using manual control
: a. Access "localhost/user_control" through your browser, register an account, and log in.
b. Add the required control channel name. The name format is "[s0XX]N", for example, [s009]A. (See 4.3-(2))
c. Control the opening and closing of the channel by clicking "ON/OFF".
8. Existing problems
(1) The power supply test is not sufficient, and the power supply design may be modified later.
(2) The control server will lock the user's login status, which may result in the inability to log in again after logging out. This problem is difficult to reproduce. Try to avoid closing the webpage by killing the process to reduce the occurrence of this problem.
(3) The measurement board may have an incorrect SD card file name. This problem is difficult to reproduce. Please clean up the SD card files in time.
9. Conclusion
I am a novice in electrical design, and many designs need to be optimized.
If you have any questions, please contact: rm-f@qq.com.
The open source project will be updated from time to time. The author will post the update log in the comments section. Welcome to follow.
============END============


 京公网安备 11010802033920号

 MSP430F2122IRHBR