LCSC VAMeter is a development board designed using the CW32 microcontroller from Chipsource Semiconductor, boasting excellent ADC performance. A voltage and current meter was designed using this board, capable of simultaneously measuring 0-30V voltage and 0-3A current with good accuracy. All documentation is open source; feel free to recreate it!
Product demonstration video: https://www.bilibili.com/video/BV1T8W4erEXn/#reply112995304803317
Notes before reading:
2024.9.10 Software Update: CW32_VAMeter_V3.0
【New】
Optimized current calculation based on ADC-I curve results from current experiments, changing the 0.5A and 1.5A calibration to three calibration points: 0.5A, 1A, and 2A, improving measurement accuracy;
added voltage and current calculation results via curve fitting (derived through experimental calculations, varying depending on hardware);
defaults to calculating voltage and current values via curve fitting (adjusting the Calculate_Mode parameter changes the default calculation method). In normal measurement mode, pressing the [Return] key switches to calibration calculation; pressing the [Calibration] key switches to curve fitting calculation.
[Optimization]
Optimized code for each module to improve readability;
integrated parameter constants into ConstParameter_Config.h, where Vref, the number of averages, default voltage and current configuration parameters, current and voltage calculation mode, and the slope K value of the 3V circuit can be modified.
2024.8.24 Software Update: CW32_VAMeter_V2.0
[New Features]
1. Reorganized code for each module to improve readability;
2. Added UART3 serial port debugging function (baud rate 115200);
3. Investigated the ADC error values of 3V, 30V, and 3A circuits, and the variation law of K value according to the linear fitting law (details in Chapter 5);
4. Optimized 5V and 15V calibration to 3V, 8V, and 15V calibration (currently the hardware only allows boost to 8V+, calibration points can be modified manually);
5. Added a 3V measurement circuit, automatically switching the measurement circuit when the voltage is less than 3V.
[Optimization]
If no user configuration is provided at startup, the default configuration will be read, and the digital tube bad sector detection program will be started.
[Fix]
Fixed the digital tube display driver error: when displaying two-digit tens (e.g., 90), "---" was incorrectly displayed; it should actually display 0.90.
Original text introduction:
I. Functional description (product functions, user manual, development tool description)
II. Hardware design (schematic diagram description, layout and soldering precautions)
III. Software design (software architecture, description of each functional module)
IV. Debugging and testing (analog measurement, analog calibration)
V. Research on calibration error and calibration point setting (updated 20240824)
VI. Conclusion
I. Functional description
1.1 Product functions
Application functions
support 0-30V voltage measurement, display accuracy 0.1V/0.01V; support 0-3V automatic range switching measurement, display accuracy 0.01V;
support 0-3A current ADC measurement, display accuracy 0.01A;
can detect the voltage and current values of the circuit under test in real time;
can detect the voltage and current values of the circuit under test simultaneously.
The learning function
utilizes the CW32 development board, aiding in learning the board's circuit principles, ADC functions, timers, and interrupts, and facilitating the learning of the KEIL MDK development environment.
It includes built-in analog voltage and current detection circuits, enabling learning of voltage and current measurement principles without other peripherals.
It also includes an analog calibration function for debugging during product development without other peripherals.
Safety features
include circuit protection for the MCU, reverse connection protection, and interface foolproofing.
1.2 Instructions for Use
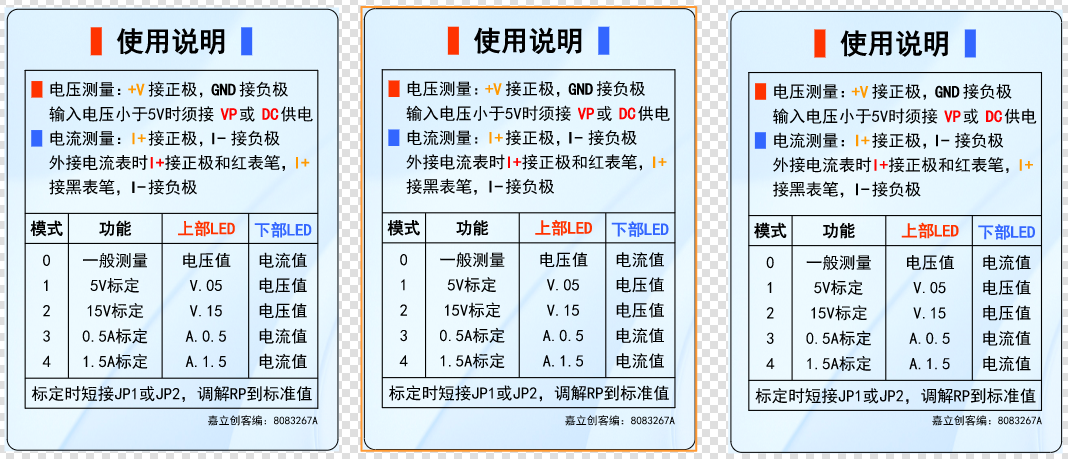
1. General
Voltage Measurement
Wiring: Connect the CH1 terminal to the circuit under test, with the yellow wire connected to the positive terminal and the black wire to the negative terminal. When the measured voltage is less than 5V, connect the power supply via the DC or VP red wire.
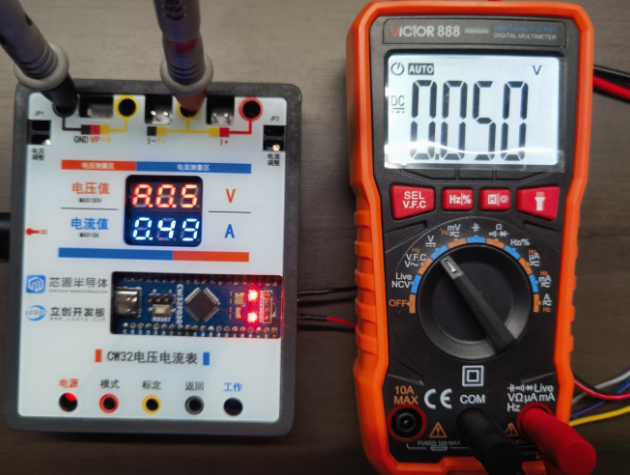
When verifying with an external voltmeter, connect the probes to the rubber sockets at both ends of CH1, with the red probe connected to the yellow socket and the black probe to the black socket.
The red digital tube displays the current voltage value of the circuit under test.
Current measurement
wiring: Connect the CN1 terminal to the circuit under test, with the yellow wire connected to the positive terminal and the black wire to the negative terminal
. When verifying with an external ammeter, connect the red terminal of CN2 (port 1) to the positive terminal, the red banana plug to the red probe of the ammeter, the yellow banana plug on the right to the black probe of the ammeter, and the black terminal of CN1 to the negative terminal.
The blue digital tube displays the current current value of the circuit under test.
2. Calibration
[Updated 2024.9.10]
Voltage calibration is adjusted to Mode 1-Mode 3:
Mode 1: Calibrate 3V voltage, the red digital tube displays [V.03], and the blue digital tube displays the current voltage value;
Mode 2: Calibrate 8V voltage, the red digital tube displays [V.08], and the blue digital tube displays the current voltage value;
Mode 3: Calibrate 15V voltage, the red digital tube displays [V.15], and the blue digital tube displays the current voltage value.
Current calibration adjustment to modes 4-6:
Mode 4: Calibrate 0.5A current, the red digital tube displays [A.0.5], and the blue digital tube displays the current current value;
Mode 5: Calibrate 1A current, the red digital tube displays [A.1.0], and the blue digital tube displays the current current value;
Mode 6: Calibrate 2A current, the red digital tube displays [A.2.0], and the blue digital tube displays the current current value.
Voltage calibration
wiring: Follow the voltage measurement wiring connected to the voltmeter.
Adjust the input voltage to 3V, the multimeter displays 3V, press the [Mode] button until the red digital tube displays [V.03], and the blue digital tube displays the voltage value before calibration, press the [Calibrate] button to complete the 5V calibration;
the rest are similar.
Current calibration
wiring: Follow the current measurement wiring connected to the ammeter.
Adjust the input current to 0.5A. The multimeter will display 500mA. Press the [Mode] button until the red digital tube displays [A.0.5] and the blue digital tube displays the current value before calibration. Press the [Calibrate] button to complete the 0.5A calibration. Repeat this
process for other values.
Note: When not using the onboard calibration function, it is not necessary to short-circuit JP and solder R0 simultaneously.
1.3 Development Tools
: LCSC CW32 development board;
multimeter;
soldering and auxiliary equipment (all components can be purchased from LCSC online store);
External terminals, cables, banana plugs, etc. (to be purchased separately);
program download and burning equipment.
II. Hardware Design
Introduction: The product implementation consists of six main parts: power supply circuit, voltage and current sampling circuit, voltage and current analog sampling and calibration circuit (optional), digital tube display circuit, button and LED indicator circuit, and peripheral interface circuit.
2.1 Schematic Diagram Description
2.1.1 Power Supply Circuit
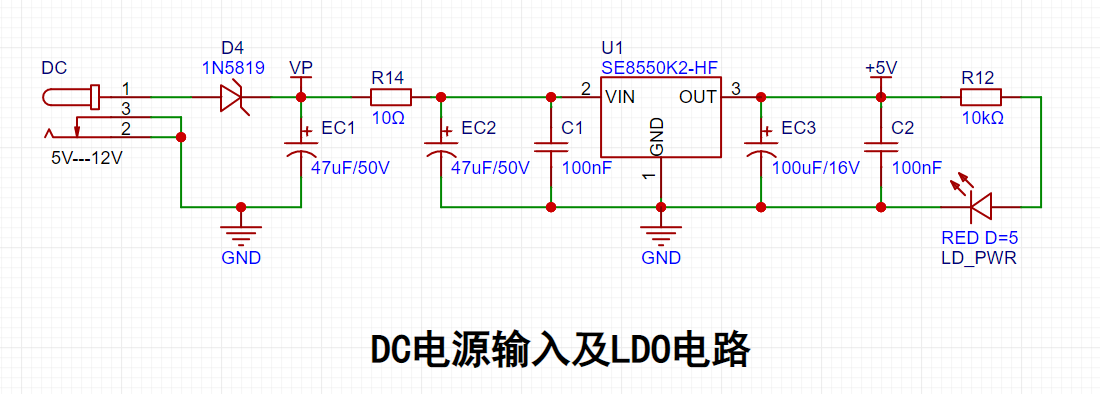
Key Points:
Power Input: Two points are set, connected via DC interface or VP;
LDO Selection: Requires sufficiently high input voltage (this voltmeter is mostly used in 24V-36V power supply industrial scenarios), good heat dissipation, 5V output (actually, 3V3 is insufficient to power the digital tube and development board), and low cost, therefore SE8550K2 is selected;
Filtering Circuit: The capacitor design follows the principle of large first, then small, first using electrolytic capacitors to filter low-frequency waves, then using ceramic capacitors to filter high-frequency waves;
Circuit Protection: Schottky diode 1N5189 with low voltage drop (within 0.2V) for reverse connection protection, and a series 10-ohm resistor for overcurrent and short circuit protection.
2.1.2 Voltage Sampling Circuit

Principle Description:
Based on the series voltage divider principle, taking 30V DC as an example, with the CW32's ADC 1.5V as the reference voltage, the maximum range must be 30V. The voltage division ratio is calculated.

Commonly used resistors with a voltage measurement margin are selected, using a combination of 10K and 220K resistors. The actual range is approximately 34V.
Similarly, for the 0-3V circuit, a 1:1 voltage division ratio of 10K is chosen.
Key points:
Circuit protection: Use clamping diodes 1N4148 to protect the MCU pins;
Range switching detection: Voltage sampling is set to 0-3V and 0-30V. When the voltage is within 3V, the measurement accuracy can be further improved.
2.1.3 Current Sampling Circuit
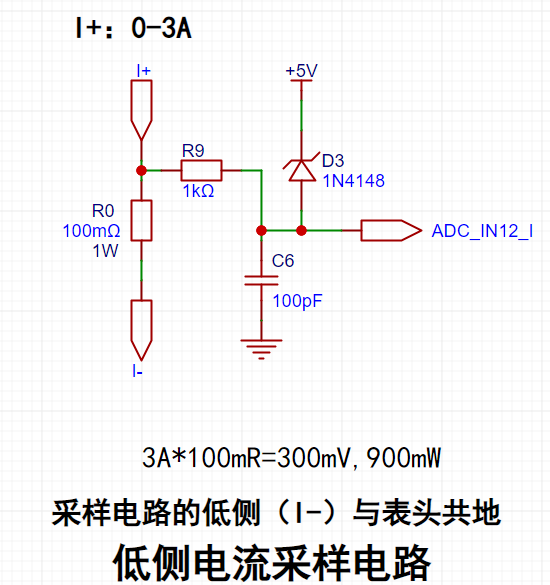
Principle Description:
Current detection is essentially voltage detection. The designed current is 0-3A. The sampling circuit needs to be connected in series with the circuit under test. The voltage drop at the small resistor R0 is measured by the ADC, and the circuit current can be calculated by combining this voltage drop with the resistance value of R0 itself.
Key points:
Sampling resistor selection: First, it should not generate a large voltage drop to reduce interference to the circuit under test; second, it should be selected with a suitable package to reduce power consumption and temperature. Therefore, R0 is selected with a resistance of 100 milliohms and a power of 1W.
Circuit protection: A 1K resistor is connected in series at the ADC to limit the current and protect the pin. A clamping diode 1N4148 is used to protect the MCU pin. The series resistor and the connected capacitor act as filters to improve the accuracy of analog-to-digital conversion.
2.1.4 Analog Sampling and Calibration Circuit
1. Analog Voltage Measurement and Calibration

Key points:
When VP is connected to the power supply, the sliding rheostat RP1 can simulate a voltage of 0-VP.
A TL431 circuit is used to provide a 2.5V reference voltage for calibrating the external voltage of the MCU's AD converter. Referring to the CW32 technical manual, it is found that its ADC performance can still achieve good accuracy without the calibration of this circuit.
After connecting the external power supply, shorting JP1 realizes the analog measurement function. 2. Key Points for
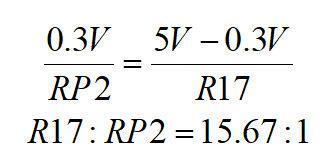
Analog Current Measurement and Calibration : Based on the series voltage divider principle, when the measured current at I+ is 3A, the voltage at that point is 300mV; therefore, the maximum voltage drop across RP2 in the analog circuit should be 300mV. According to the series voltage divider principle, the calculated resistance ratio is: in reality, to ensure the voltage across RP2 is smaller, the resistance of R17 needs to be larger. Referring to commonly used resistance values, R17 = 200KΩ and RP2 = 10KΩ, the actual maximum analog resistance is approximately 238mV, meaning the voltage connected to I+ is within the range of 0-2.38A. The essence of analog measurement is still measuring the voltage connected to I+; therefore, the original measurement circuit is transformed into using an ADC to measure the sliding voltage value of RP, so the R0 circuit connection must be disconnected. After connecting the external power supply, R0 is not soldered, and JP2 is shorted to achieve the analog measurement function. 2.1.5 Other Circuits: The principles of other circuits are simple; only the key points are mentioned here, and the principles will not be elaborated further. 1. Key points of the digital tube display circuit : Use a common cathode digital tube; select appropriate digital tube parameters based on the MCU's I/O port high-level current sinking/pulling capability. 2. Key points of the button and LED indicator circuit : Use 3 buttons for switching functions; two LEDs indicate power input and operating status; the MCU's current sinking capability is greater than its current pulling capability, therefore the LEDs are designed to be active low. 3. Key points of the peripheral interface circuit: Peripheral access is divided into two parts: one is the detection terminal block, and the other is the multimeter probe insertion point (banana socket); add one VP line for voltage connection, which requires external circuit when the operating voltage is less than 5V; set two terminals for current connection, one for general measurement and the other for verification measurement with an ammeter; select a 2mm banana socket for the multimeter probe insertion point, filter personal package diagrams in the component library when designing the schematic, or draw your own. 2.2 Layout Considerations 1. Trace Width Requirements: Power lines should be as wide as possible, between 20-60 mil; ordinary signal lines 10 mil; ADC signal lines 8 mil or 10 mil; ground lines should consider local copper plating and large trace width, while minimizing ground line length. 2. Ground Line Requirements: This PCB should not have full-board copper plating. Use a single-point grounding method with series connections within groups and parallel connections between groups; widen and fill local areas of the parallel main ground line to ensure the same potential at the grounding point; pay attention to separating the power ground at I- and the signal ground of the measurement circuit. 3. Sampling Resistor R0 Connection: Utilize the Kelvin connection method to eliminate the influence of line resistance and contact resistance on the measurement results. 2.3 PCB Soldering Precautions: Through-hole capacitors, Schottky diodes, and LEDs have positive and negative terminals; carefully refer to the product manual to accurately identify the polarity. Digital tubes have low temperature resistance; avoid contact with the hot soldering iron. Other (to be added later)... Completed soldering diagram: Completed product hardware diagram: III. Software Design Introduction: The software design enables the independent operation of each module in the hardware circuit and the coordinated operation between modules, thereby realizing the product's functions. 3.1 Software Architecture The above diagram shows the necessary modules and program functions for the CW32 ammeter to achieve its functions. It mainly includes the following parts: Basic modules: RCC clock module, GPIO startup module; Core modules: BTIM interrupt control, ADC analog-to-digital conversion module;


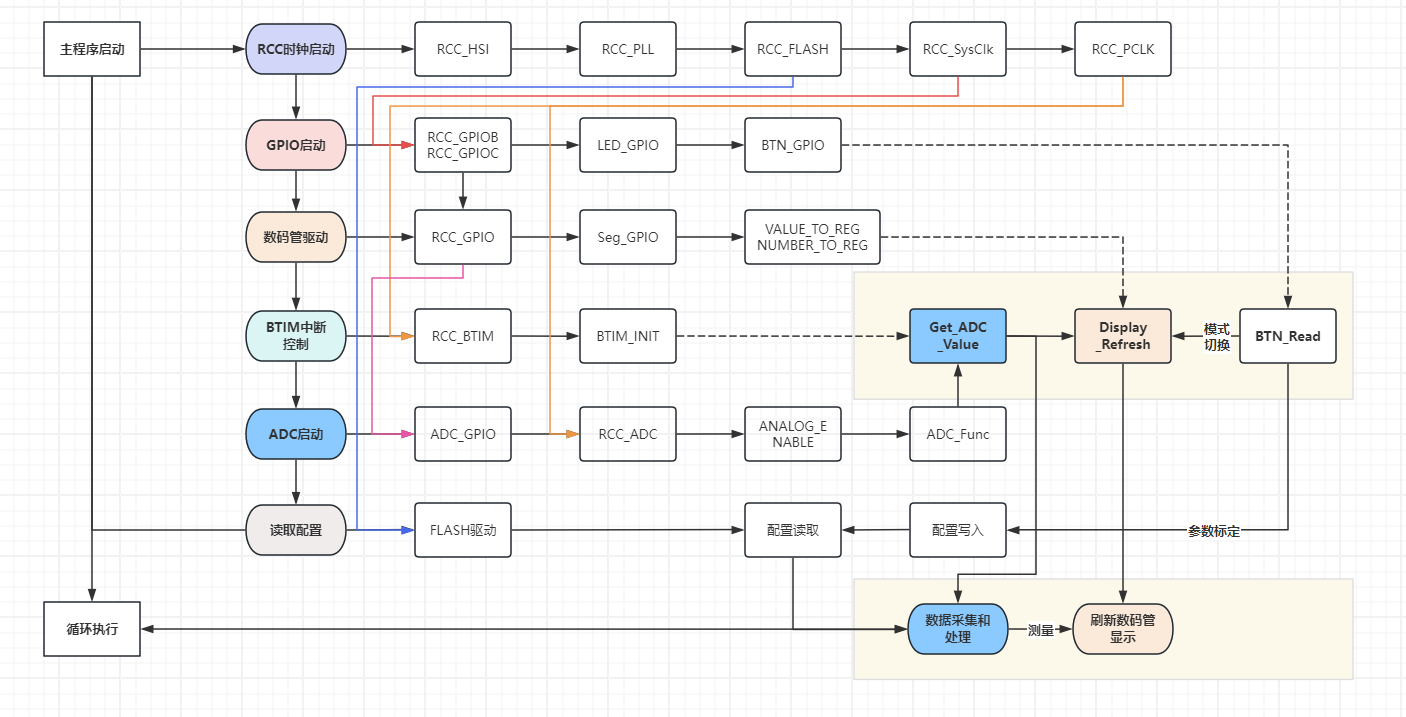
Peripheral modules: LED driver, digital tube driver, button driver;
Auxiliary modules: data storage and data processing.
The main logic of this architecture for voltage and current meter measurement is as follows:
the clock and GPIO provide the tick foundation and pin initialization for each functional module;
the BTIM interrupt controls data acquisition, button operation, and display update;
the ADC analog-to-digital conversion realizes the data acquisition of circuit measurement;
the buttons realize function switching and parameter calibration functions;
the raw data is updated and displayed by the digital tube after data processing;
configuration storage realizes the power-on configuration memory of parameter calibration;
two loop mechanisms are used (the area with background in the figure):
the BTIM interrupt control, together with the clock, realizes the internal calculation of data acquisition, data display, and reading of buttons;
the While loop realizes external data processing and digital tube display update.
3.2 Brief description of modules
1. RCC clock configuration

According to the internal clock tree of the system, different modules rely on different CLKs:
HCLK is used for SYStick, FLASH, and GPIO functions;
PCLK is used for BTIM and ADC functions.
2. GPIO Configuration
The following modules require initialization via GPIO configuration:
peripheral devices such as LEDs, BUTTONs, and digital tubes;
voltage and current measurement pins PB0/PB1/PB10/PB11 require ADC analog-to-digital conversion to be enabled.
3.
Key Points for the ADC Module:
After starting the GPIO, configure the corresponding pin to ADC mode, and initialize the ADC clock, structure, and sequence channels (refer to the user manual);
use ADC_GetSqrXResult to obtain the data stored in the corresponding channel register;
to ensure the stability of the voltage and current values acquired by the ADC, a mean filtering method is used here. By processing 100 samples, the maximum and minimum values are removed from the data, and the mean value is calculated to obtain a stable value within a certain period (it should be 100ms according to the clock frequency, but this is questionable), effectively stabilizing the data display and eliminating data fluctuation interference;
the data processing module DATA_process processes the raw data after initial sampling and mean averaging, and performs corresponding calculations according to the circuit design principles:
the voltage value is the actual sampled voltage × 100, and the data unit is 10mV (related to the digital tube driver, see Chapter 5. Digital Tube Driver Module | Dynamic Display);
the current value is the actual sampled current, and the data unit is 10mA (related to the digital tube driver, see Chapter 5. Digital Tube Driver Module | Dynamic Display). (Dynamic display);
voltage and current value calculation introduces calibration parameter calculation;
for specific principles, applications, and parameter introduction, please refer to the attached project code.
[Updated 2024.8.24]
Regarding the ADC sampling frequency, the code sets the division factor to 128; the course attachment sets the division factor to 4; actual testing shows that when the division factor is 4, the ADC sampling is not 0 when the voltage and current are 0, therefore it is recommended to use a division factor of 128.
4. The BTIM control interrupt module
uses the CW32's built-in BTIM interrupt controller, combined with the clock to perform interrupt operations and periodically process specific tasks:
Task 1: Obtain ADC variables (see Chapter 3. ADC Module);
Task 2: Digital tube update display: display the data in the digital tube display buffer area;
Task 3: Read button control:
Button 1: Switch Mode, and read different data according to different modes and update the digital tube display content;
Button 2: Calibration setting, when pressed, the parameters are stored in FLASH and the slope is calculated and the digital tube is updated;
Button 3: Return to Mode 0, i.e., normal measurement mode, and update the digital tube display.
In addition, BTIM is also configured with an LED buffer update counter (timecount) and an LED blink counter (ledcount) to help implement the corresponding functions.
5. Digital Tube Driver Module
The digital tube driver module implements functions such as data encoding (unit display), dynamic display (three-digit display), and bad sector detection:
Data Encoding: According to the schematic diagram, it encodes numbers and characters such as 0-9/0.-9./A./V./-/. to display specific information;
Dynamic Display: Combines data encoding to realize the display of digital and character information:
Digital Display: Input 2-5 digits (meaning a number with 2 decimal places, multiplied by 100), and displays XXX, XX.X, X.XX, 0.XX according to the number of digits;
Character Information: Configured with Mode 1-4 four display modes, displaying V05, V15, A.0.5, A.1.5 respectively;
Other Information: such as "---" when no data is connected;
Bad Sector Detection Function: Selectively enabled or set to be enabled by a button, used to switch the display from 000 to 9.9.9 to detect bad sectors on the digital tube.
6. The FLASH storage module
relies on the Flash.c driver to realize the storage and calculation of calibration values:
The calibration parameter configuration includes X05/X15/IX05/IX15, which represent the data values measured by the corresponding voltage/current ADC pins, and their Y-axis mappings are 5V, 15V, 0.5A, and 1.5A, respectively. Parameter calibration stores the parameters measured by the current pin in the corresponding variables;
Configuration storage: Data is read each time the device is powered on. If the read data does not start with 0xaa, the default configuration is read; otherwise, the stored data is read; When the calibration button is pressed, the corresponding value is calculated and written to Flash;
Parameter calculation: This part involves the parameter calibration principle, see Chapter 4 for details.
7. Other modules
This project also includes a debugging module for the early stages of development, which facilitates developers in configuring the environment and verifying the development board circuit during the early stages of debugging.
LED module: LED_shine.c
Button control LED module: BUTTON_LED_TEST
IV. Debugging and testing
The voltage and current meters need to be verified in terms of hardware and software design during the development process. The rationality of the software design is tested by simulating sampling and calibration circuits.
This device has built-in analog sampling and calibration circuits, making it convenient for beginners to develop when they lack the necessary equipment, reducing the learning cost. Of course, device debugging and testing can also be achieved through an external adjustable power supply, oscilloscope, or other auxiliary development boards.
This article only uses the built-in analog sampling and calibration circuits for debugging and testing. The operation of analog measurement and analog calibration is shown in the video.
4.1 Analog Measurement
When the analog circuit is connected to the measurement circuit, analog measurement can be achieved.
1. Voltage Measurement
Analog measurement implementation:
Wiring rules: After connecting to DC or VP power supply (it is recommended that the voltage be less than the range), short-circuit JP1;
Measurement Implementation: Adjust the input voltage via RP1, and the measurement circuit measures the sliding voltage of RP.
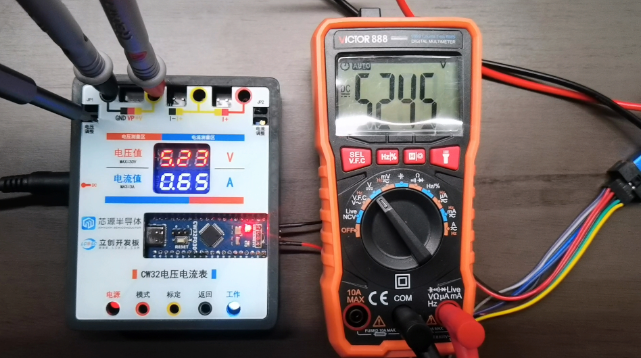
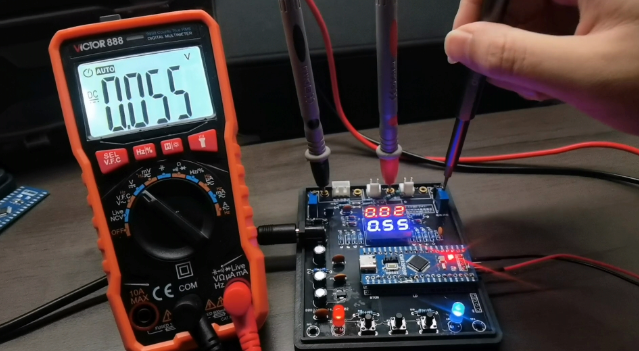
Measurement Verification: Set the multimeter to the voltage range, connect the red probe to T_V, and the black probe to TGND. This is equivalent to connecting the multimeter in parallel to the circuit under test. During normal measurements, the multimeter and the red digital tube display the same value.
Implementation in Common Scenarios:
General Measurement: Do not short-circuit JP1. Connect the measurement circuit in parallel to the circuit under test. Connect the yellow wire (+V) of CH1 to the positive terminal of the circuit under test, and the black wire (GND) to the negative terminal. When the measured circuit voltage is less than 5V, an external DC power supply or the red wire (VP) of CH1 needs to be connected.
Verification Measurement: The multimeter connection method remains unchanged.
2. Current Measurement
Simulation Measurement Implementation:
Wiring Rules: After connecting to DC or VP power supply, short-circuit JP2, and do not solder the current sensing resistor R0.
Measurement Implementation: Measuring current is essentially measuring voltage. Since the resistance of R0 is 0.1 ohms, 10 times the voltage across it is the actual current value, so only voltage is measured. The analog circuit is connected to a 5V voltage. After the voltage drop through R17, it can simulate a voltage of 0-0.238V, which can simulate a range of 0-2.38A. Dynamic current measurement is achieved by adjusting RP2.
Measurement verification: Set the multimeter to the voltage range, connect the red probe to T_I+, and the black probe to TGND. This is equivalent to connecting the multimeter in parallel to the circuit under test and measuring the voltage at I+. At this time, the voltmeter reading is 10 times smaller than the reading on the blue digital tube, indicating that the simulated current (multiplied by 10) is the same as the digital tube display.
Implementation in common scenarios:
General measurement: After soldering R0, do not short-circuit JP2. Connect the measuring circuit in series with the circuit under test. Connect the yellow wire (I+) of CN1 to the positive terminal of the circuit under test, and the black wire (I-) to the negative terminal of the circuit under test. When the measuring circuit voltage is less than 5V, an external DC power supply is required.
Verification Measurement: After soldering R0, do not short-circuit JP2. Connect the measurement circuit and multimeter (set to current range) in series to the circuit under test. Connect pin 1 of CN2 to the positive terminal of the circuit under test, T_A to the red probe of the multimeter, I+ to the black probe of the multimeter, and the black wire (I-) of pin 2 of CN1 to the negative terminal of the circuit under test. This verification measurement differs from the analog verification measurement wiring method and requires attention.
4.2 Analog Calibration
uses a three-point calibration method. By default, the measurement result when the ADC is at 0V is also 0V or 0A. Therefore, only the other two measurement points need to be calibrated. Furthermore, the more calibration points, the more accurate the measured data, i.e., the more accurate the AD-voltage/current value mapping curve fitting. Readers can optimize the calibration algorithm themselves.
[Updated 2024.9.10]
This section has been updated in the 1.2 usage instructions; the following is the original text and will not be adjusted. See section 1.2 for updated content.
In addition, to improve the accuracy of current calibration, the error of the R0 resistance value needs to be considered. Therefore, it is recommended to perform real value calibration instead of analog calibration after soldering R0.
1. Analog Voltage Calibration
5V Voltage Calibration
Analog Calibration Method:
Wiring principle: Same as the wiring for voltage analog measurement, note the short circuit of JP1;
In normal measurement mode, press the [Mode] button once, the red digital tube displays [V.05], and the blue LED keeps flashing. At this time, you enter the 5V voltage calibration mode, and the blue digital tube displays the currently measured voltage;
Adjust the RP1 value until the multimeter voltage value displays 5V;
Press the [Calibration] button, the blue LED becomes solid, the system switches to normal measurement mode, the red digital tube resumes displaying the voltage value of 5V, and the calibration is complete.

Standard Calibration Implementation:
Wiring Principle: Same as the standard multimeter wiring method;
Operation method is the same as step 2 above;
Adjust the external voltage value to 5V until the multimeter voltage value displays 5V;
Press the [Calibration] button, the blue LED light becomes constantly lit, the system switches to normal measurement mode, the red digital tube resumes displaying the voltage value of 5V, and the calibration is complete.
15V calibration will not be described in detail.
2. Simulated Current Calibration
0.5A Voltage Calibration
Simulated Calibration Method:
Wiring Principle: Same as the current simulation measurement wiring (note that R0 should not be soldered, and JP2 should be shorted);
In normal measurement mode, press the [Mode] button three times, the red digital tube displays [A.0.5], the blue LED light continues to flash, at this time, it enters the 0.5A current calibration mode, the blue digital tube displays the currently measured current;
Adjust the RP2 value until the multimeter voltage value displays 0.050V;
Press the [Calibration] button, the blue LED light becomes constantly lit, the system switches to normal measurement mode, the blue digital tube displays the current value of 0.5A, and the calibration is complete.
Calibration in a normal scenario:
Wiring principle: Same as the wiring method for an external multimeter in a normal scenario (note that R0 must be soldered);
Operation method is the same as step two above;
Adjust the external current value to 0.5A until the multimeter current value displays 0.5A (at this point, because R0 has been soldered, it can be calibrated according to the current measurement method);
Press the [Calibration] button, the blue LED light becomes constantly lit, the system switches to normal measurement mode, the red digital tube resumes displaying the voltage value of 5V, and the calibration is complete.
1.5A calibration will not be elaborated further.
V. Research on calibration error and calibration point setting (updated 20240910)
Origin of the problem: When using resistors with poor accuracy to build the measurement circuit, or due to soldering, software, or other issues, it can lead to a nonlinear mapping relationship between the ADC sampled value and the actual value (voltage and current value). Therefore, even using the 3-point calibration method cannot guarantee full-range accuracy. This is why the voltage sampling is adjusted to 3V, 8V, and 15V for calibration.
The following sampling tests were conducted on various measurement circuits:
Test Condition 1: When using a 30V circuit for measurement, the accuracy deviation
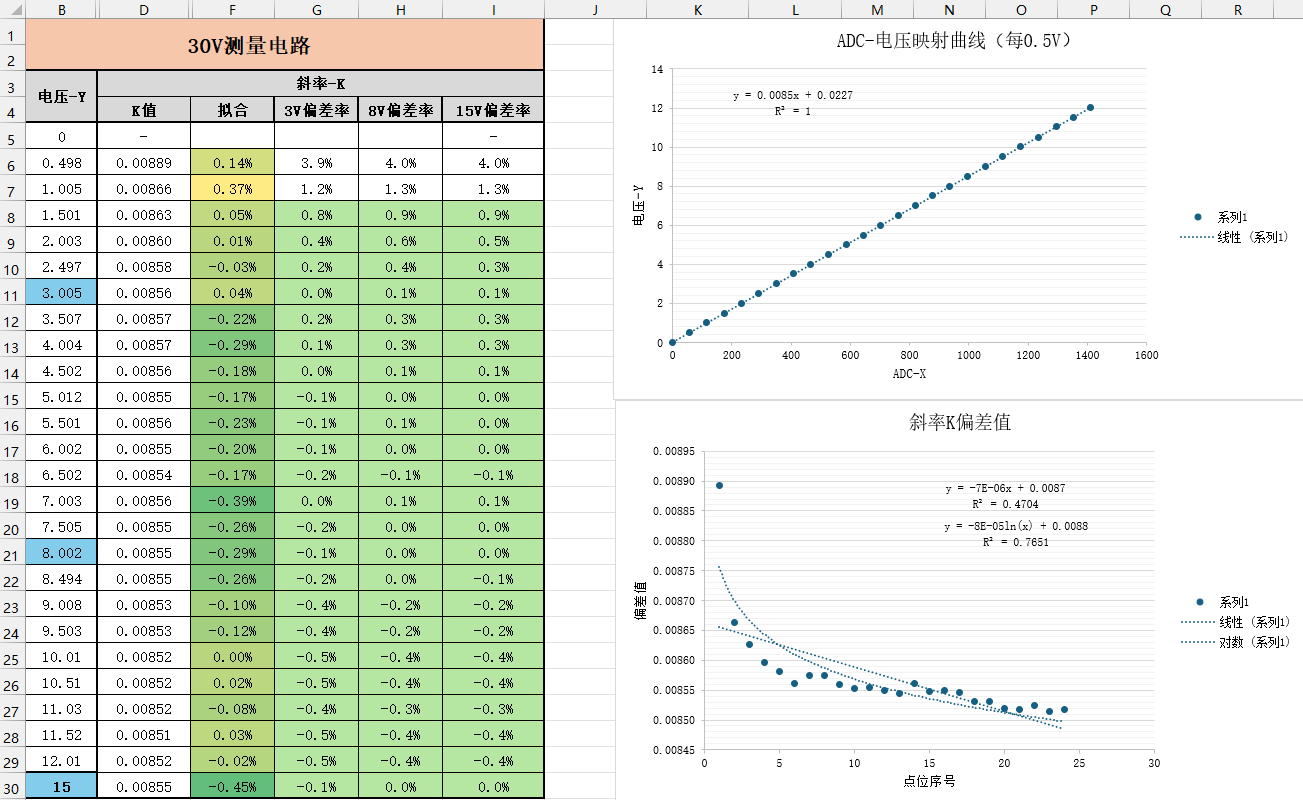
of the ADC-voltage mapping curve showed a strong linear correlation, indicating that the linear calibration algorithm was reasonable, with the K value deviation mostly within 1%.
However, when using the linear calibration algorithm, the K (slope) varied for different voltage values, especially with higher deviation rates at lower voltages.
Solution:
Use a segmented calibration method: The K value deviation is larger when the voltage is below 3V. Adjust the original 5V calibration range to two calibration points, 3V and 8V, which can guarantee accuracy in the 3V-8V range (I often use the 3V3-5V condition during development). Of course, the drawback of this method is that the voltage deviation is larger within 3V, which can be solved by Solution 2.
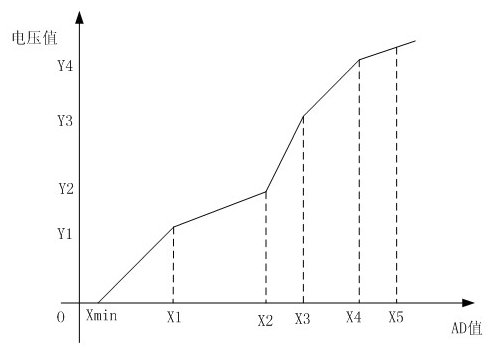
For the case of large deviation at small voltages, linear fitting was performed on the K value change. The above figure briefly shows linear and logarithmic fitting. Logarithmic fitting has a better correlation, and the constant K can be adjusted to a logarithmic function during voltage calculation to improve accuracy.
[Updated 2024.9.10]
The program has added a K value fitting curve. The curve fitted using experimental points calculates the voltage value based on the fitting formula when the ADC reads the value, which yields good results. However, the curve is hardware-dependent and unique; different devices require experimental fitting and parameter modification.
The program includes a calculation mode switch, defaulting to using the fitted curve for calculation.
Test
Condition Two: Accuracy Deviation When Measuring with a 3V Circuit
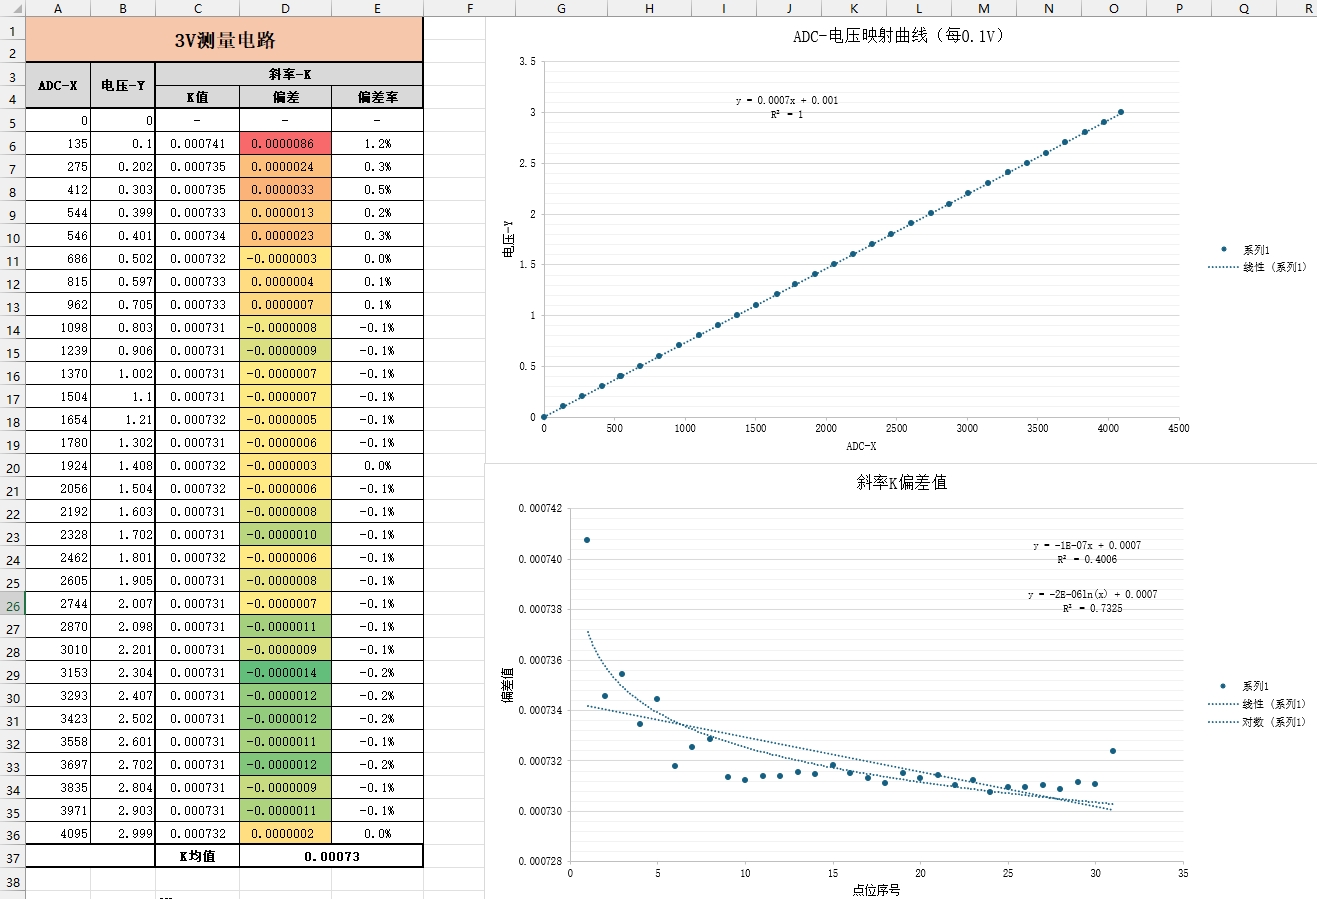
The ADC-voltage mapping curve exhibits a strong linear correlation, making the linear calibration algorithm reasonable, with K-value deviations generally within 1%. However,
when using the linear calibration algorithm, the K (slope) varies for different voltage values, especially at lower voltages (around 0.5V), where the deviation is higher.
Solution:
Research shows that when the voltage is above 0.2V, especially above 0.5V, the K-value deviation is less than 5% or even 0.1%, thus K can be considered constant. Experiments showed that setting K to 0.00073 yielded good measurement results, therefore 3V circuit calibration is no longer required. This method is only applicable to this measurement object; readers with other applications can add a 3V circuit calibration value or adjust the value in my code.
For cases with large deviations at small voltages, linear fitting of the K-value variation can also be performed. The above figure briefly illustrates linear and logarithmic fitting; logarithmic fitting shows better correlation. The constant K can be adjusted to a logarithmic function during voltage calculation to improve accuracy
.
Test Condition 3: When measuring with a 3A circuit, the accuracy deviation

of the ADC-voltage mapping curve shows a strong linear correlation, indicating that a linear calibration algorithm is reasonable, but the K-value deviation is relatively large.
When using the linear calibration algorithm, the K (slope) corresponding to different voltage values changes, roughly presenting three segments (the first segment is before 0.2A, i.e., 20mV, with a large linear decreasing trend; the second segment is around 0.3A-0.9A, with a small linear decreasing trend; the third segment is after 0.9A, with stable linearity).
Solution:
My commonly used development environment is between 0.2A and 1.5A. Following the original tutorial, the 0.5A calibration value can be defaulted to the K-mean value of the second segment; and the 1.5A calibration value can be defaulted to the K-mean value of the third segment. This method requires further accuracy verification. Accuracy optimization can be achieved through piecewise K-value fitting and full-curve K-value fitting. [Updated 2024.9.10] Comparing K values of 0.5A, 1A, and 2A, it was found that the range is basically covered with an error within 1%. Therefore, the current calibration was adjusted to these three points.
When performing piecewise K-value fitting, linear fitting can be performed on one to three segments respectively. Theoretically, this fitting effect can achieve very good accuracy.
Perform full-curve K-value fitting. At this point, the fitting degree of linear fitting is already very poor, and other methods such as logarithmic fitting can be considered.
[Updated 2024.9.10]
The program has added a K-value fitting curve. Through the curve fitted by experimental points, when the ADC reads the value, the current value is calculated according to the fitting formula. Compared with multi-point fitting, the calculation is simpler and saves the tedious calibration operation. However, the curve is hardware-dependent and unique. Different devices need to be fitted and the parameters modified through experiments before burning.
The program has added a calculation mode switch, which uses the fitted curve calculation by default.
Summary
:
The reason for adding research content on calibration error and calibration point setting in this chapter is to correct the discrepancies between the development board and the software system. When developing measuring instruments, it's crucial to consider not only theoretical accuracy errors but also the accuracy of hardware and circuit measurements. Software-based specification correction can better address hardware and circuit errors, resulting in more accurate and stable equipment.
VI. Conclusion
This project took one month to complete. Through the LCSC platform and this project experience, I learned PCB design, component soldering, 3D casing and panel design, CW32 GeoStar development board, and engineering software design. I also gained an understanding of the working principles of voltmeters and ammeters and improved my debugging skills.
Please point out any errors or misunderstandings in the document. Thank you.


 京公网安备 11010802033920号

 189HT038XO2540