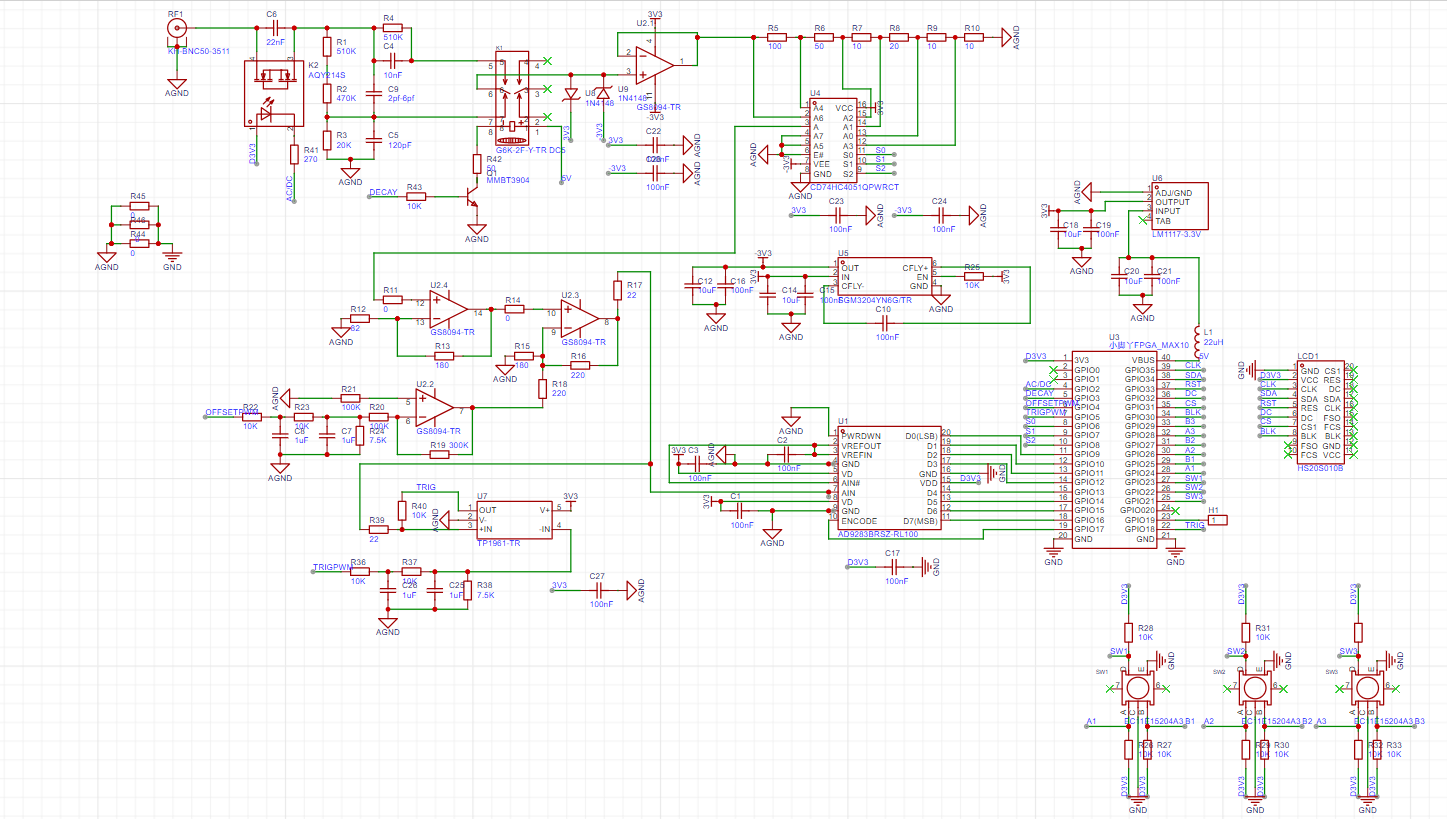
 The above diagram shows the overall circuit, which includes: input attenuation, input follower, gain selection, signal amplification, signal offset, high-speed ADC, FPGA section, LCD display, and encoder section. The design principles of each part will be explained step by step below.
 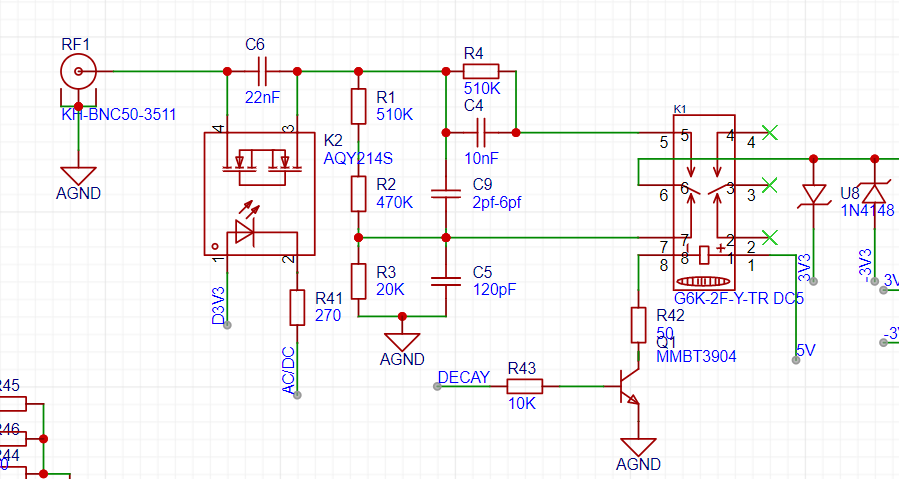 The input uses a BNC socket, and the signal enters a small 22nF capacitor. This capacitor, together with the subsequent 1M resistor network, forms a high-pass filter with a cutoff frequency of approximately 1/(2*pi*R*C) = 7Hz. This filters out DC signals during AC coupling. An optocoupler is used; when the optocoupler is conducting, the small capacitor is short-circuited, resulting in DC coupling, allowing DC current to pass through. The subsequent resistor network forms a 1x or 1/50x attenuation, which can be selected via a relay to enable higher voltage input measurements. The attenuation resistor network needs to be compensated with a capacitor. Two Schottky diodes are connected after the relay for amplitude limiting, ensuring the safety of the op-amp and FPGA. Note that the signal relay electromagnet has positive and negative terminals; reversing the connection will prevent it from engaging.
  This part is the signal attenuation programmable network. It uses an external resistor voltage divider and an analog switch for selection, switching different connectors to select different voltage levels. Therefore, the voltage level switching is actually accomplished by this part combined with the attenuation from the preceding relay. The selection of these resistor values, when combined, allows for a 1-2-5 level adjustment, with a minimum of 10mV/div and a maximum of 10V/div.
 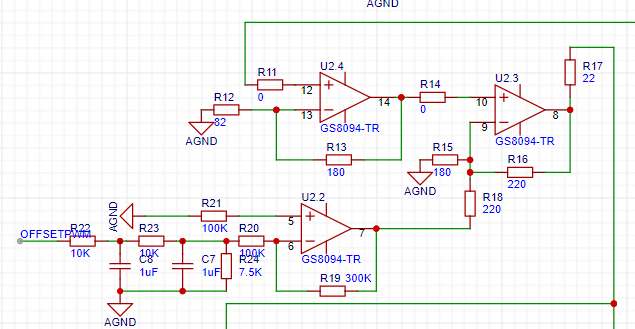 This part is the signal conditioning circuit. Op-amp U2.4 forms a non-inverting amplifier circuit with a gain of 1 + (180/82) = 3.2. Then it enters U2.3, which is an adder circuit with a gain of 1 + (220/(180//220)) = 3.2. Op-amp U2.2 amplifies the DC bias voltage formed by the previous filter circuit by a factor of 4. These circuits amplify and condition the signal.
  This is a 100M high-speed ADC circuit. The chip has a full-scale range of 1.024Vpp, a differential input of 0.512V, and a built-in reference of 1.25V. Therefore, connecting the reference to AIN# transforms it into a single-ended input ADC with an input voltage of 0.738~1.762V, perfectly matching the previous stage.
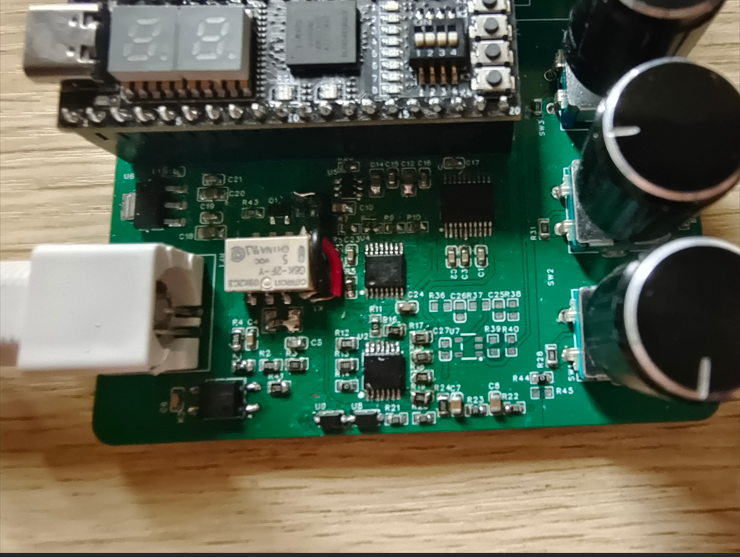
 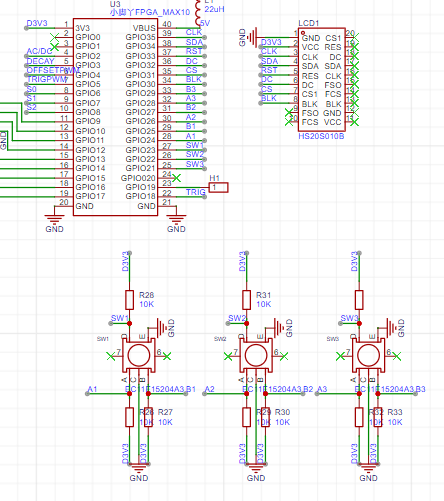 This section covers the FPGA and human-machine interface, employing three encoders for flexible parameter adjustment. The LCD uses a 240*320 resolution screen for better display.
  overview: As shown above, there is a screen display and three operable encoders. The bottom encoder can be rotated to adjust the time base; pressing it switches to trigger voltage adjustment. The middle encoder can be rotated to adjust the vertical voltage level; pressing it switches to vertical offset adjustment. The top encoder is multi-functional, implementing all other functions.
  The interface is shown in the figure. A pre-trigger design ensures the starting point is on the center line. The right side displays various functions; rotating the top encoder selects the function, and pressing it changes the corresponding function. The first line is for AC/DC coupling selection. The second line is for trigger mode, with options for automatic trigger, standard trigger, and single trigger. The third line is for pause/run selection and display. The fourth line is for rising edge trigger/falling edge trigger selection. The bottom two are for scale measurement; rotating to this option displays a scale on the screen, which is adjusted by rotating the middle and bottom encoders to achieve measurement. The next two levels are displayed. The green component at the bottom is a frequency meter, implemented in Verilog. It generates pulses using a digital hysteresis comparator and then measures the number of pulses per second to calculate the frequency.
  As shown in the image above, the dashed line represents the 0V level, while the solid line represents the trigger level.
  The image above also shows the measurement scale.
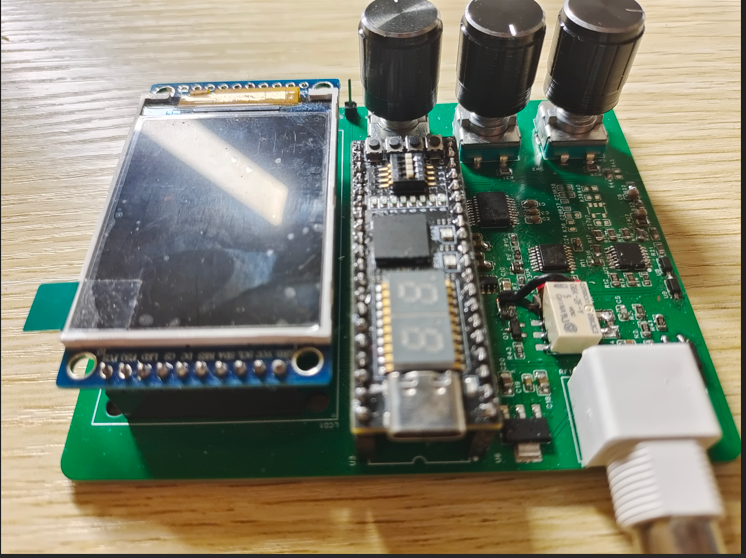
 For more demonstrations, please see the video: https://www.bilibili.com/video/BV1dx4y127Gr/?spm_id_from=333.999.0.0&vd_source=636867b2f0c1dcf14017b0301fd407d3

All reference designs on this site are sourced from major semiconductor manufacturers or collected online for learning and research. The copyright belongs to the semiconductor manufacturer or the original author. If you believe that the reference design of this site infringes upon your relevant rights and interests, please send us a rights notice. As a neutral platform service provider, we will take measures to delete the relevant content in accordance with relevant laws after receiving the relevant notice from the rights holder. Please send relevant notifications to email: bbs_service@eeworld.com.cn.
It is your responsibility to test the circuit yourself and determine its suitability for you. EEWorld will not be liable for direct, indirect, special, incidental, consequential or punitive damages arising from any cause or anything connected to any reference design used.
Supported by EEWorld Datasheet
EEWorld
subscription
account

EEWorld
service
account

Automotive
development
community

Robot
development
community

About Us Customer Service Contact Information Datasheet Sitemap LatestNews


Room 1530, 15th Floor, Building B,
No.18 Zhongguancun Street,
Haidian District,
Beijing, Postal Code: 100190
China
Telephone: 008610 8235 0740
 京公网安备 11010802033920号

 LPI3112A21715