This LCSC training camp uses the Hardwood Classroom H750 core board to build a simple oscilloscope expansion board. This oscilloscope can be used for simple measurements in everyday electronics projects.
H750 Core Board Introduction:
Hardwood Classroom H750 Core Board Purchase Link Hardwood Classroom STM32 Electronics Design Competition Learning Board Open Source Pocket Instrument Software Radio FM Walkie-Talkie - Taobao (taobao.com)

The H750 uses the STM32H750VBT6 MCU, a high-performance ARM Cortex-M7 MCU with DSP and DP-FPU, featuring 128 KB Flash, 1 MB RAM, 480 MHz CPU, L1 cache, external memory interface, JPEG codec, hardware encryption, and numerous peripherals.
Those with hands-on skills can also directly integrate the chip onto the oscilloscope expansion board, saving costs and reducing the overall size of the oscilloscope.
Simple Oscilloscope Expansion Board Introduction:

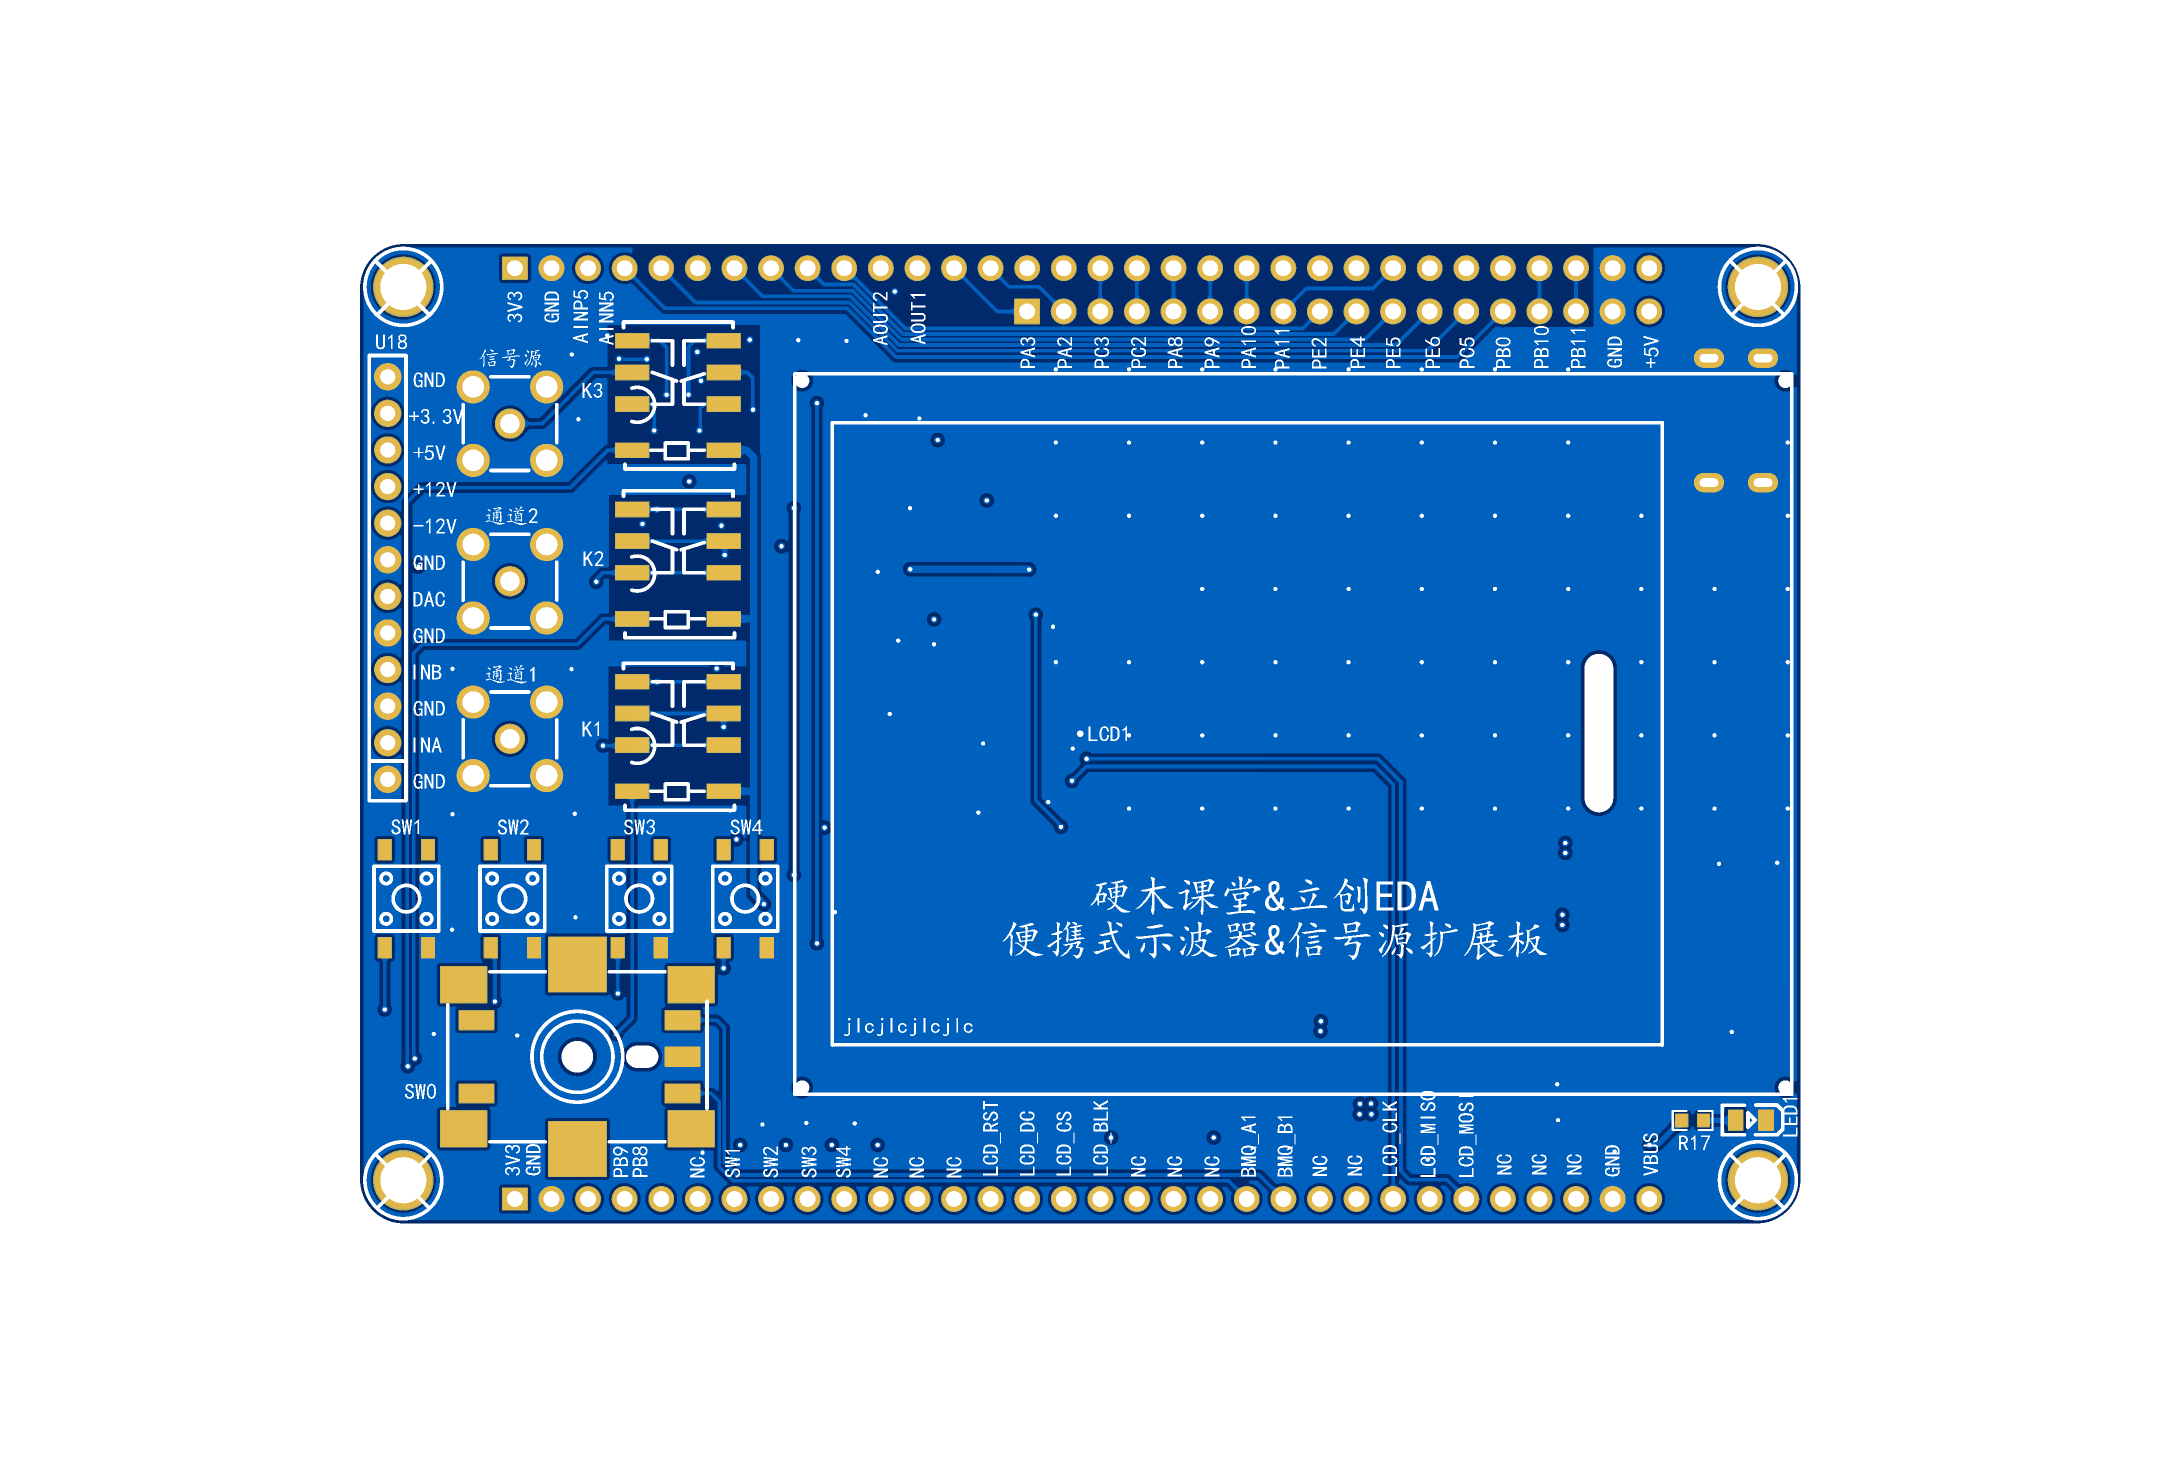
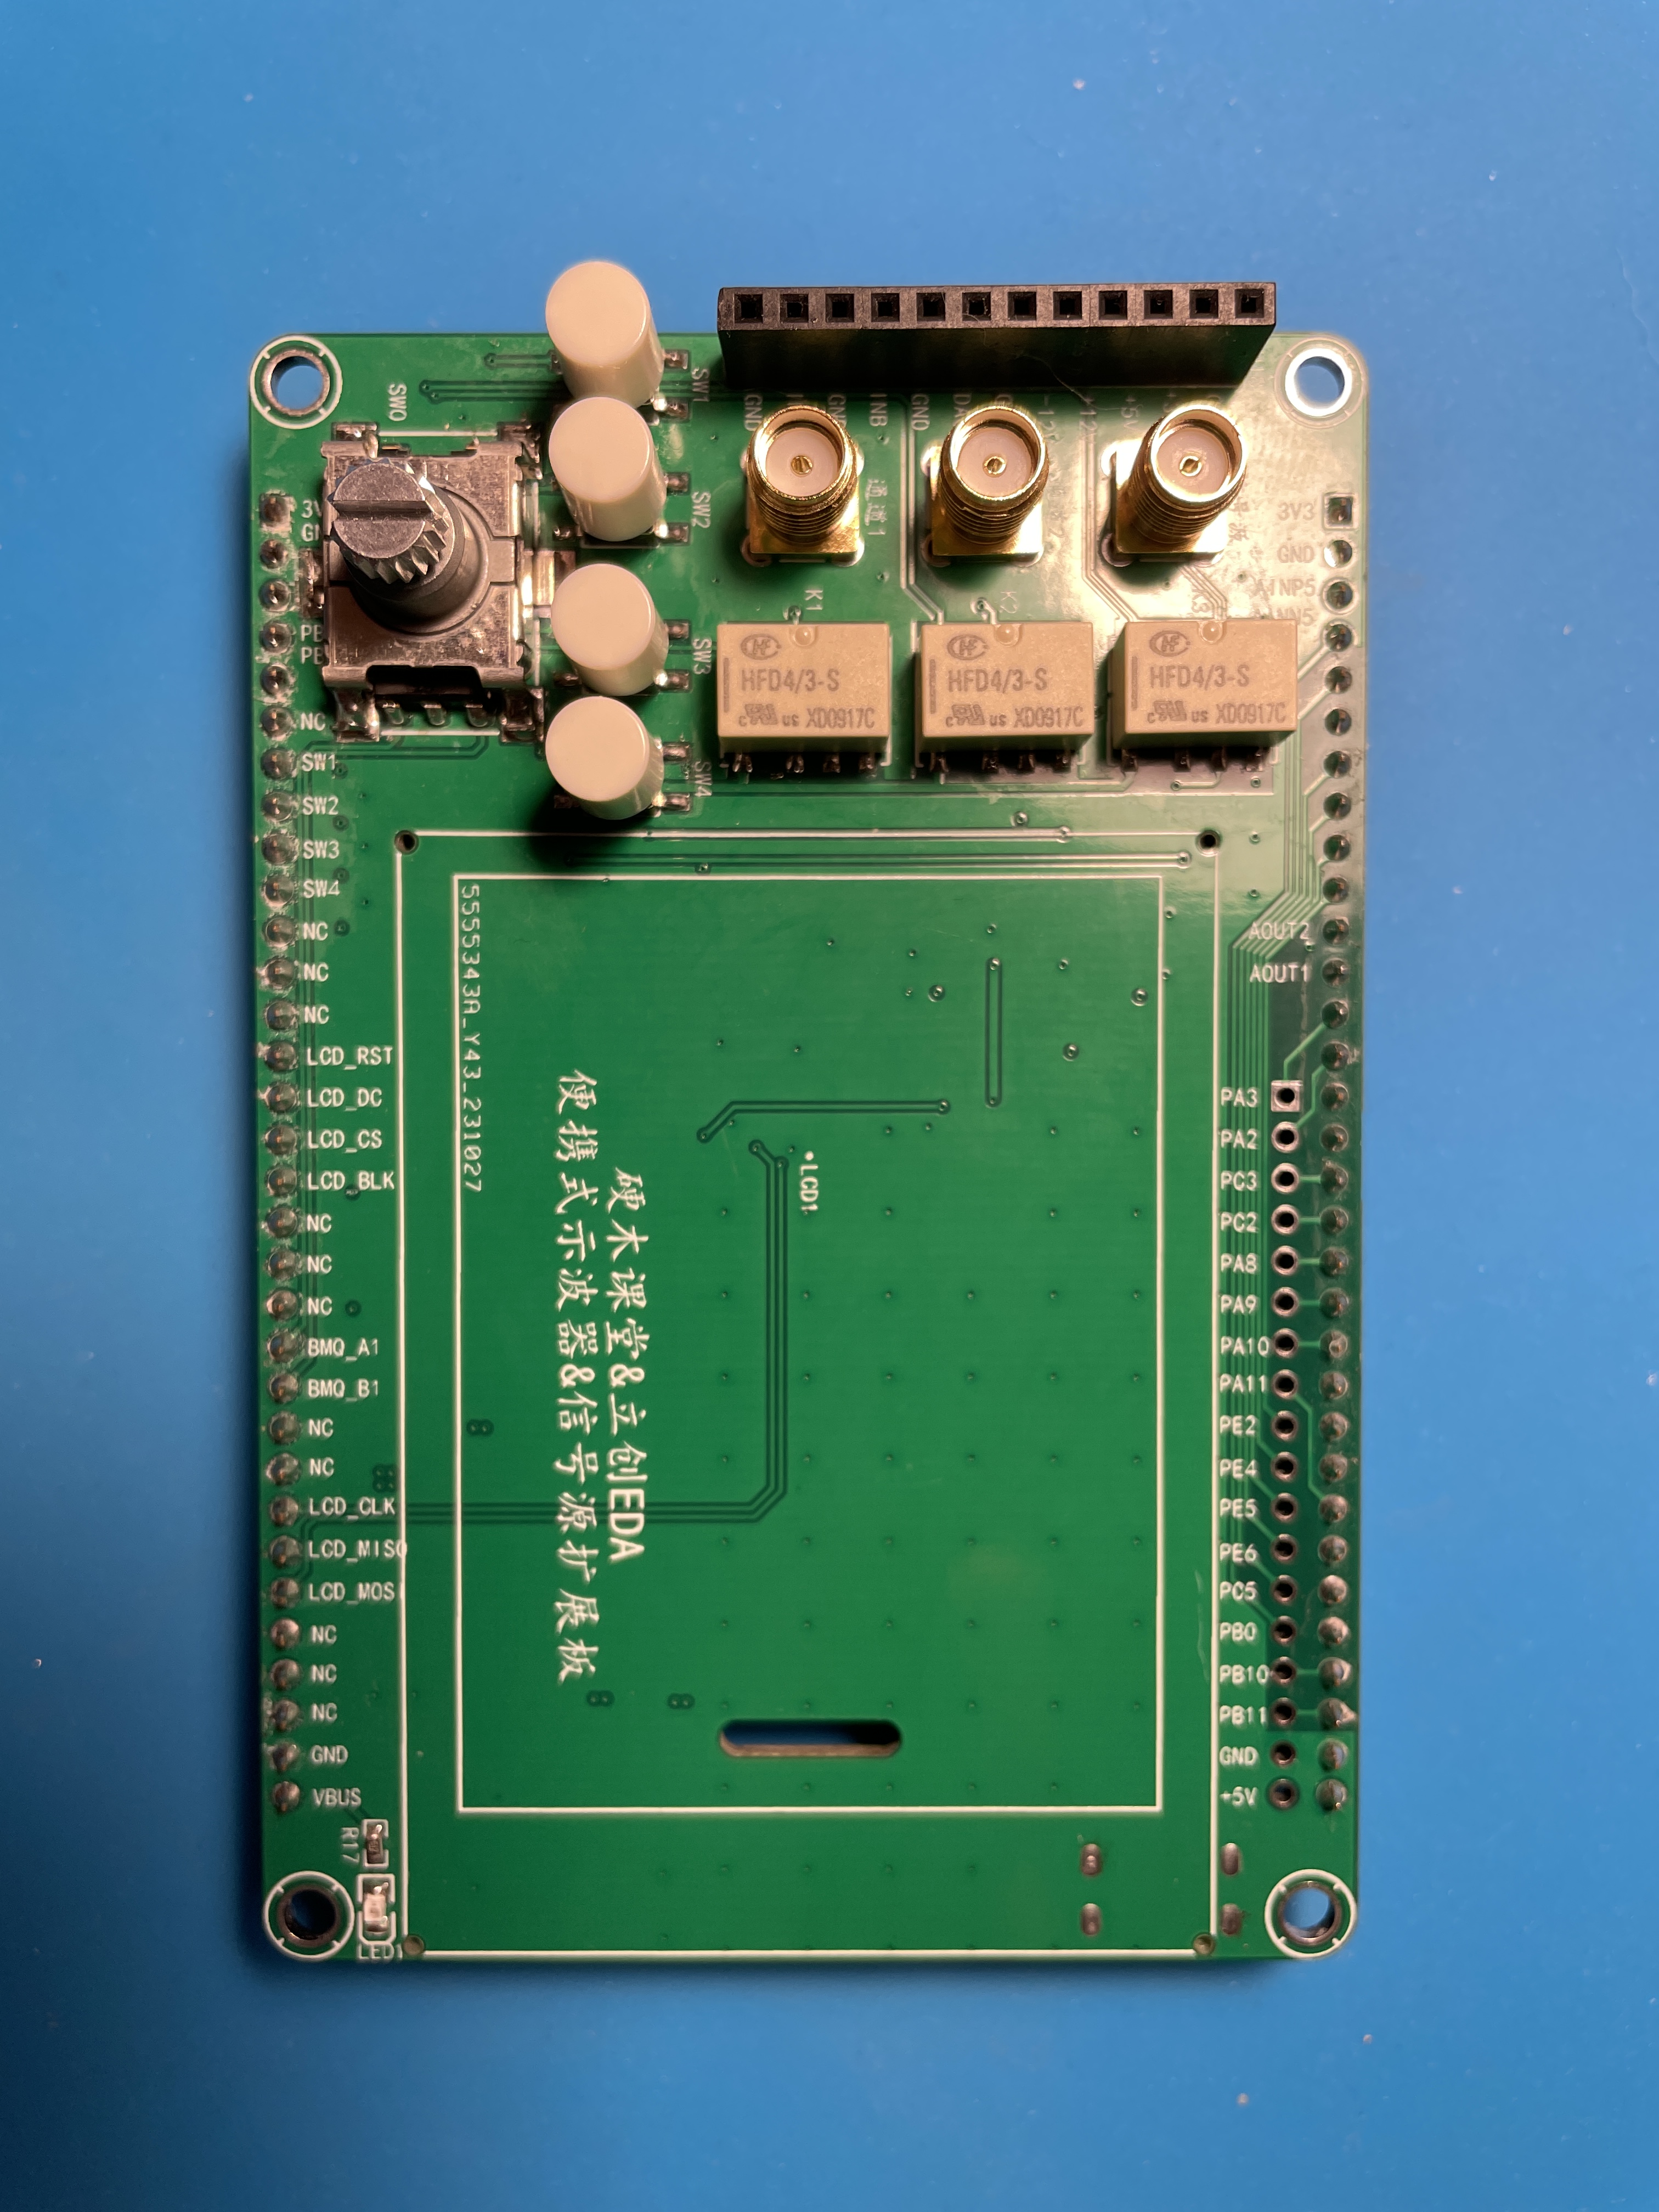
Pin connection positions of the core board and expansion board; the oscilloscope expansion board can be directly plugged into the core board.
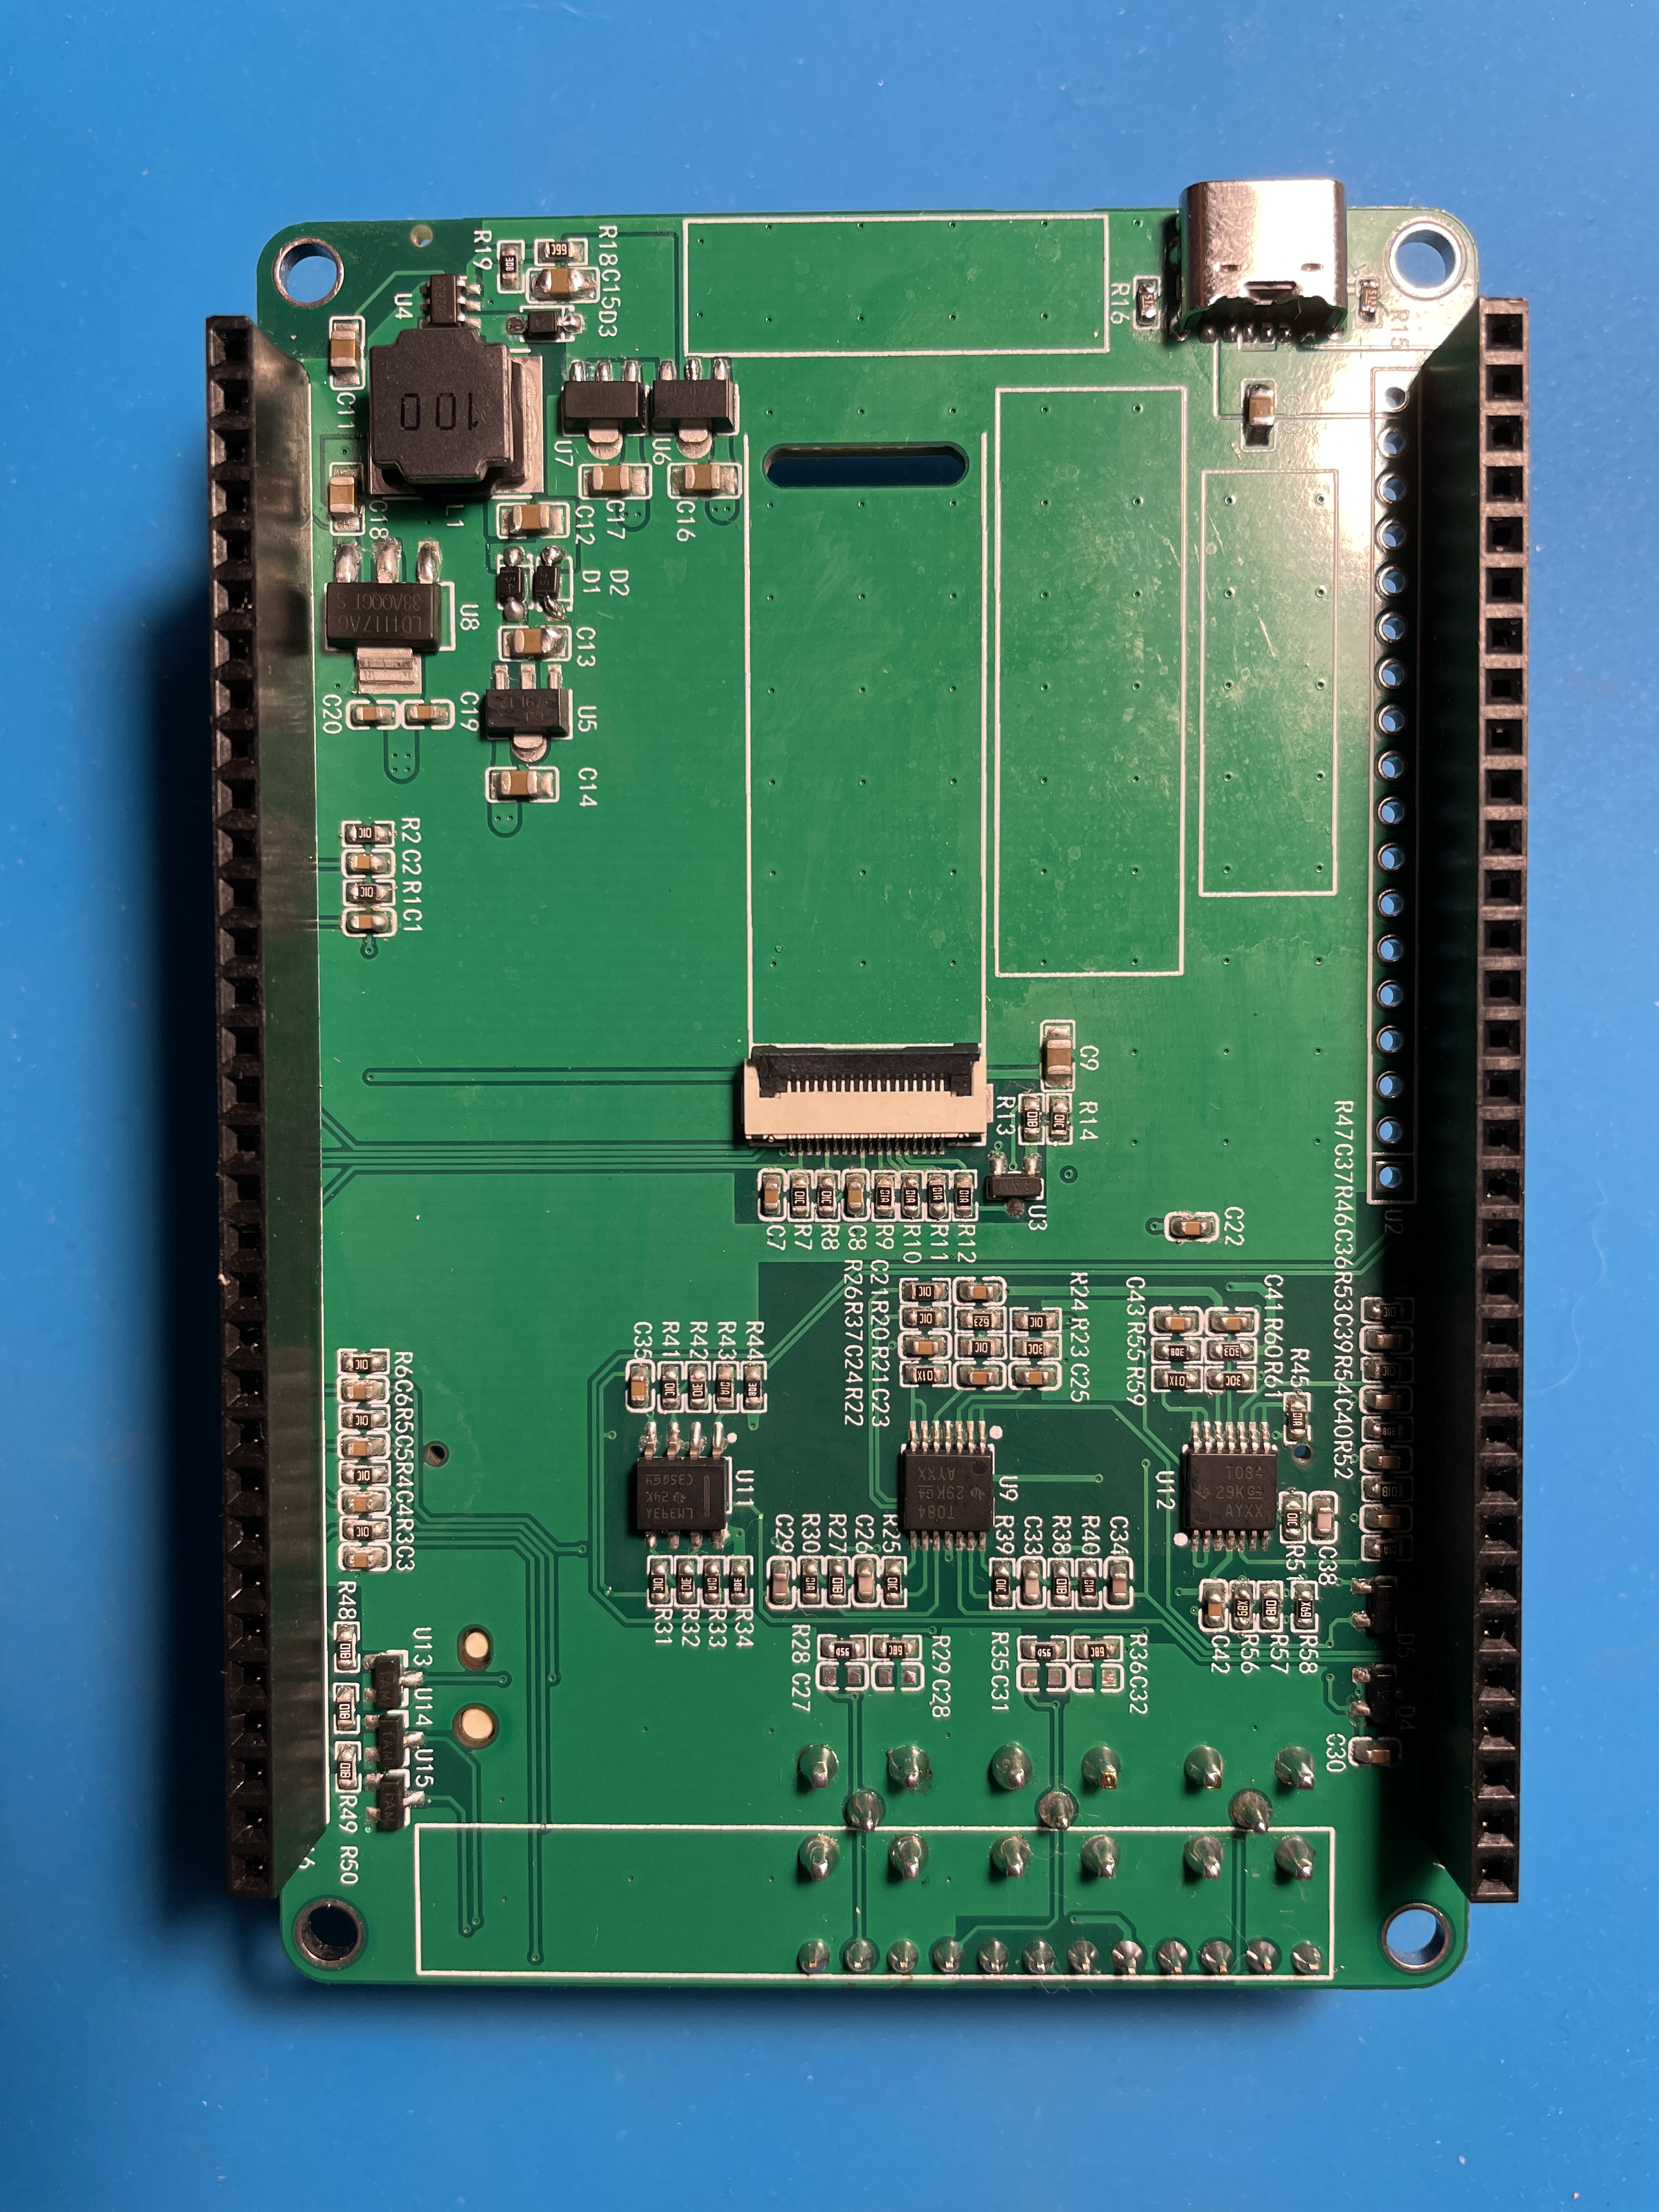
Power Supply Section Introduction:

The expansion board can be powered via the onboard Type-C port or from the core board; both methods are functional. The oscilloscope requires different voltages, and the LD1117-3.3 linear regulator converts the 5V to 3.3V to power the signal relays. The 5V power supply is also converted to -12V, +5V, and +12V via the MT3608 power chip and LCD components to power the oscilloscope's operational amplifiers.

When powering the oscilloscope, it is crucial to ensure that the corresponding resistors are correctly connected; otherwise, it may cause significant waveform display deviations.
When the VREF of the STM32H750 is powered by 3.3V, the input range of the STM32's ADC is 0-3.3V. However, our maximum input signal is ±15V. Therefore, we need to solve the problem of large signal input not being saturated.
Solving the equation:
15*a+b = 3.3
-15*a+b = 0
, we get a=0.11 and b=1.65.
This means we need to attenuate the input signal to at least 0.11 times (approximately 1/9) and add 1.65V DC to meet the full-scale input of the ADC. Therefore, we use the following operational amplifier circuit. The resistor network achieves 1/20 attenuation, and the operational amplifier performs a 2x amplification and a 1.65V voltage shift, thus achieving 0.1INB + 1.65V.
We can use the superposition theorem to analyze this circuit. First, when analyzing the contribution of the input signal INB to the output Vo, we ground the other voltage source in the circuit, -1.65V. This way, the input signal is divided to 1/20 after passing through R14 and R18, and then amplified by a factor of 2 by the non-inverting amplifier circuit. The overall gain of the input signal is 1/10. When analyzing the contribution of -1.65V to the output, we ground the input signal AIN, and the amplification factor of -1.65V is -1. Therefore, we obtain the output Vo = -1.65V * (-1) + AIN/10 = 1.65V + AIN/10.
The -1.65V input above is obtained from -12V through a resistor divider and buffer. This circuit solves the problem of matching the ±15V input to the ADC's 0-3.3V input range. We also need to consider the issue of accurate sampling even with small input signals. For example, when a 10mV signal is input, it will attenuate to 1mV after passing through the circuit above. To maximize the signal-to-noise ratio of the input signal, we add a switching mode to the analog front-end. When sampling small signals, a switch is used to select the direct path from INB to the non-inverting input of the op-amp, instead of selecting the attenuated signal from INB. This ensures that the signal entering the ADC is as large as possible. Combined with a 16-bit ADC, this ensures accurate and reliable sampling results.
Oscilloscope Channel Introduction:

The oscilloscope has dual input channels. The input signal is conditioned via a signal relay. Note that the 24pF and 220pF filter capacitors at the input should not be soldered; soldering will cause excessive peak-to-peak shift on the oscilloscope expansion board. A 1MΩ input impedance is achieved through a series resistor divider, providing two options for the input signal: one is direct input, and the other is attenuated to 1/20.
A signal switch (relay or manual switch) is added after the 1MΩ input voltage divider resistor to select whether the INB input is directly connected to the non-inverting input of the op-amp or after being attenuated to 1/20. Both methods maintain a 1MΩ input impedance for the INB. When acquiring small signals, the switch can be toggled to use the direct input for more accurate measurement results.
It can be calculated that when the direct input is selected, Vo = 2AIN + 1.65, and when the attenuated input is selected, Vo = AIN/10 + 1.65.
The direct signal or the signal attenuated to 1/20 enters the first-stage non-inverting amplifier. The non-inverting amplifier performs two functions: first, it amplifies the non-inverting input signal by a factor of two; second, it shifts the amplified signal by 1.65V, calculated as Vo = 1.65 + 2*Vi. Therefore, the overall gain of the corresponding circuit is either 2 times or 1/10 times. Finally, the analog signal, after being amplified and shifted by the non-inverting amplifier, is connected to the STM32H750 development board and enters the H750's ADC. TrigerA, TrigerB, AnalogA, AnalogB, and the DC reference level (generated by one of the H750's DACs) are compared by a comparator to generate a square wave signal, which then enters the STM32H750's timer for frequency measurement.
The comparator section describes
how, to implement triggering and frequency metering functions, two comparator channels were designed on the board. These channels convert the waveforms of the two analog input channels before they enter the ADC into square wave signals for use as timer inputs in the H750. The reason for using the waveforms before entering the ADC is that the waveforms entering the ADC, after conditioning by the front-end analog circuitry, fall within the known 0-3.3V range, making the comparator's comparison threshold design easier.
The H750 uses its internal DAC2 to output a 0-3.3V DC signal to compare with the waveform from channel 2 before entering the ADC, converting the channel 2 waveform into a square wave. This allows the H750's timer function to use the square wave signal for interrupt handling and timer capture.
Oscilloscope signal source description:

DAC_OUT2: DC reference level, output through the STM32H750's internal DAC2. This includes signal conditioning implemented with resistor dividers and operational amplifiers, and a square wave output implemented with a comparator (for triggering and frequency measurement). The STM32H750's DAC1 output waveform has a range of 0-3.3V. A second-order RC filter implements the function of a low-pass filter. The signal source power supply section uses a resistor divider and buffer to convert the 5V input to a low-impedance 2V output, which is then amplified by -5 times for signal shifting. The output amplifier performs two functions: first, it amplifies the non-inverting input by 6 times; second, it shifts the amplified signal by 6 times to -10V before outputting it, calculated as Vo = -10 + 6 * Vi. A voltage divider network is used to achieve better results when outputting small signals using analog voltage division.
When the STM32H750's VREF is powered by 3.3V, the internal DAC's output range is 0-3.3V. To achieve the ±10V output required in the problem, we need to solve the equations:
0 * a + b = -10V
3.3 * a + b = 10V
. Solving these equations, we get a = 6.06 and b = -10, which
allows us to design the circuit shown in the diagram above.
In the diagram above, the 0-3.3V signal output from the STM32H750's internal DAC is filtered by a low-pass filter and then input to the non-inverting input of the TL082, forming a non-inverting amplifier with a gain of 6. The amplified waveform is 0-19.8V. Then, utilizing the -5x amplification capability of the TL082's inverting amplifier section, the +2V obtained from the 5V voltage divider is amplified by -5x to obtain -10V. This -10V is then superimposed on the 0-19.8V signal output from the non-inverting amplifier to obtain an output of approximately ±10V. The calculation formula is: Vout = 6*Vin -10.
Similar to an ADC, to ensure the signal source output covers ±10mV to ±10V, while simultaneously balancing a large signal range and small signal accuracy, the DAC's resolution becomes a crucial factor. The H750's DAC is 12-bit, and its full-scale output (using all 4096 code values) is ±10V. When outputting small signals by reducing the DAC code value, to achieve a 7-bit voltage resolution (128 vertical points), the waveform must be attenuated by 128/4096 = 1/32. This translates to an output voltage range of ±10V/32 = ±0.3215V. For signals smaller than ±0.3125V, further reducing the code value results in insufficient DAC resolution and noticeable waveform steps. Therefore, we use analog voltage division. When outputting signals smaller than ±0.3125V, we use a switching resistor divider to attenuate the waveform by 1/20, ensuring sufficient voltage resolution for small signals. Simultaneously, the combination of R57 and R62 ensures a 50Ω output resistance at 1/20 attenuation, and R5 ensures a 50Ω output resistance at the x1 range.
Signal Relay Section Introduction:
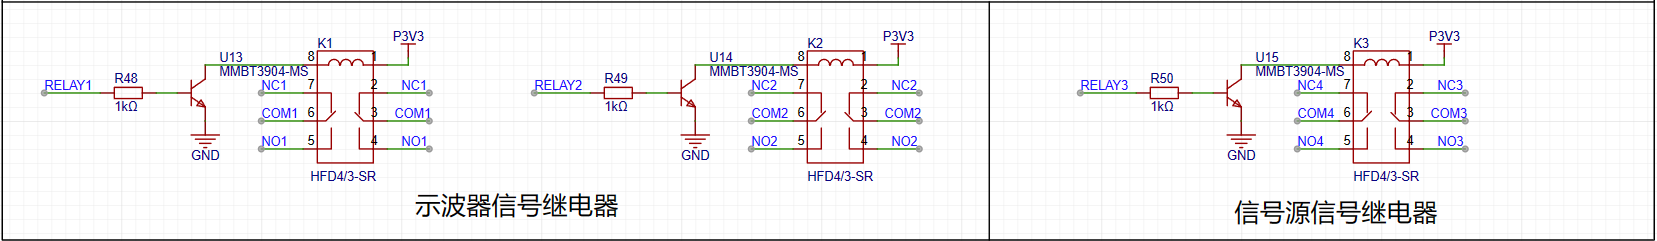
The oscilloscope's input and output channels use signal relays to switch between different ranges.
Display Screen Section Introduction:

A 2.8-inch TFT LCD screen with a resolution of 240*320 is used. The driver is ST7789V, and the interface is SPI with an 18-pin serial port connector. (A link to a 2.8-inch TFT LCD screen with 240*320 resolution, ST7789V driver, and SPI serial port
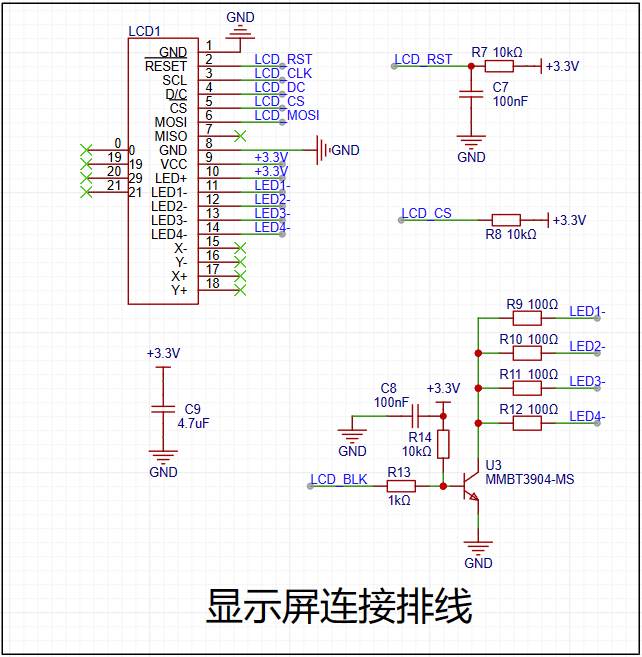
connector with 18-pin connector is available on Taobao.com. )
Expansion Board Interface Introduction:

Some pins on the expansion board are brought out for measurement purposes.
Button Section Introduction:
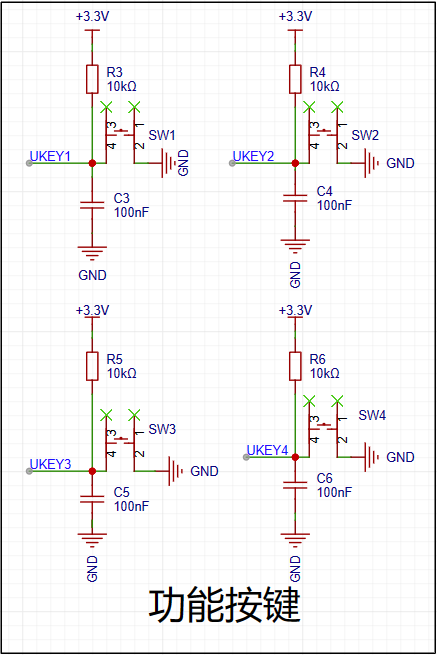
Four function buttons are used to operate and control the oscilloscope interface: SW1 is for left cursor movement, SW2 is for right cursor movement, SW3 is for switching between channel 1 and 2, and SW4 is for the DAC switch.
Rotary Encoder Introduction:
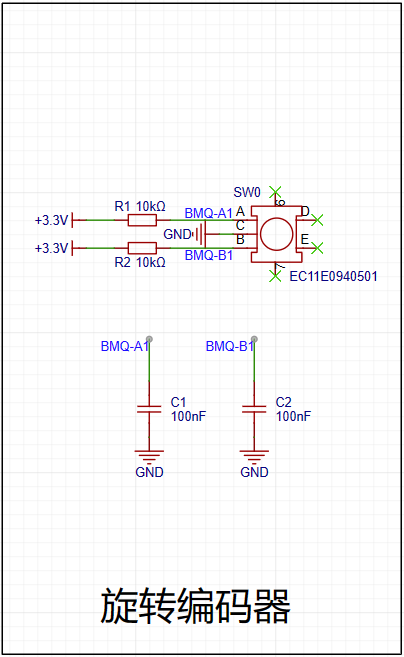
A surface-mount EC11 encoder is used, which is convenient for wiring. This encoder also avoids the bug of jumping twice after one rotation, which is excellent.
PCB Layout and Routing Introduction:

When placing components, it's important to keep the power supply and operational amplifier sections slightly separate to prevent power interference. The PCB uses a 4-layer layout, with the inner layers serving as internal power layers, using lines to separate the power traces.
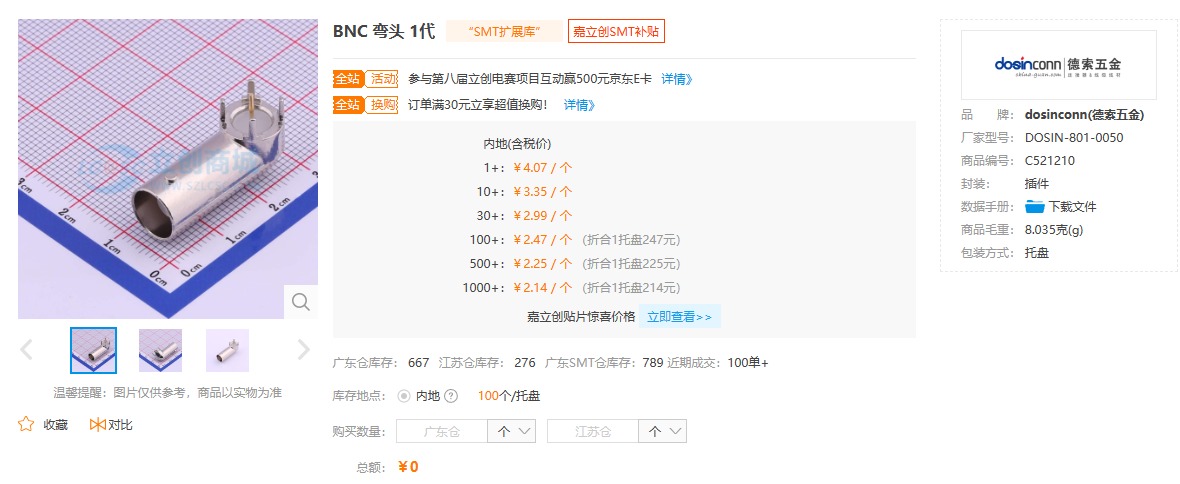
For future board optimization, the SMA connector can be directly replaced with a BNC connector, eliminating the need for adapters when using oscilloscope probes. We recommend replacing it with the BNC connector shown in the image below, as it's compact and doesn't take up much space.
PCB 2D Layout: PCB

3D Layout:


PCB 3D Housing: The

3D housing was easily and conveniently drawn using LCSC EDA. The housing frame is higher than the expansion board, allowing the expansion board to be embedded within it, ensuring a clean aesthetic when the front panel is on.
Expansion Board Front Panel:

The front panel uses a simple and elegant white as the base color, adorned with LCSC, the initiator of this training camp, as well as the sponsors and technical advisors of this training camp, Hardwood Classroom.
Corresponding buttons and knobs are clearly labeled for ease of use. The addition of the LCSC mascot also helps prevent board burnout during daily testing.
Physical PCB Demonstration:
When soldering, pay attention to the pin-dense op-amp chips and ribbon cable sockets to avoid solder bridging or cold solder joints.
After soldering, check for short circuits in the power supply. If normal, you can try plugging the expansion board into the H750, powering it on, and connecting it to a computer for programming.
Note that the H750 has two USB ports; the CMSIS-DAP port must be used for programming. When properly connected to the computer, the LED on the DAP port will flash regularly. If it doesn't flash, try a different USB port on the computer. Current information suggests that using the built-in USB ports on the motherboard is best; using USB hubs or USB ports on the front panel of the case may result in the computer not recognizing the device.
Programming Link Introduction:
When connecting to the computer and opening the programming file "5_DAC_1" to run Keil, you will be prompted to install the STM32 runtime library. Follow the prompts to install it. As shown in the image below,

after installation, you need to add the flash programming algorithm; otherwise, a flash error message will appear. As shown in the image below,

if this error message appears, you need to set the flash programming algorithm
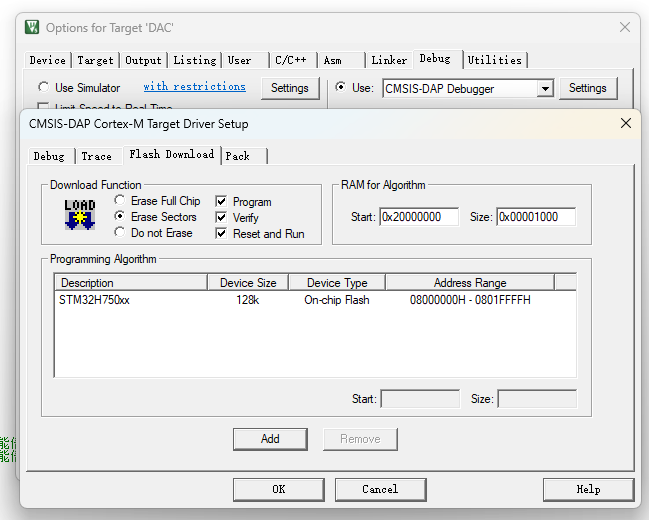
. As shown in the image above, you can compile and program the file normally.
Software Code Introduction:
The code directly uses Li Gong's process, only optimizing and modifying the buttons and encoder. Modify
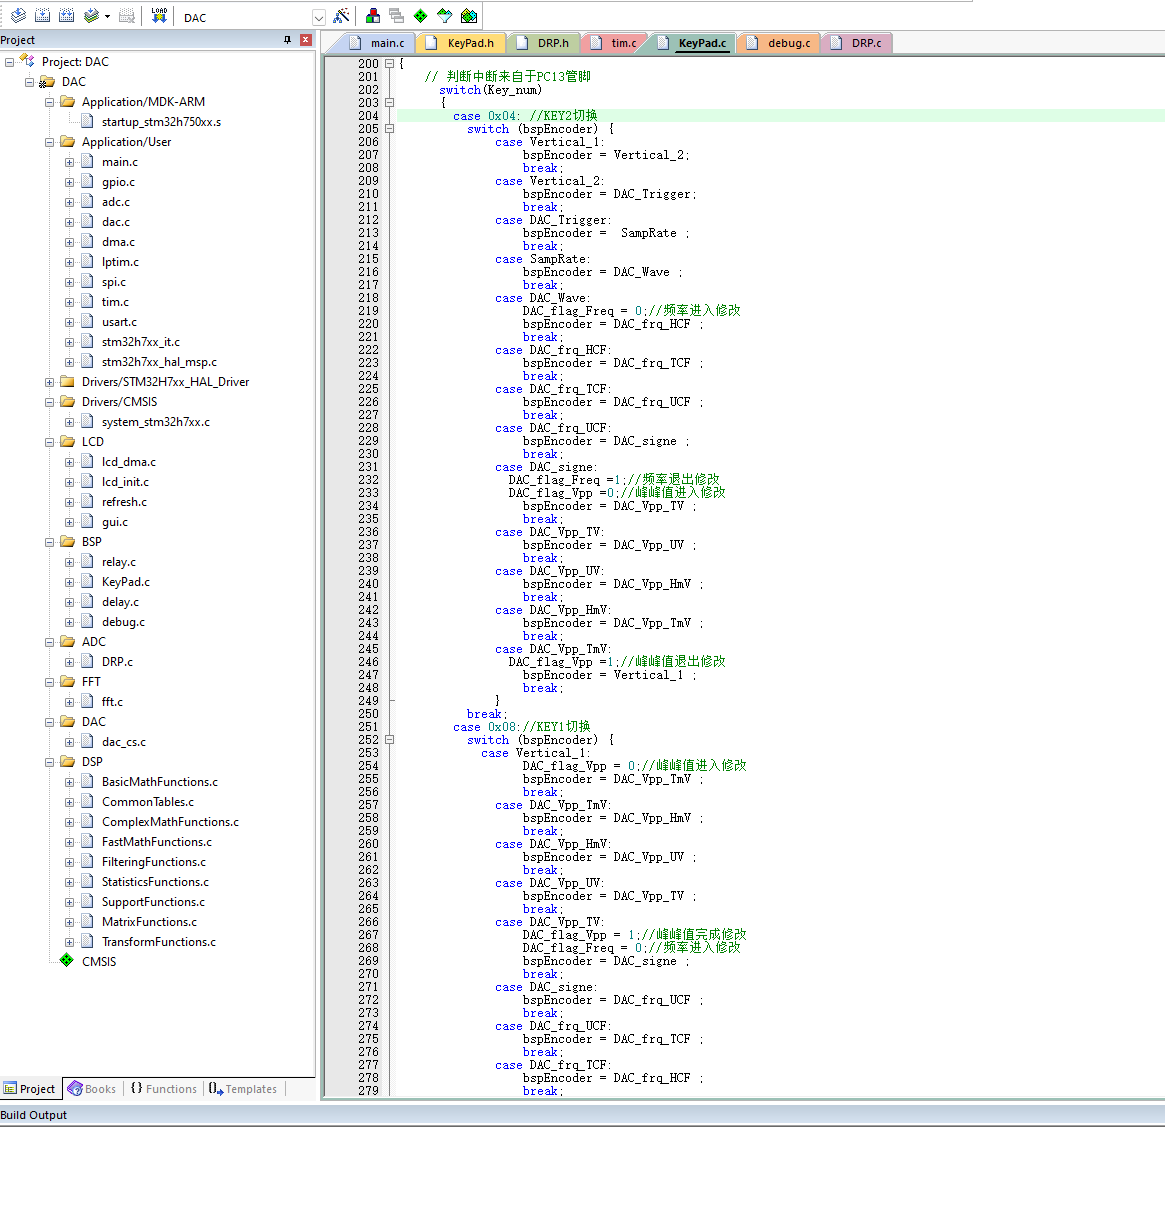
the cursor movement direction of buttons 1 and 2. By default, button 1 controls the cursor to move to the right, and button 2 controls the cursor to move to the left. By swapping their scanning positions in the code, you can achieve a more convenient setting where button 1 moves to the left and button 2 moves to the right.

The encoder's rotation direction is by default: left rotation increases the value, and right rotation decreases the value. This is not very consistent with conventional rotation habits. You can change the marker position in the code to fall edge trigger, which will make the encoder decrease when left rotation and increase when right rotation.
Housing Installation Introduction:

The overall installation used two types of screws and two types of spacers, as shown in the picture above. The screws were ones I already had, while the spacers were purchased from LCSC Mall, with product numbers C5452279 and C5452233 respectively.
PCB Placement in the 3D Housing:

The size is suitable. However, due to the large area of the bottom surface, reinforcing ribs should be added internally when designing the bottom housing to strengthen it. Although this works fine, I will modify the housing in the project later to add the reinforcing ribs.
Panel Cover Display:

The overall size is relatively compact. The reason for this is that I wanted to retain the core board's pins for future use. If the pins on the back of the core board were cut off, the thickness could be reduced by about 1cm.
Purchase links for encoder knob caps: Aluminum knob encoder sound card potentiometer inner hole 6mm knob precision machined high-quality volume amplifier adjustment metal cap - Taobao (taobao.com)
Purchase links for button caps: A06-01 button caps with 4.5*4.5 round head tactile switch button cap inner diameter 2.3, size 6*7H (20 pieces) - Taobao (taobao.com)
To better fit the display screen under the panel, it needs to be raised. I used 3M foam adhesive, 1mm thick, stacked in three layers to ensure the screen fits snugly under the panel.

Oscilloscope interface introduction:

Finally, a simple oscilloscope testing video is attached.


 京公网安备 11010802033920号

 XCS20XL-4TQ100I