USB hubs are among the most frequently used USB devices. When using a USB hub, have you ever been troubled by these issues:
The hub doesn't support Multi-TT, so the speed isn't high enough when using multiple full-speed devices simultaneously?
No extension cable between Type-A and Type-C, leaving you helplessly staring at the socket?
USB devices are too bulky, causing interference between adjacent devices?
Insufficient USB power supply, causing it to malfunction when using multiple high-power devices simultaneously?
A short circuit caused by an improperly soldered board, resulting in smoke and other issues?
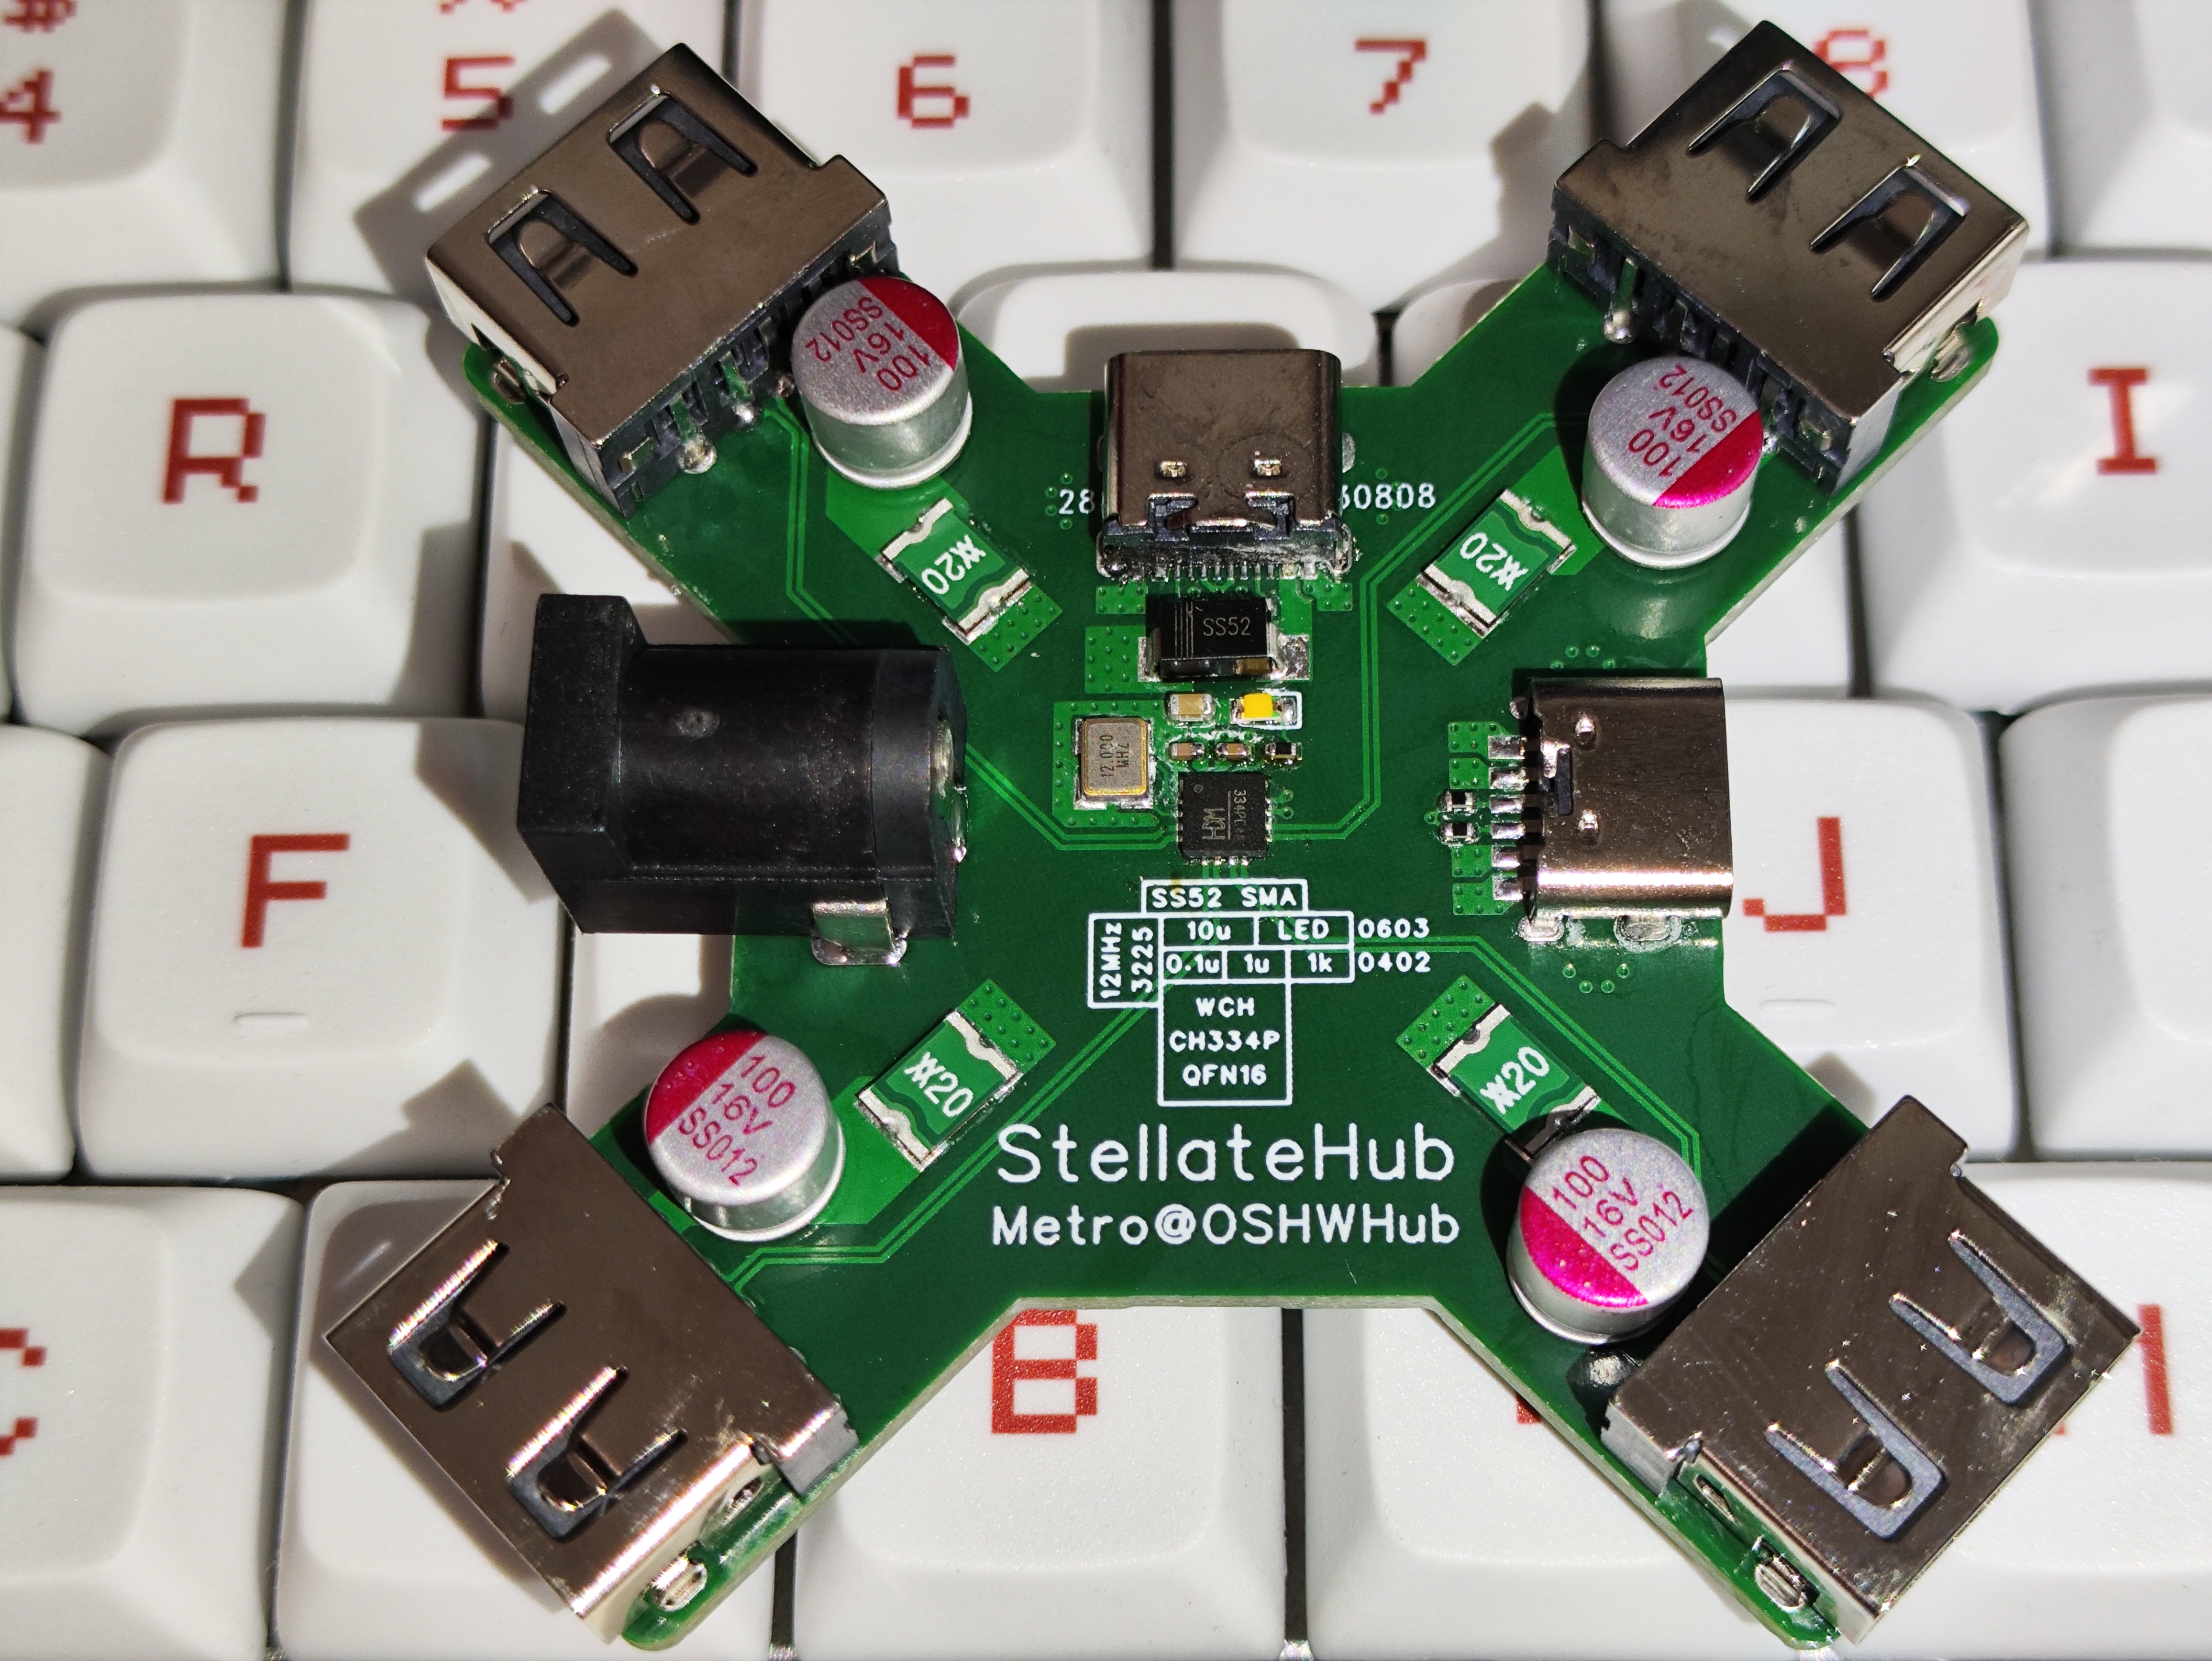
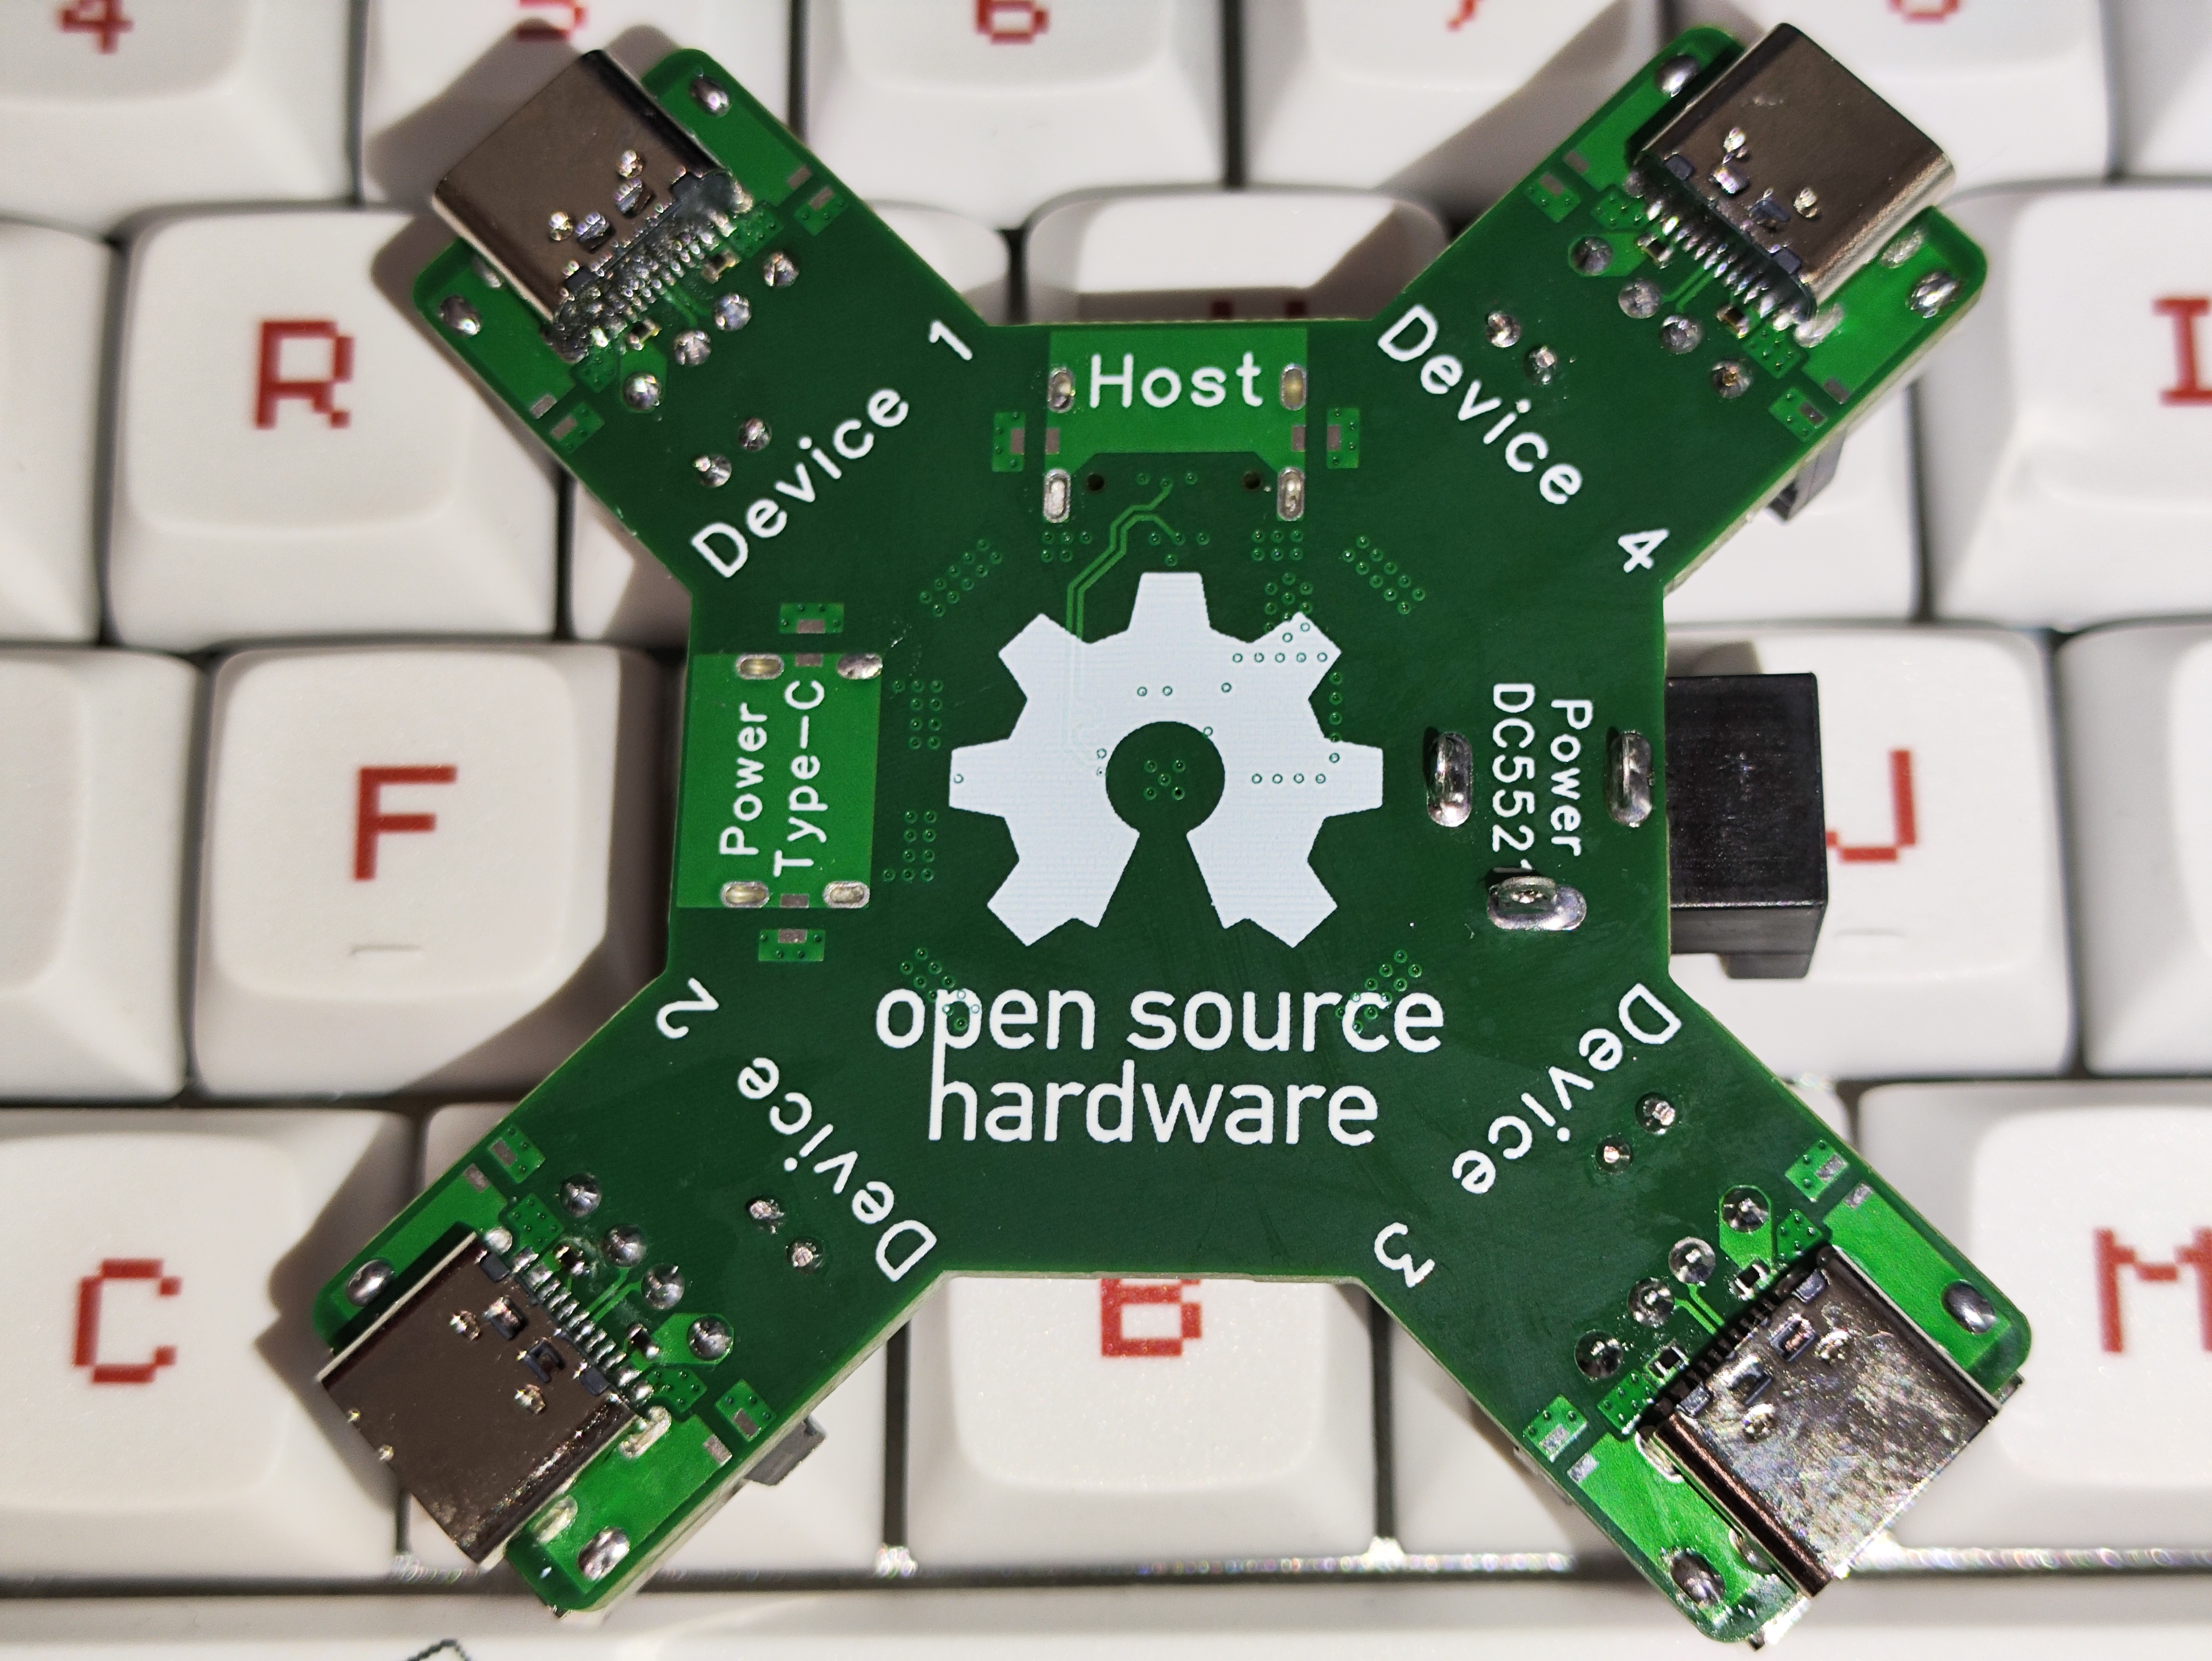
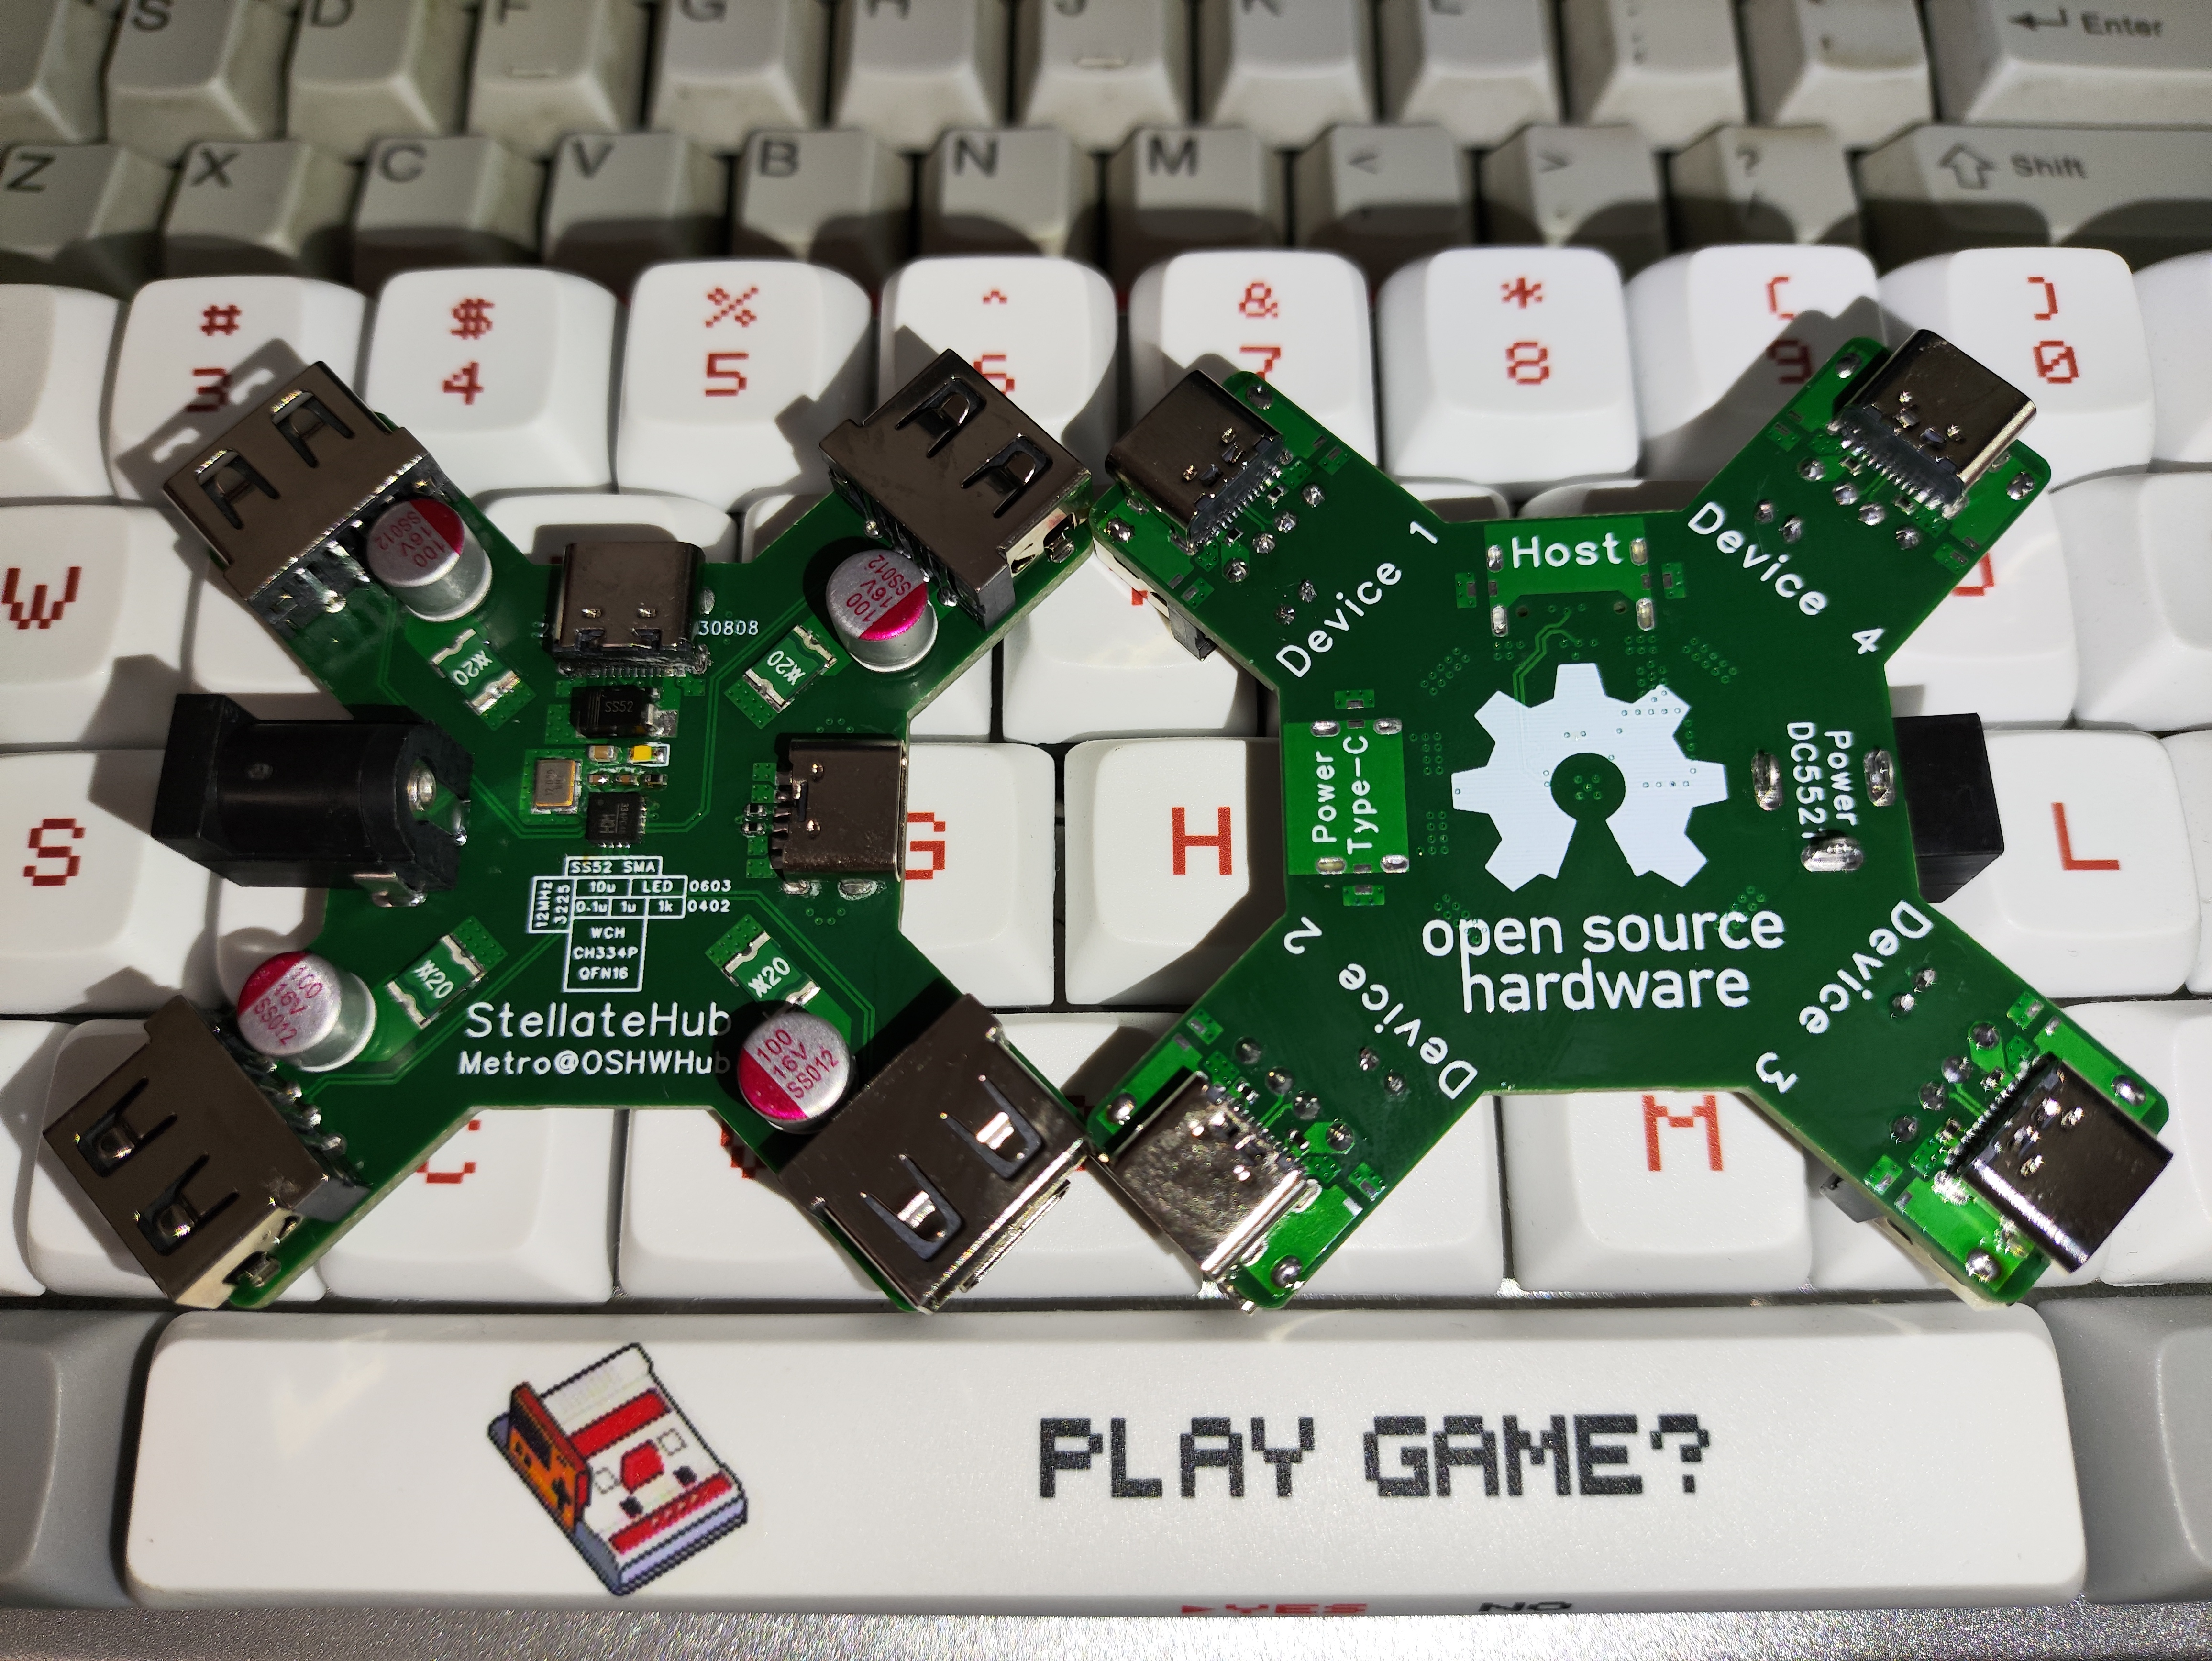
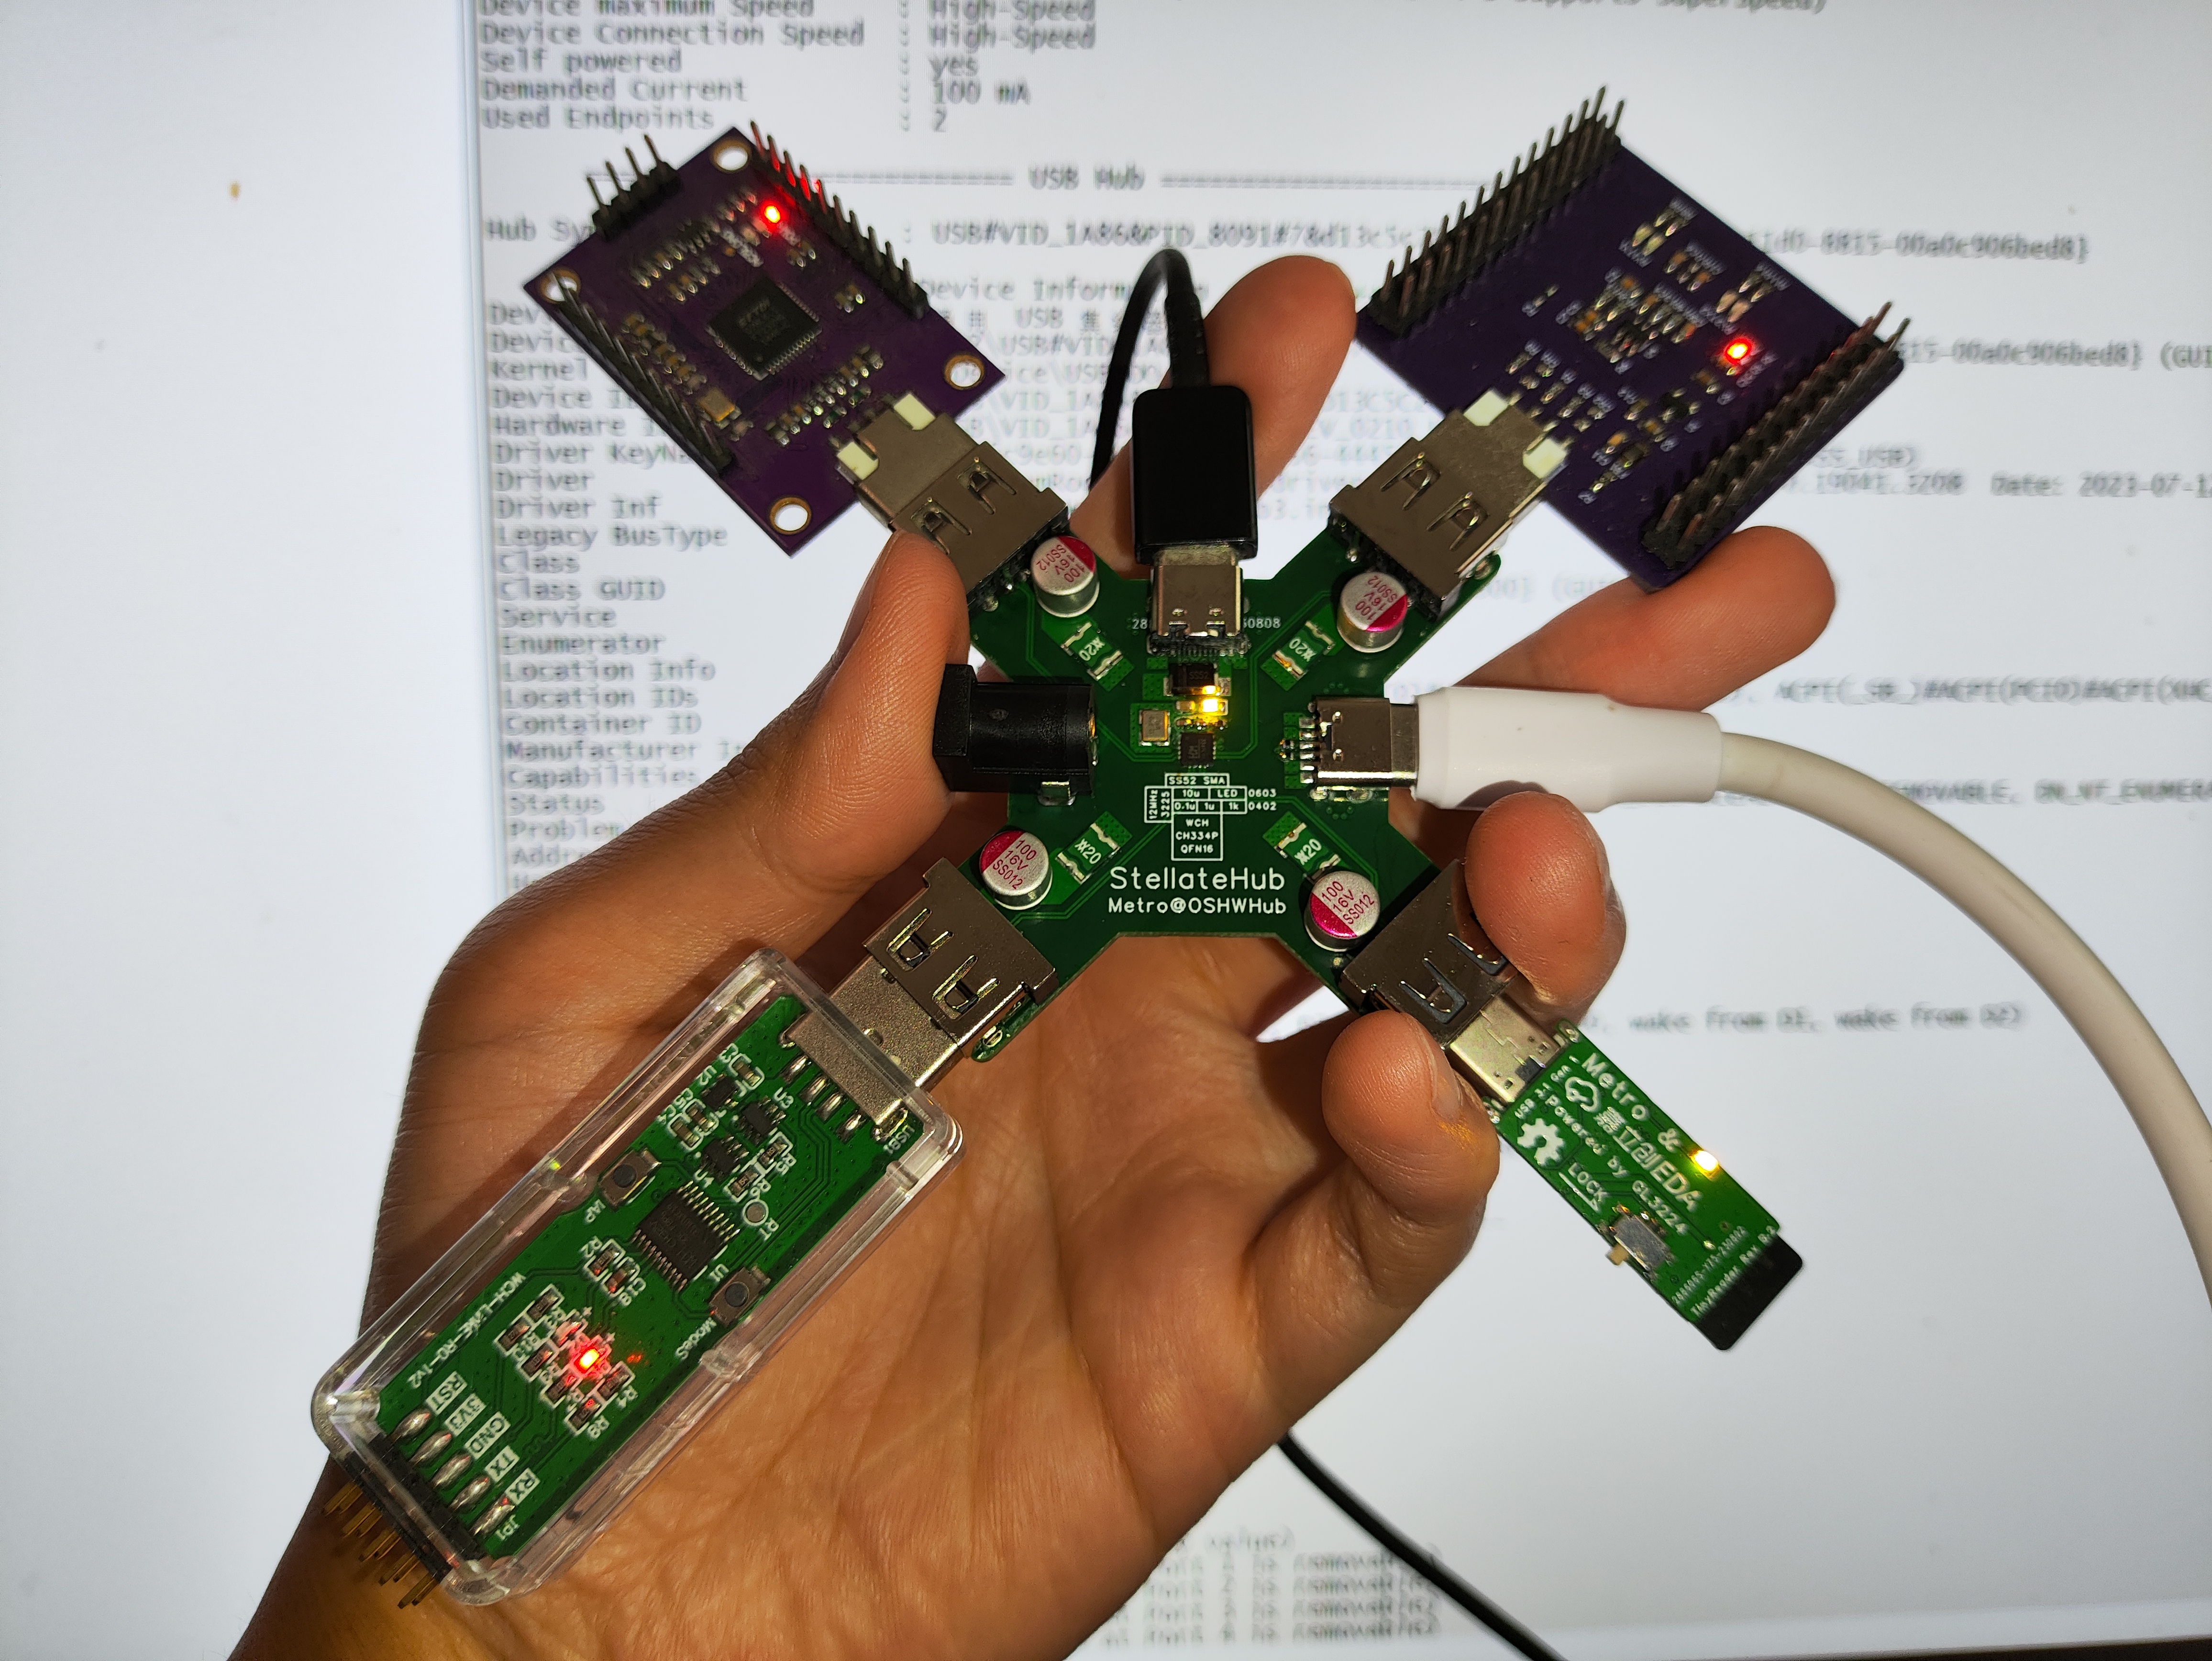
That's right, this USB hub was created to solve these problems! Its unique cross-shaped design allows for both power supply and communication, making it an excellent helper for debugging USB devices!
(By the way, the WCH CH334 is truly a great product; it even eliminates the need for a crystal oscillator matching capacitor, requiring only a minimum of 3 capacitors and 1 12MHz crystal oscillator to function. The QFN16 is also small and cute.)
The following precautions should be taken when using it:
When prototyping, please select a 4-layer 7628 board; there are no restrictions on board thickness, but a thicker board is recommended for increased strength.
Only one of the Type-A and Type-C ports in the same location can be selected. Theoretically, if one is purely for power supply, both can be connected, as long as the current is sufficient.
It is recommended to use aluminum electrolytic capacitors of 100uF or higher. Choose the fuse according to your needs.
The DC power input is 5V; the Type-C power input does not support tricking, and the theoretical maximum current is 3A.
Do not use it as a mini quadcopter; it will not fly, even if you connect propellers to all four sides.
The following is the usual beautiful picture section:


PDF_StellateHub, a USB 2.0 Hub based on the CH334P.zip
Altium_StellateHub, a USB 2.0 Hub based on CH334P.zip
PADS_StellateHub, a USB 2.0 Hub based on CH334P.zip
BOM_StellateHub, a USB 2.0 Hub based on CH334P.xlsx
91086
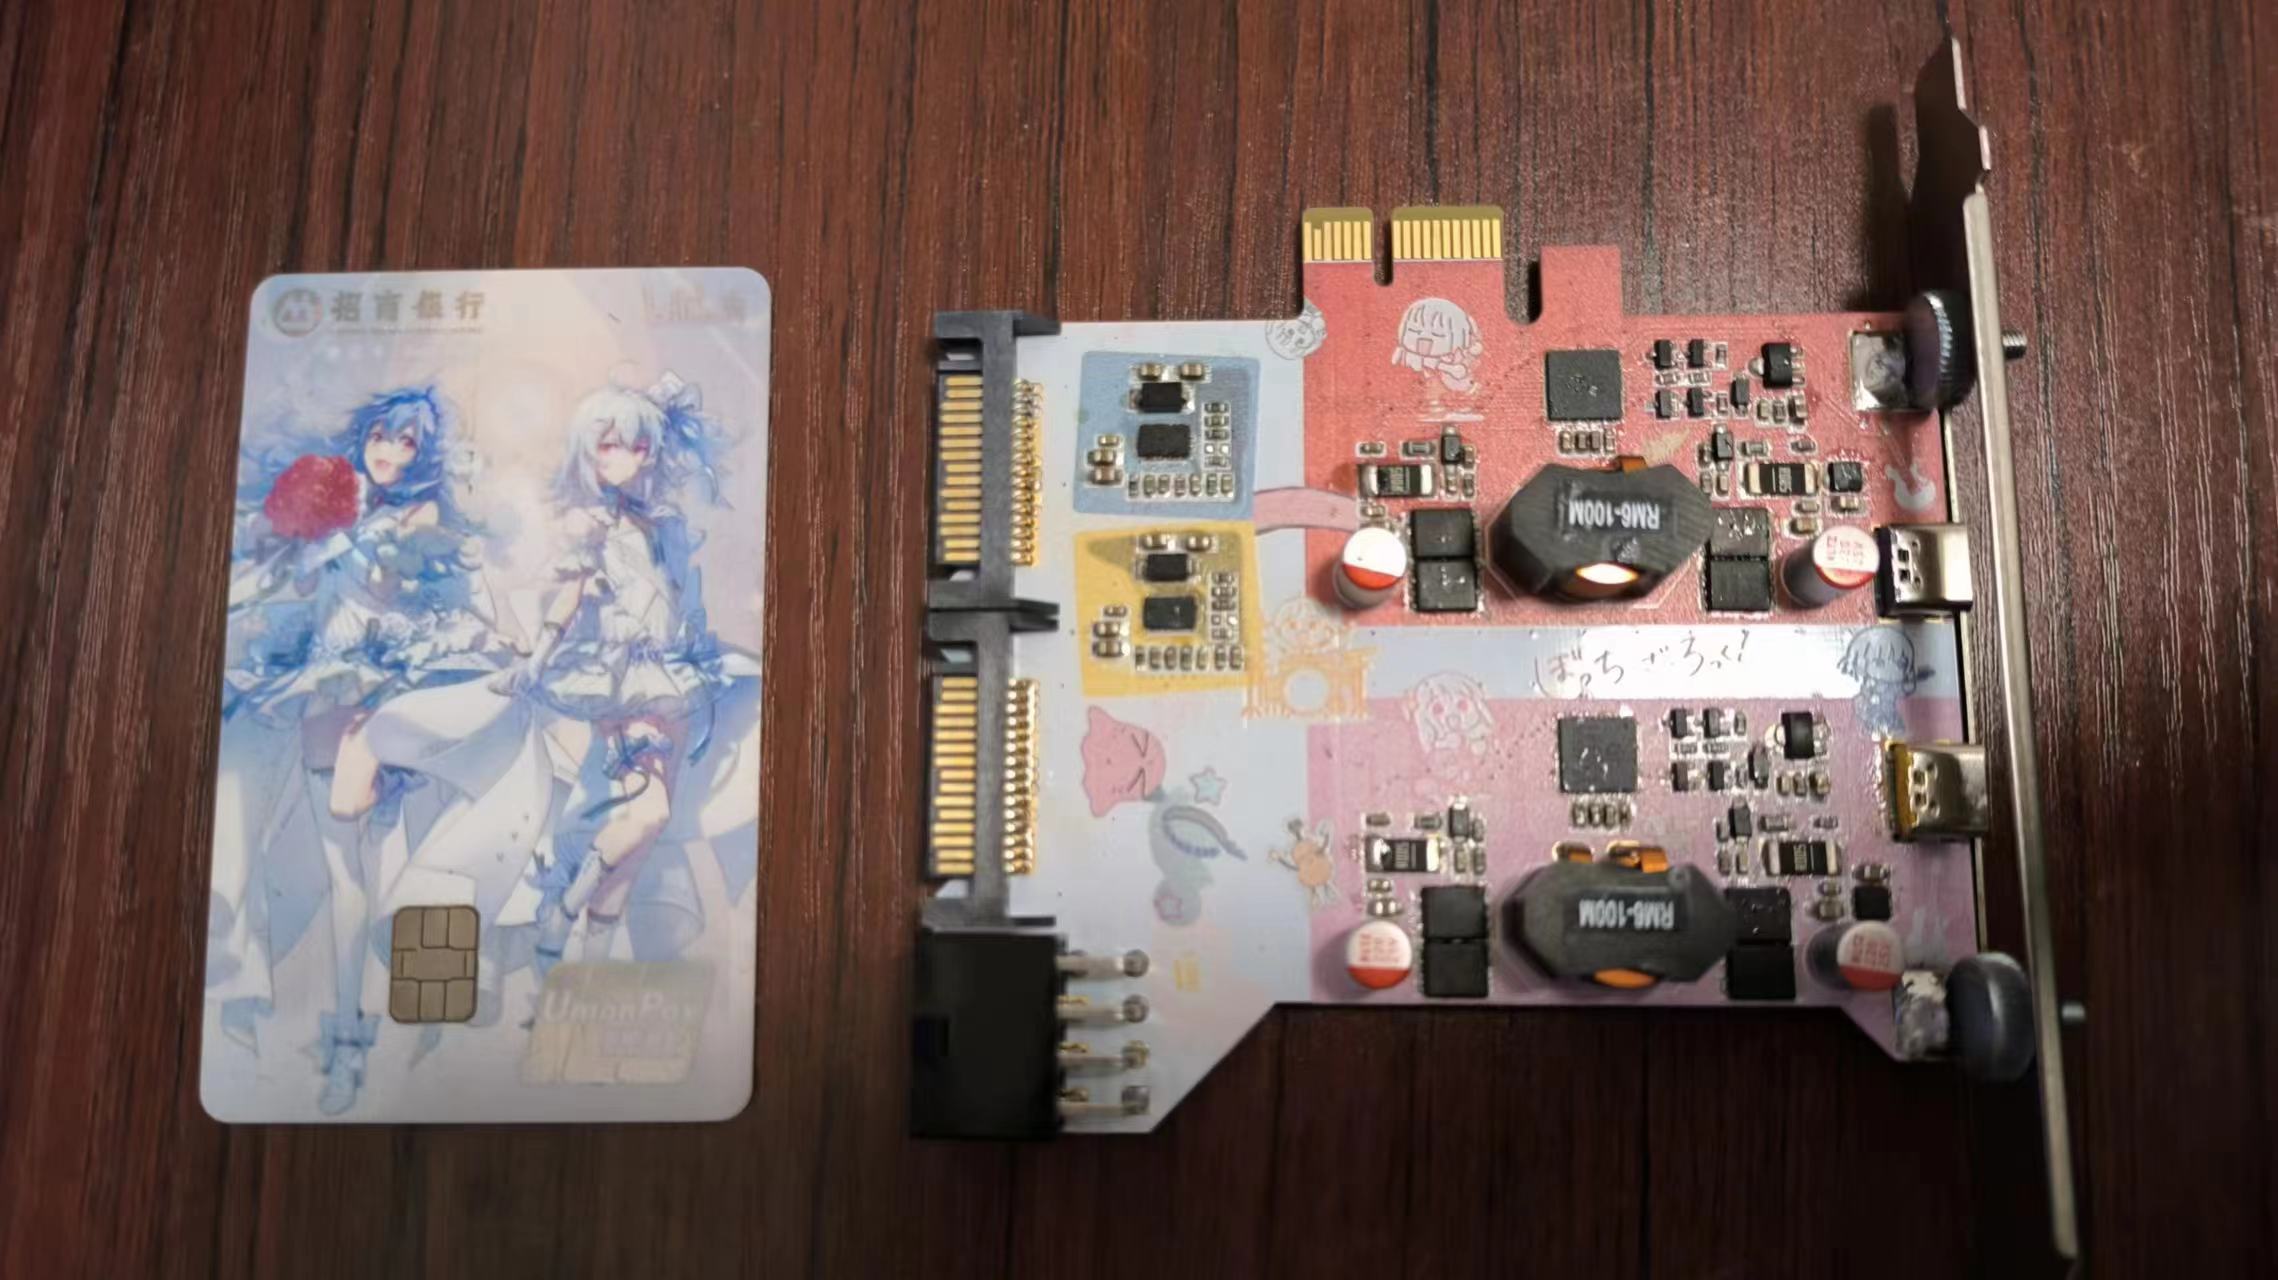
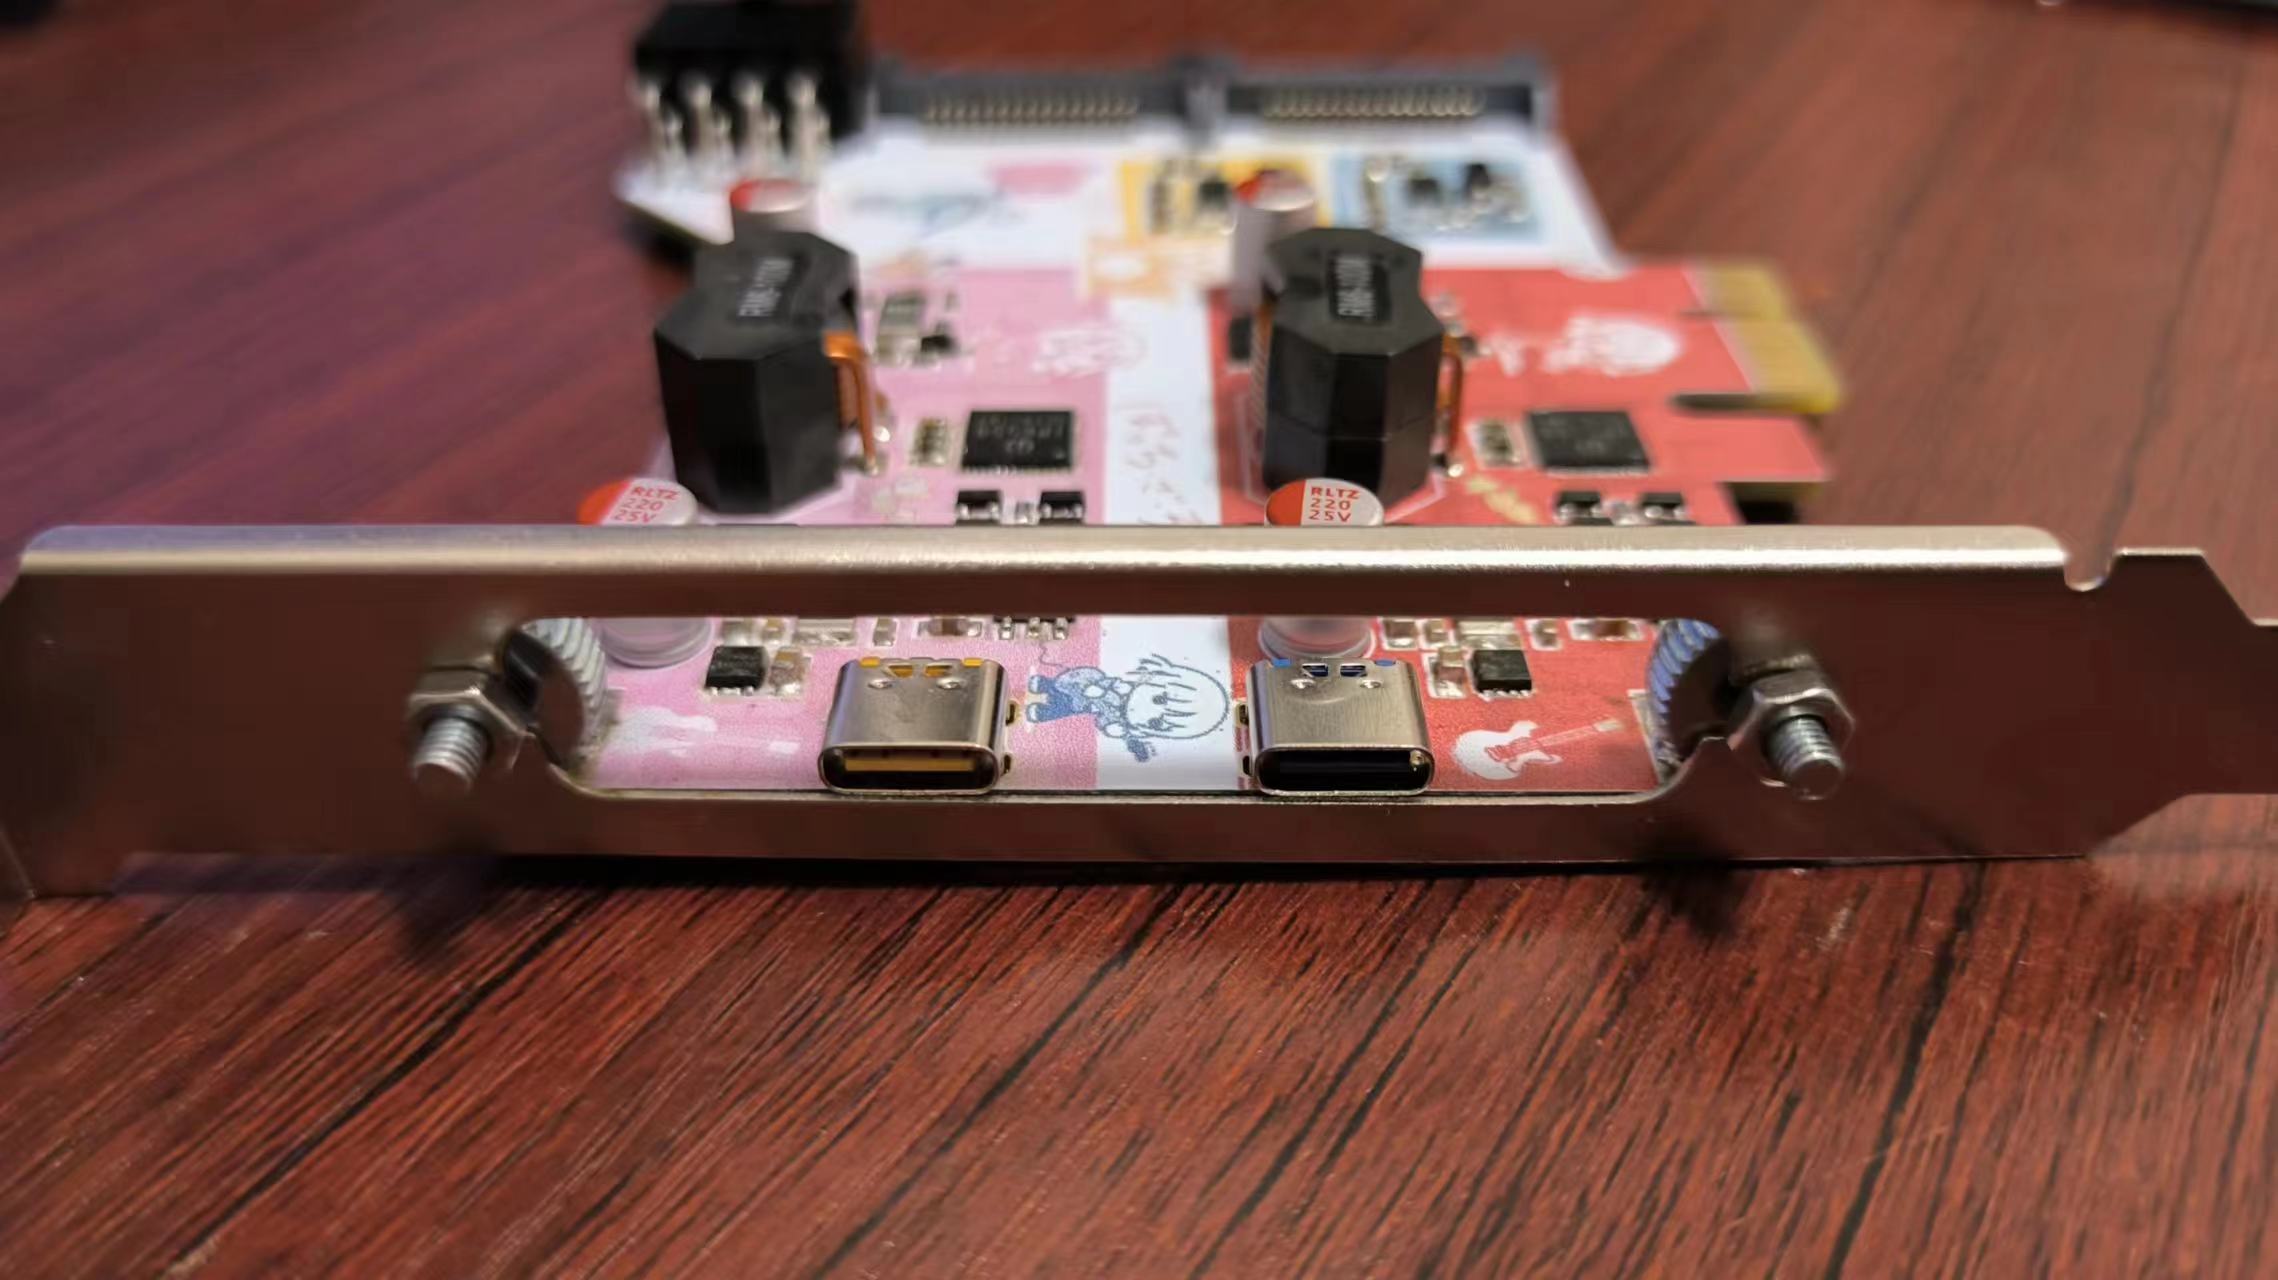
200W Dual-C Power Supply - PCIe Slot [Lonely Rock Color Silkscreen Print]
It uses the Ingenic IP6559_AC car charger chip, installed in a PCIe slot. Each channel supports a maximum PD100W output, powered by an 8-pin connector (5557R) from a computer graphics card and a 15-pin SATA connector, with a maximum conversion efficiency of approximately 97%. [Lonely Rock Color Silkscreen Print]
Preface:
Currently, most chargers with PD 100W or higher power ratings cost around 100 RMB even when found as cheap scraps, while computer power supplies are readily available and inexpensive for most people. Compared to AC-DC, a direct DC-DC converter significantly reduces DIY costs and can operate normally at full load for extended periods.
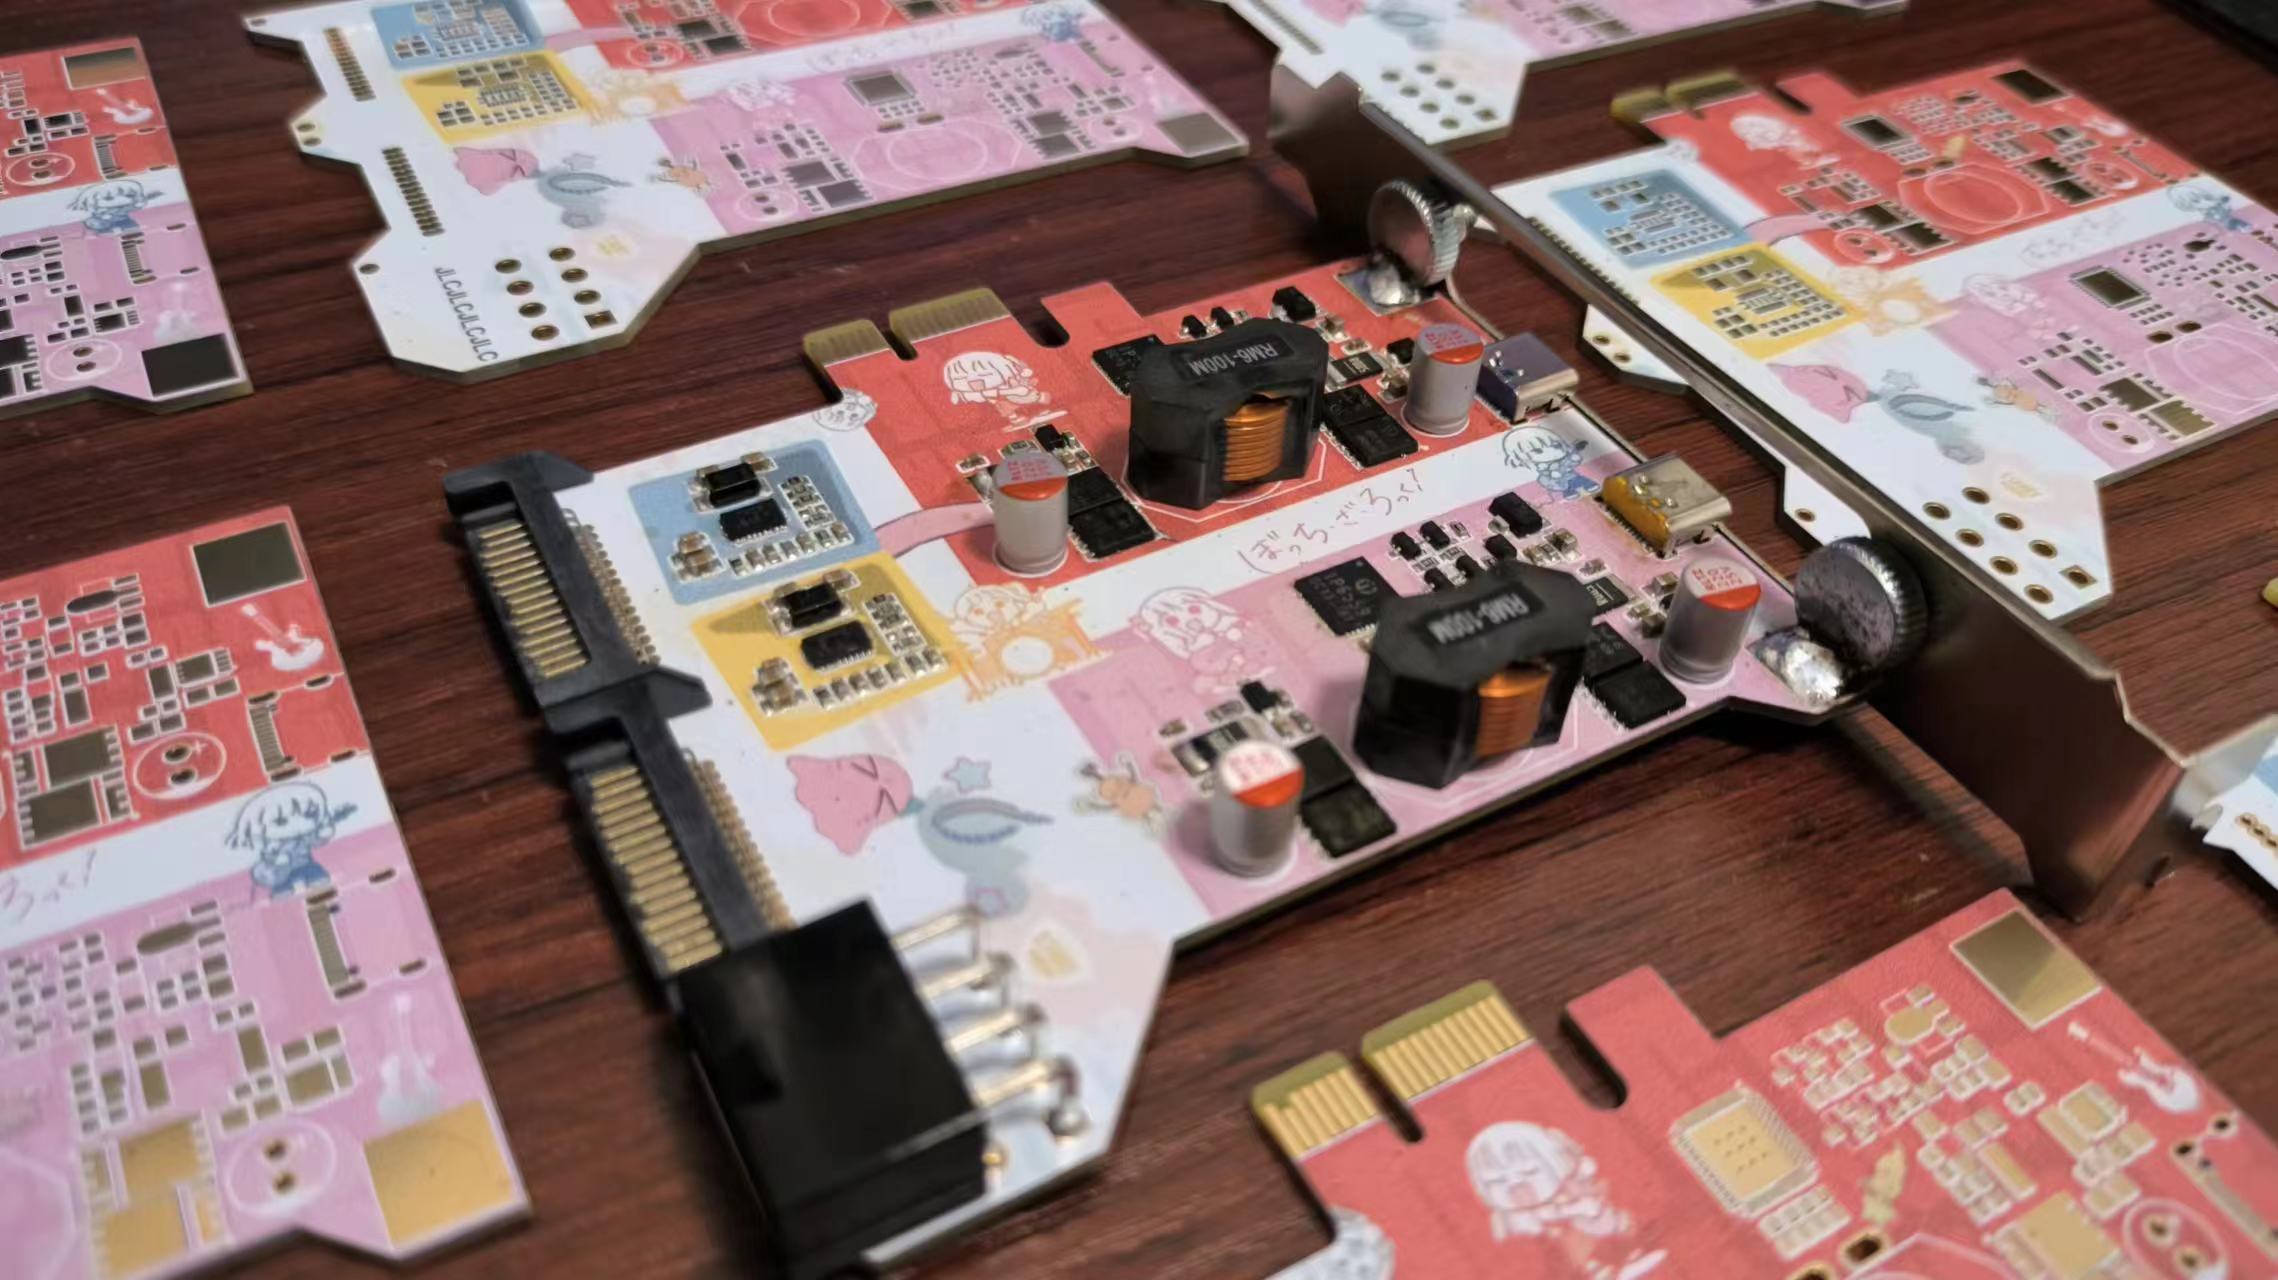
Since I got a free color silkscreen printing coupon, I used a "Lonely Rock" color silkscreen print; if you don't need it, just place your order normally.
The circuitry of this project is essentially the same as a
200W desktop power supply with dual C and dual A ports : - uses fuse chips to prevent circuit burnout due to insufficient power supply - conversion efficiency up to approximately 97% - input voltage range 9-24V. Two single C ports, each supporting up to PD 100W output - uses an 8-pin connector from a computer graphics card and two SATA 15-pin connectors for power, suitable for various interface configurations. The appearance, materials , circuitry , and components can be directly referenced from the BOM (Bill of Materials). The total cost is approximately 80 RMB, with components chosen primarily for affordability. The PCB thickness is limited to 1.6mm to fit into a PCIe slot. I will share the shopping cart link later; just select it to place your order. Step 1: Soldering the Power Supply Interface and Fuse Circuit. There's nothing particularly noteworthy about this part, except that the SATA pads are too close together and prone to solder bridging. Soldering the fuse circuit is unnecessary in the following situations: 1. Using an 8-pin graphics card connector [an 8-pin connector alone is sufficient to support 200W input, but full coverage is better]. 2. Ensuring both SATA 15-pin connectors are securely inserted, and that the total continuous power does not exceed 120W [a single SATA power connector's 12V continuous total power is approximately 60W]. Step 2: Soldering the IP6559 Main Circuit . There's nothing particularly noteworthy about this part either. After soldering, ensure there are no short circuits and test with a 9-24V power supply at a current limit of 0.1A to prevent short circuits and burnout. Step 3: PCIe Slot Installation. Installing a PCIe slot cover is mandatory; in actual use, connecting cables will cause the PCB to protrude from the PCIe slot. However, since suitable PCIe slot covers (with suitable hole positions, reasonable prices, and the ability to be fixed to the PCB) are unavailable, I considered buying a large-aperture bracket and securing it with screws, primarily because it's inexpensive. First, secure the hand-tightened screws and nuts to the baffle before soldering. Soldering stainless steel may require stainless steel solder flux. Temperature will be tested later; you can refer to the 200W desktop power supply with dual C and dual A ports . Since it operates in BOOST mode, the actual heat generation should be much lower. Ripple is almost identical to the 200W desktop power supply with dual C and dual A ports; please refer directly to the reference. Efficiency is almost identical to the 200W desktop power supply with dual C and dual A ports; please refer directly to the reference. Precautions & Issues: 1. MP5021 is very difficult to buy; many stores were out of stock after placing the order. Therefore, shorting it is still recommended. 2. The PCIe slot has 12V power supply, which can share the external power supply pressure. However, a current limiting circuit is needed, so it was not used [but connected to GND]. 3. The grounding resistance of pin 37 determines the output protocol of port C. Connecting an NTC can provide temperature protection, but a suitable NTC was not found. A resistance value of around 130KΩ is sufficient to output 100W. Lower resistance values will reduce power, while higher values won't reach 100W. 4. After soldering the ORING circuit, I found it somewhat impractical: firstly, I wouldn't connect two inputs simultaneously for my own use; secondly, even the most ideal diode won't be ideal, and the chips are expensive. —Later, I simply disassembled the ORING circuit and shorted the two ends of the MOSFET. 5. The BSC059N04LS6 was the most suitable MOSFET I found, but unfortunately, all the ones I bought were counterfeit. I had to use AON6354 and BSC0906NS instead, and I tried to buy used parts. 6. Although the VOOC pin is still available, none of the chips I can currently buy support it. I'm thinking of combining it with a PCIe to USB chip [such as VL822] to create a full-featured Type-C port. I wonder if such a combination chip exists. I wonder if it's feasible to connect PD and VBUS to the fast charging circuit, and the three pairs of data signals to the VL822 [VL162: ???].


PDF_200W Dual-C Power Supply - PCIe Slot [Lonely Rock Color Silkscreen Print].zip
Altium 200W Dual C Power Supply - PCIe Slot [Lonely Rock Color Silkscreen Print].zip
PADS_200W Dual-C Power Supply - PCIE Slot [Lonely Rock Color Silkscreen Print].zip
BOM_200W Dual-C Power Supply - PCIe Slot [Lonely Rock Color Silkscreen Print].xlsx
91087
STM32H7 Development Board / OpenMV4P
The OpenMV 4 Plus, designed as a development board, supports autofocus and exposes all unused pins.
I. Design:
1. Due to concerns about design errors and waste in the 6-layer board, many designs by the expert Cheng Huanhuan were referenced.
2. The board adopts a development board design, bringing out all unused pins, making the available I/O more than 3 times that of the original OpenMV.
OpenMV.zip
Supplement.zip
PDF_STM32H7 Development Board - OpenMV4P.zip
Altium_STM32H7 Development Board_OpenMV4P.zip
PADS_STM32H7 Development Board_OpenMV4P.zip
BOM_STM32H7 Development Board_OpenMV4P.xlsx
91088
Multi-state rotating display stand v1
The display stand shows the artwork; the video demonstrates how to use it. I feel the video is better than the artwork itself. ^_^
The usage instructions are explained in seconds by watching the video, which shows all the details.
Work Showcase.mp4
PDF_Polymorphic Rotating Display Stand v1.zip
Altium_Polymorphic Rotating Display Stand v1.zip
PADS_Multi-state Rotating Display Stand v1.zip
BOM_Multi-morphic Rotating Display Stand v1.xlsx
91089
Touch-lit desktop
Touch-sensitive illuminated desktop, customizable size, modular design.
1. The initial version of the project achieves basic functionality but still has many shortcomings. Hopefully, it will inspire you. Replicating it is not recommended; wait for updates and improvements.
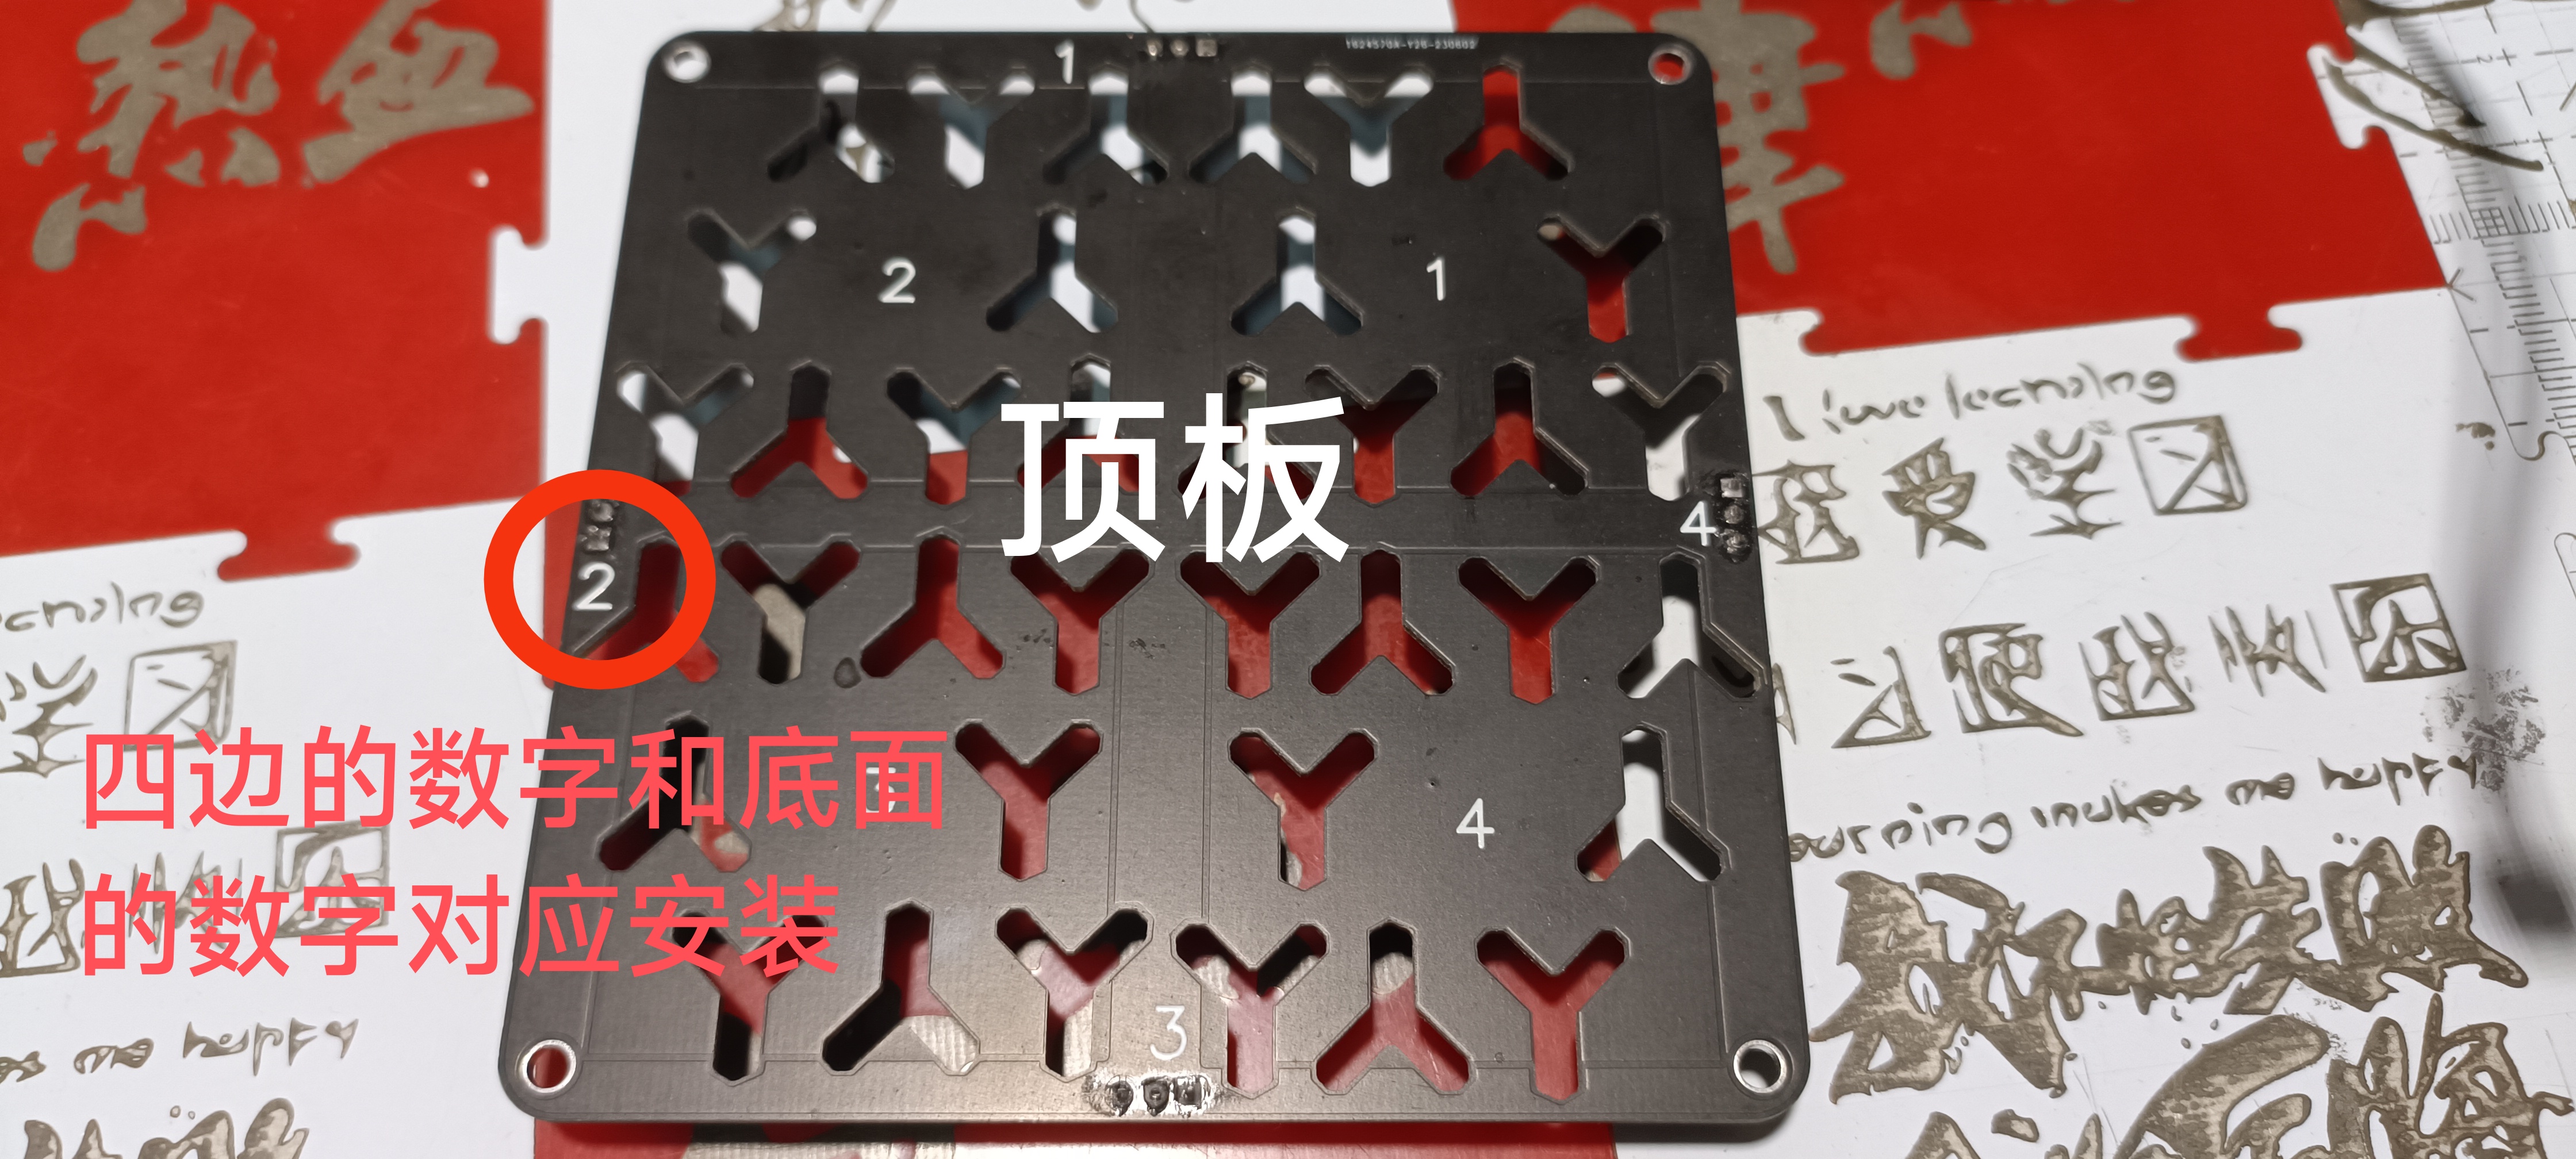
2. Each module consists of two PCBs, one top and
one bottom. Each module is 10cm x 10cm. Use multiple modules to splice together the area needed. 3. Prepare two acrylic pieces of the same size as the area to be produced. One is for the top layer for light transmission, and the other is for the bottom layer for fixation. Secure them with screws after drilling and tapping.
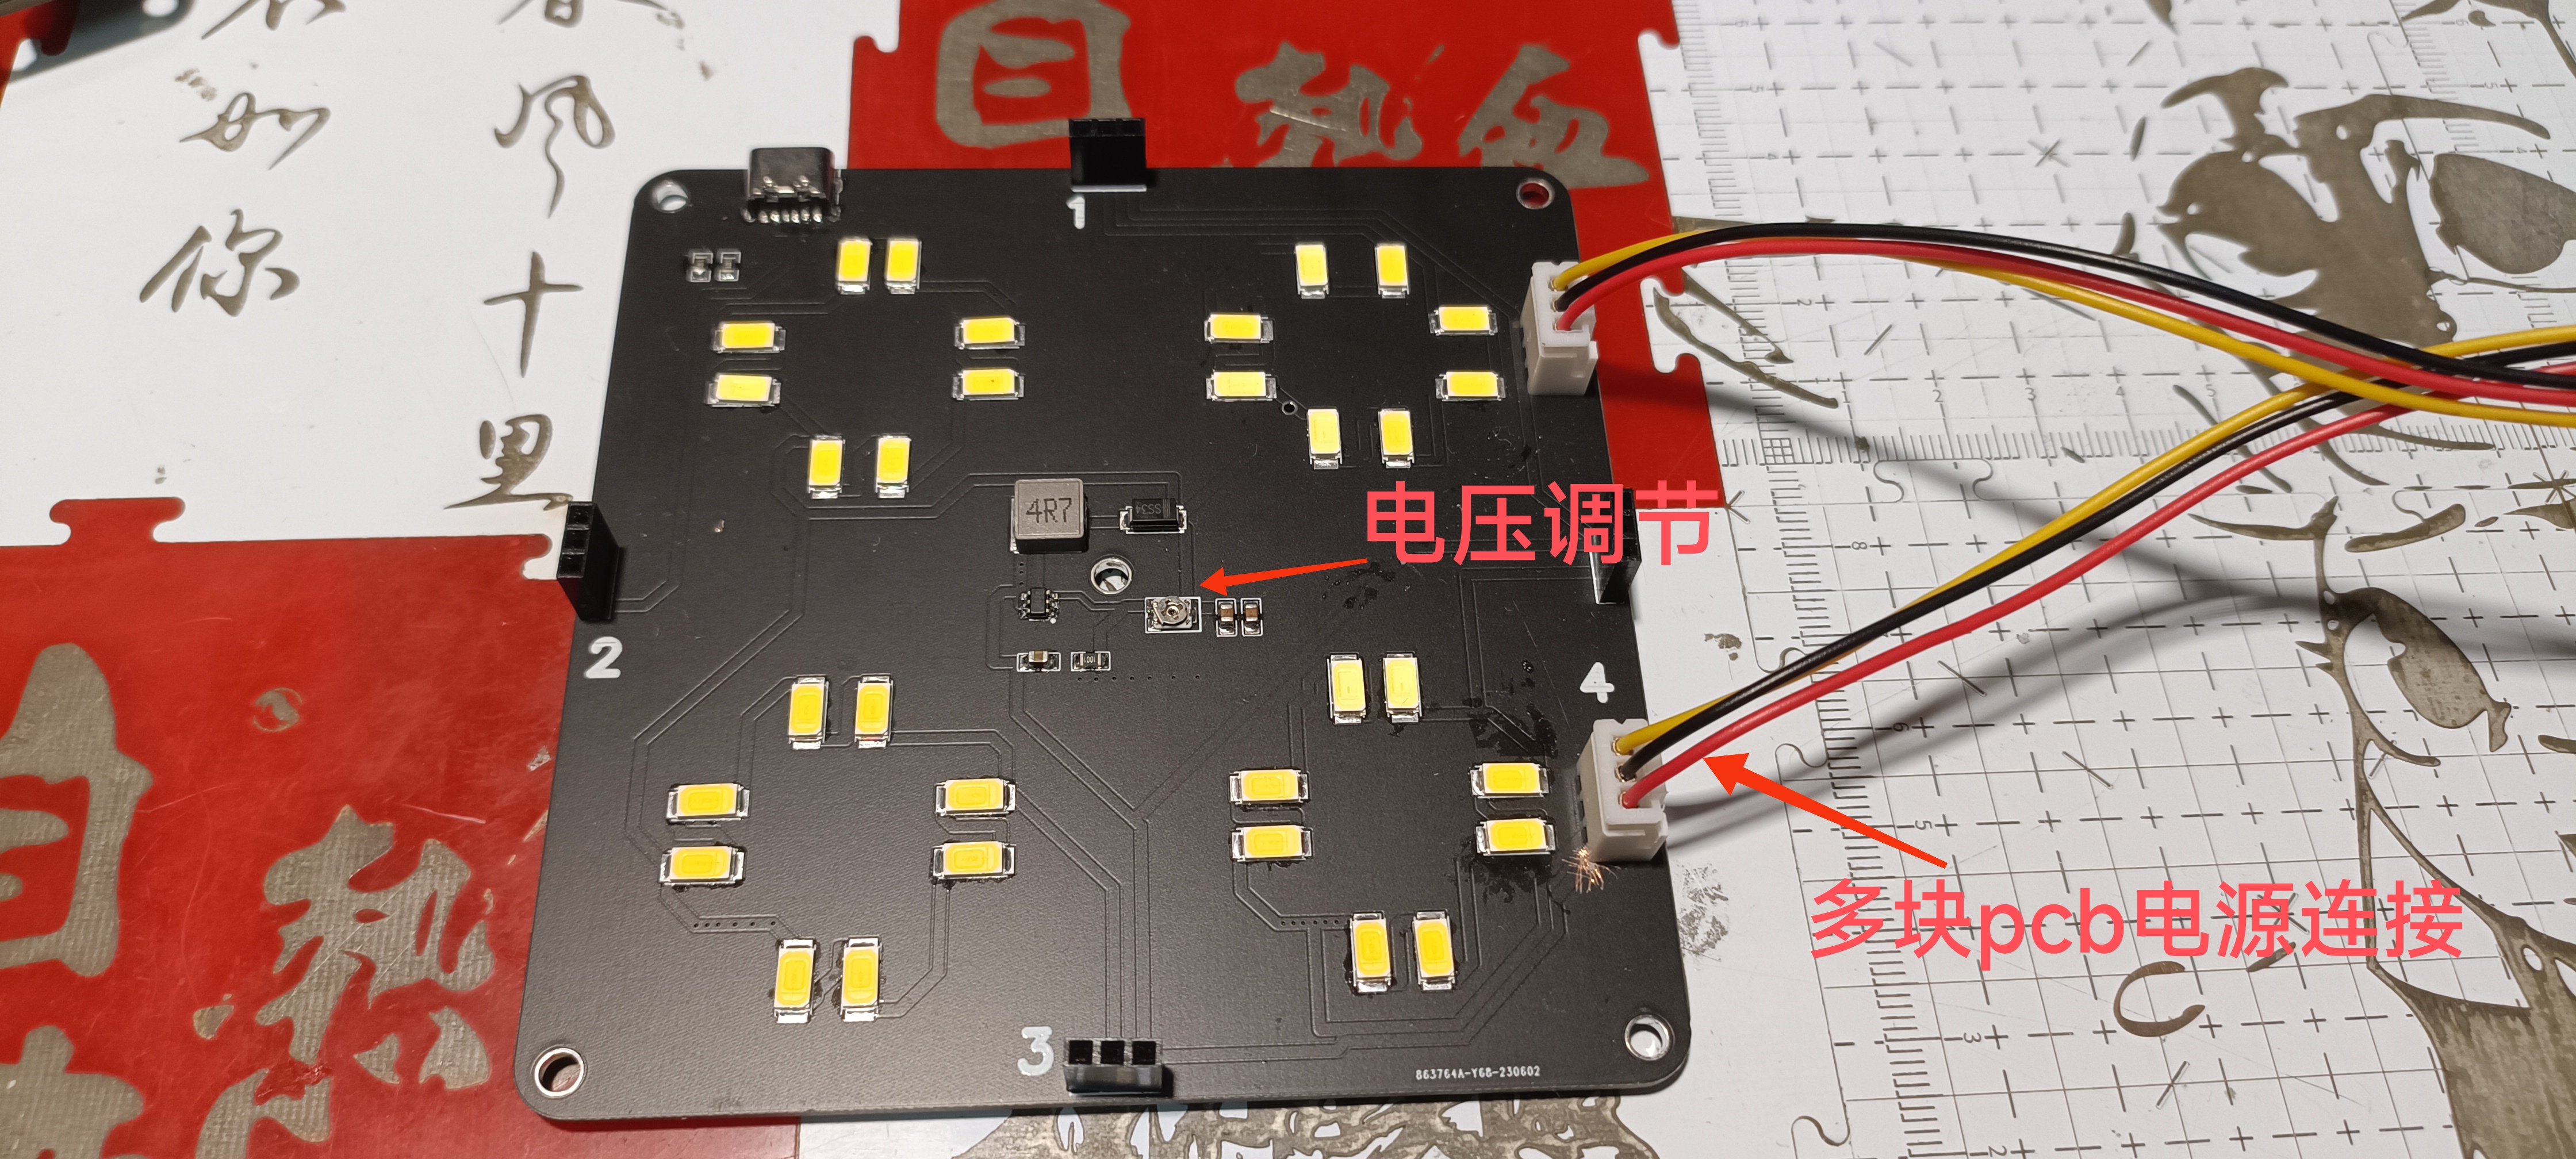
4. Adjust the voltage before use. The voltage should be between 10V and 11.5V. Higher voltage results in brighter lights; adjust to your preference.
5. When splicing multiple boards, power the other boards through 2.54mm pitch 3P connectors. Solder all boards except the first one; solder only the LEDs and components to the other boards.
6. When connecting the 3P cables, ensure the wiring sequence is correct; one power input and one power output.
7. 3D printed fixing parts are included; use M3 self-tapping screws for basic fixation. Connect the power cables.
8. Secure a piece of wood or acrylic of the same size to the bottom of the PCB using screws, drilling holes through the PCB's holes.

9. After securing the bottom, attach the top PCB and test its functionality and the adjustment of the light brightness.

10. Finally, secure the top layer of translucent acrylic; black semi-transparent acrylic is recommended, secured by drilling and tapping.
Touch glow v3.stl
12.mp4
PDF_Touch Light Desktop.zip
Altium_Touch Light Desktop.zip
PADS_Touch Light Desktop.zip
BOM_Touch Light Desktop.xlsx
91090
Handheld laser measuring instrument
The handheld laser measuring instrument project based on the GD32F303CBT6 achieves accurate measurement within a distance of up to 2 meters. It supports lithium battery charging and discharging circuitry, is triggered by a button, displays measurement data on an OLED screen, and is accompanied by a buzzer alert.
I. Project Introduction
This project uses domestically produced chips, specifically the GD32F303CBT6 from GigaDevice, as the main control chip. It is powered by a Type-C interface and incorporates a lithium battery charging and discharging circuit as well as a power switching circuit to ensure portability. It uses a VL53L0x laser measurement sensor, which can achieve accurate measurements within 2 meters. Measurements are triggered by a button, the measurement data is displayed on an OLED screen, and a buzzer provides a reminder.
II. Onboard Resources
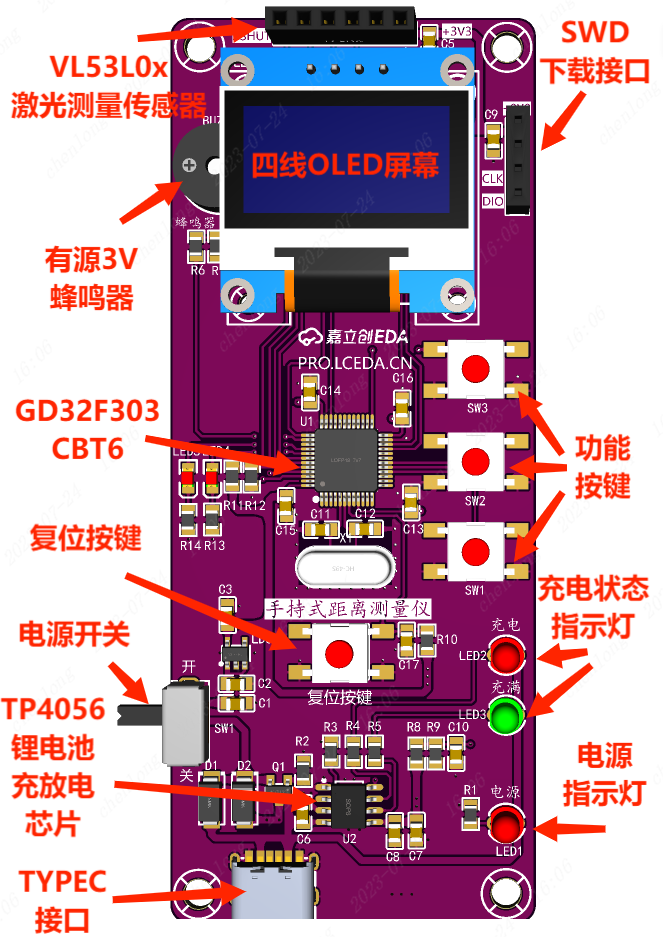
: Main Control Chip: GD32F303CBT6;
Power Interface: TYPE-C 6Pin;
Display Interface: 4-wire OLED display interface, battery charging indicator LED, power indicator;
Boot Mode: BOOT mode configuration, resistance soldering;
Debugging Interface: SWD programming method, 4Pin through-hole header;
Peripheral Interfaces: 3V active buzzer, VL53L0x laser measurement sensor 4Pin interface;
III. Advantages and Features:

The board has a slender appearance, making it easy to hold with one hand, with dimensions of 40mm*99mm (1574.803mil*3897.638mil);
The overall layout is not compact, making it easy to solder;
The chips and sensors are inexpensive, feature-rich, and cost-effective;
It uses high-quality PCBs and genuine components from JLCPCB to ensure product quality;
IV. Circuit
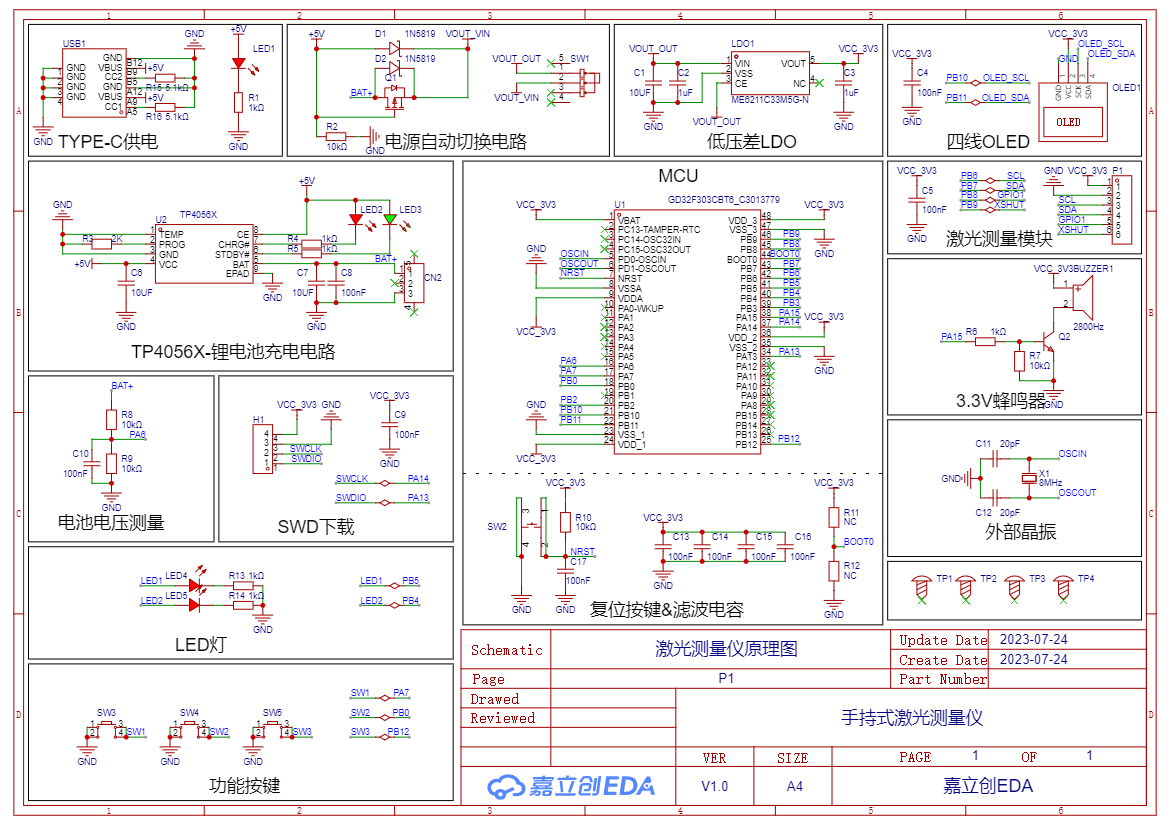
Diagram 4-1 Handheld Distance Measuring Instrument Schematic Diagram
1. Power Supply Circuit The power
supply circuit mainly consists of a TYPE-C power supply circuit, a power switching circuit, and an LDO-5V to 3.3V converter. It uses a 6-pin TYPE-C interface, which is simple, convenient, and easy to solder.

Figure 4-2 shows the TYPE-C power supply circuit
. The LDO-5V to 3.3V step-down circuit takes power from the TYPE-C interface or battery, steps it down to 3.3V, and supplies power to the main control chip. The capacitor acts as a filter to make the output voltage signal more stable.
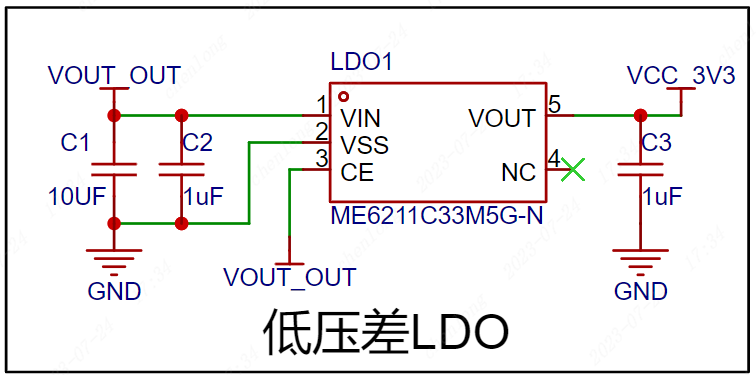
Figure 4-3 shows the LDO-5V to 3.3V
converter circuit. The power switching circuit uses an AO34001 Amos transistor and a 1N5819 Schottky diode to form a power switching circuit, thereby realizing fast switching between the TYPE-C interface and the lithium battery.
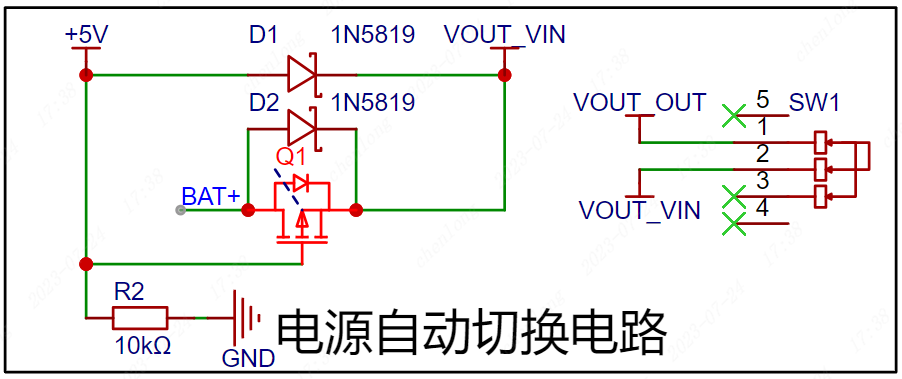
Figure 4-4 Automatic Power Switching Circuit
2. Main Control Circuit
The GD32F303CBT6 uses a Cotrx-M4 core with a 120MHz main frequency, 128K Flash, and 32K RAM. The capacitors here are for filtering and should be placed as close as possible to the chip pins when designing the PCB. A resistor controls the BOOT0 pin to control the startup mode. Note that the BOOT pin cannot be floating; a low level on the chip initiates a reset. SW2 is the reset button; when the button is pressed, the reset pin is pulled low to initiate a reset.

Figure 4-5 GD32F303CBT6 Main Control Circuit
3. Crystal Oscillator
Circuit The crystal oscillator provides the clock signal to the main control chip. The capacitors beside the crystal oscillator ensure a more stable output oscillation frequency. The 8MHz crystal oscillator circuit provides the clock signal to the microcontroller.
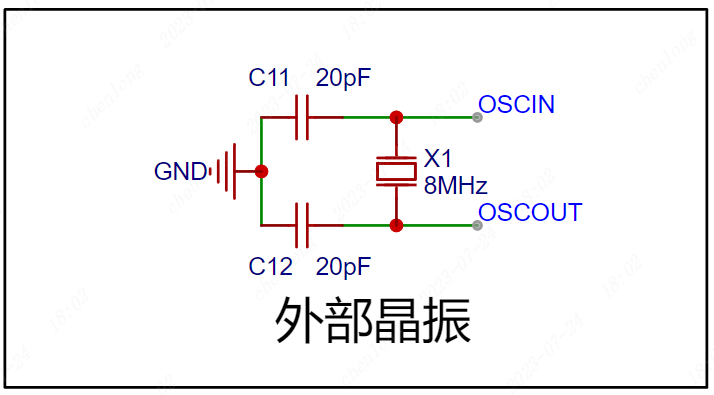
Figure 4-6 Crystal Oscillator Circuit
4. Sensor Circuit
A four-wire OLED screen is used to display measurement data. The module itself has pull-up resistors, so the IIC interface does not require external connections.

Figure 4-7 shows the four-line OLED screen circuit,
which uses a VL53L0x laser sensor module for laser ranging. The module uses IIC communication and has two control pins, compatible with 3.3V and 5V levels.

Figure 4-8 shows the laser measurement circuit
, which uses a passive buzzer for measurement indication. An NPN transistor drives the buzzer, R6 is the base current limiting resistor, and R7 is used for rapid shutdown and to prevent abnormal buzzer noise caused by power-on level instability.
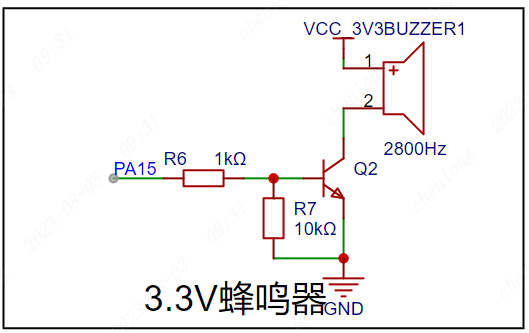
Figure 4-9 shows the passive buzzer circuit
. 5. The lithium battery charging circuit
uses a TP4056X single-cell lithium battery charging and discharging chip to charge the lithium battery. LED2 is the charging indicator, and LED3 is the charging complete indicator. The charging current is modified by changing the resistance value of R3.
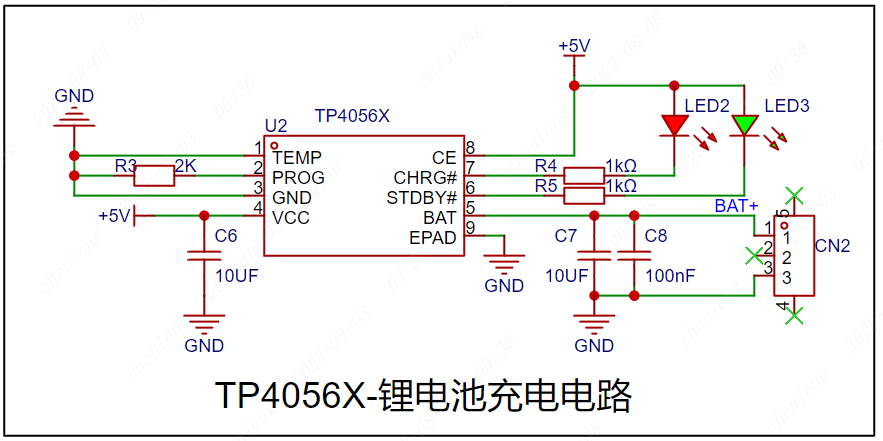
Figure 4-10 shows the lithium battery charging circuit .
The microcontroller ADC supports a maximum sampling of 3.3V. Resistor voltage division is used to convert the battery voltage to the normal range to determine the remaining battery power.
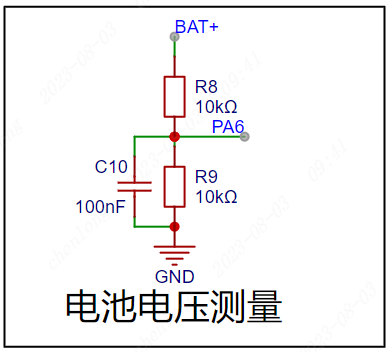
Figure 4-11 shows the battery voltage measurement circuit.
6. The basic peripheral circuit
uses LEDs to test the microcontroller's I/O output function and also as status indicators.

Figure 4-12 shows the LED circuit,
which uses a button to test the microcontroller's I/O input function and can also be used as a start measurement status input.

Figure 4-13 shows the button circuit.
6. The download circuit
uses SWD download, and the download pins are brought out through a 2.54*4P female connector for easy connection to an external downloader.

Figure 4-14 SWD Download Circuit
V. PCB Layout Recommendations
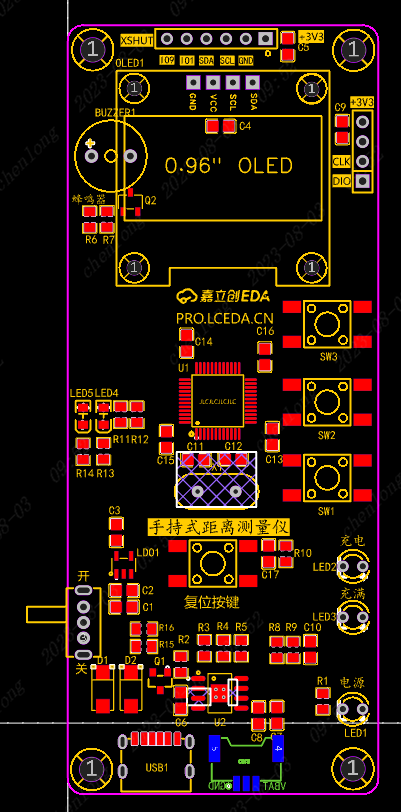
Figure 5-1 PCB Layout Reference:
Power supply traces are set to 30mil, signal traces to 10mil;
Components should be placed on the top layer as much as possible,
and battery interfaces should be placed on the bottom layer. Top layer routing should be the primary method, and through-holes can be used to switch to the bottom layer for connection;
Straight lines should be prioritized during routing, and bends should be made with 135° obtuse angles or arcs, keeping the horizontal and vertical lines straight and maintaining a neat design;
Crystal oscillator traces should be kept as short as possible, and no traces should be run at the bottom to reduce noise interference;
GND fan holes should be appropriately placed during routing to avoid incomplete GND after copper pouring;
VI. PCB Layout Recommendations

Figure 6-1 Top Layer Copper
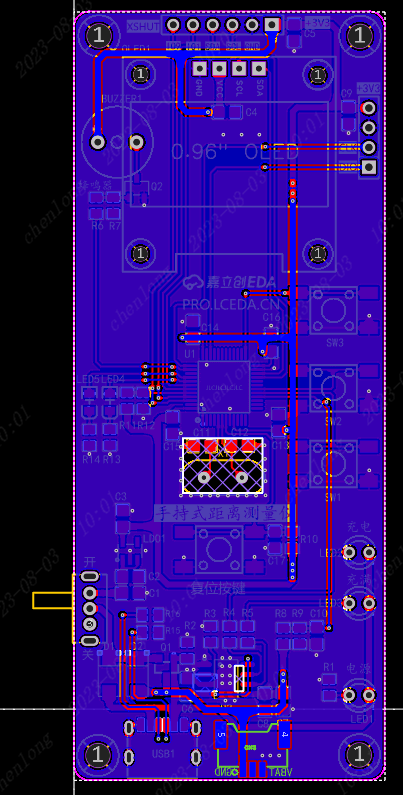
Pour Diagram Figure 6-2 Bottom Layer Copper
Pour Diagram Mark and label board information (handheld distance measuring instrument);
Add silkscreen markings for buttons, external pins, and debugging interface functions;
Add a teardrop effect to the completed PCB design to make the board more aesthetically pleasing and stable;
Add JLCJLCJLCJLC under the components to specify the customer coding position for a neat board finish;
VII. Component Soldering
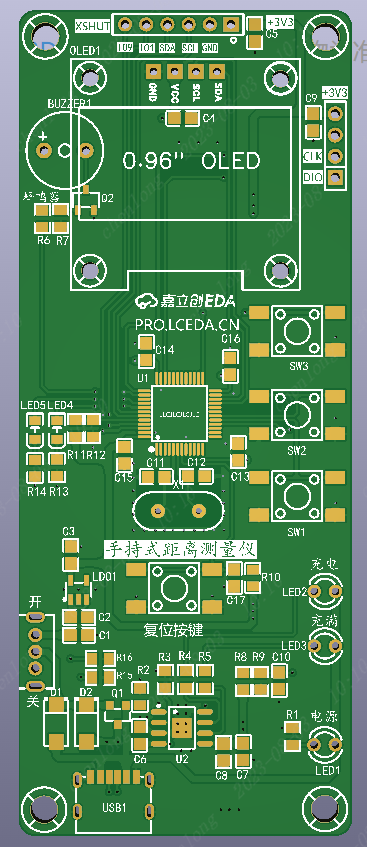
Figure 7-1 The recommended order for soldering auxiliary tools is
as follows:
First, solder the TYPEC interface, ensuring there is no short circuit in the power supply .
Then, solder the chip, ensuring the pins are soldered correctly and there are no solder bridging or cold solder joints . Next,
solder the resistors, capacitors, diodes, chips, and crystal
oscillators. Finally, solder the switches and connector pins.
Note:
When soldering, you can select the soldering auxiliary tools in the JLCPCB EDA toolbar for real-time interaction and convenient soldering.
After soldering, clean the surface with alcohol or board cleaner, and carefully inspect the chips and interfaces for any problems;
VIII. Physical Demonstration
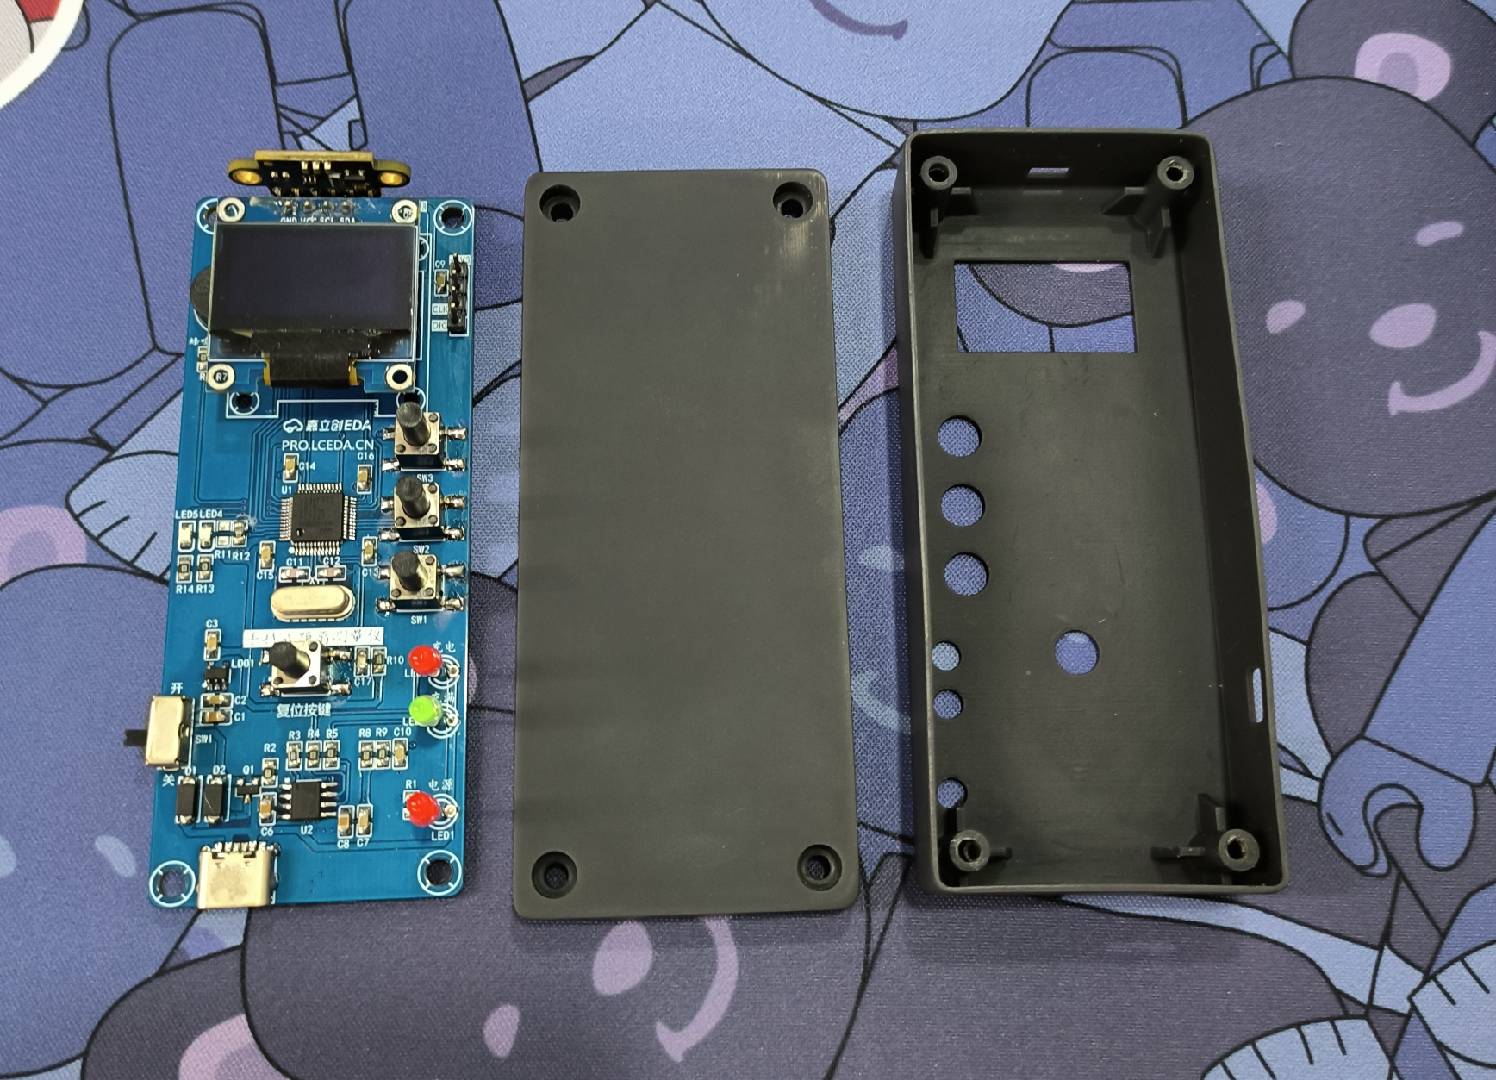
Figure 8-1 PCB Board and Housing
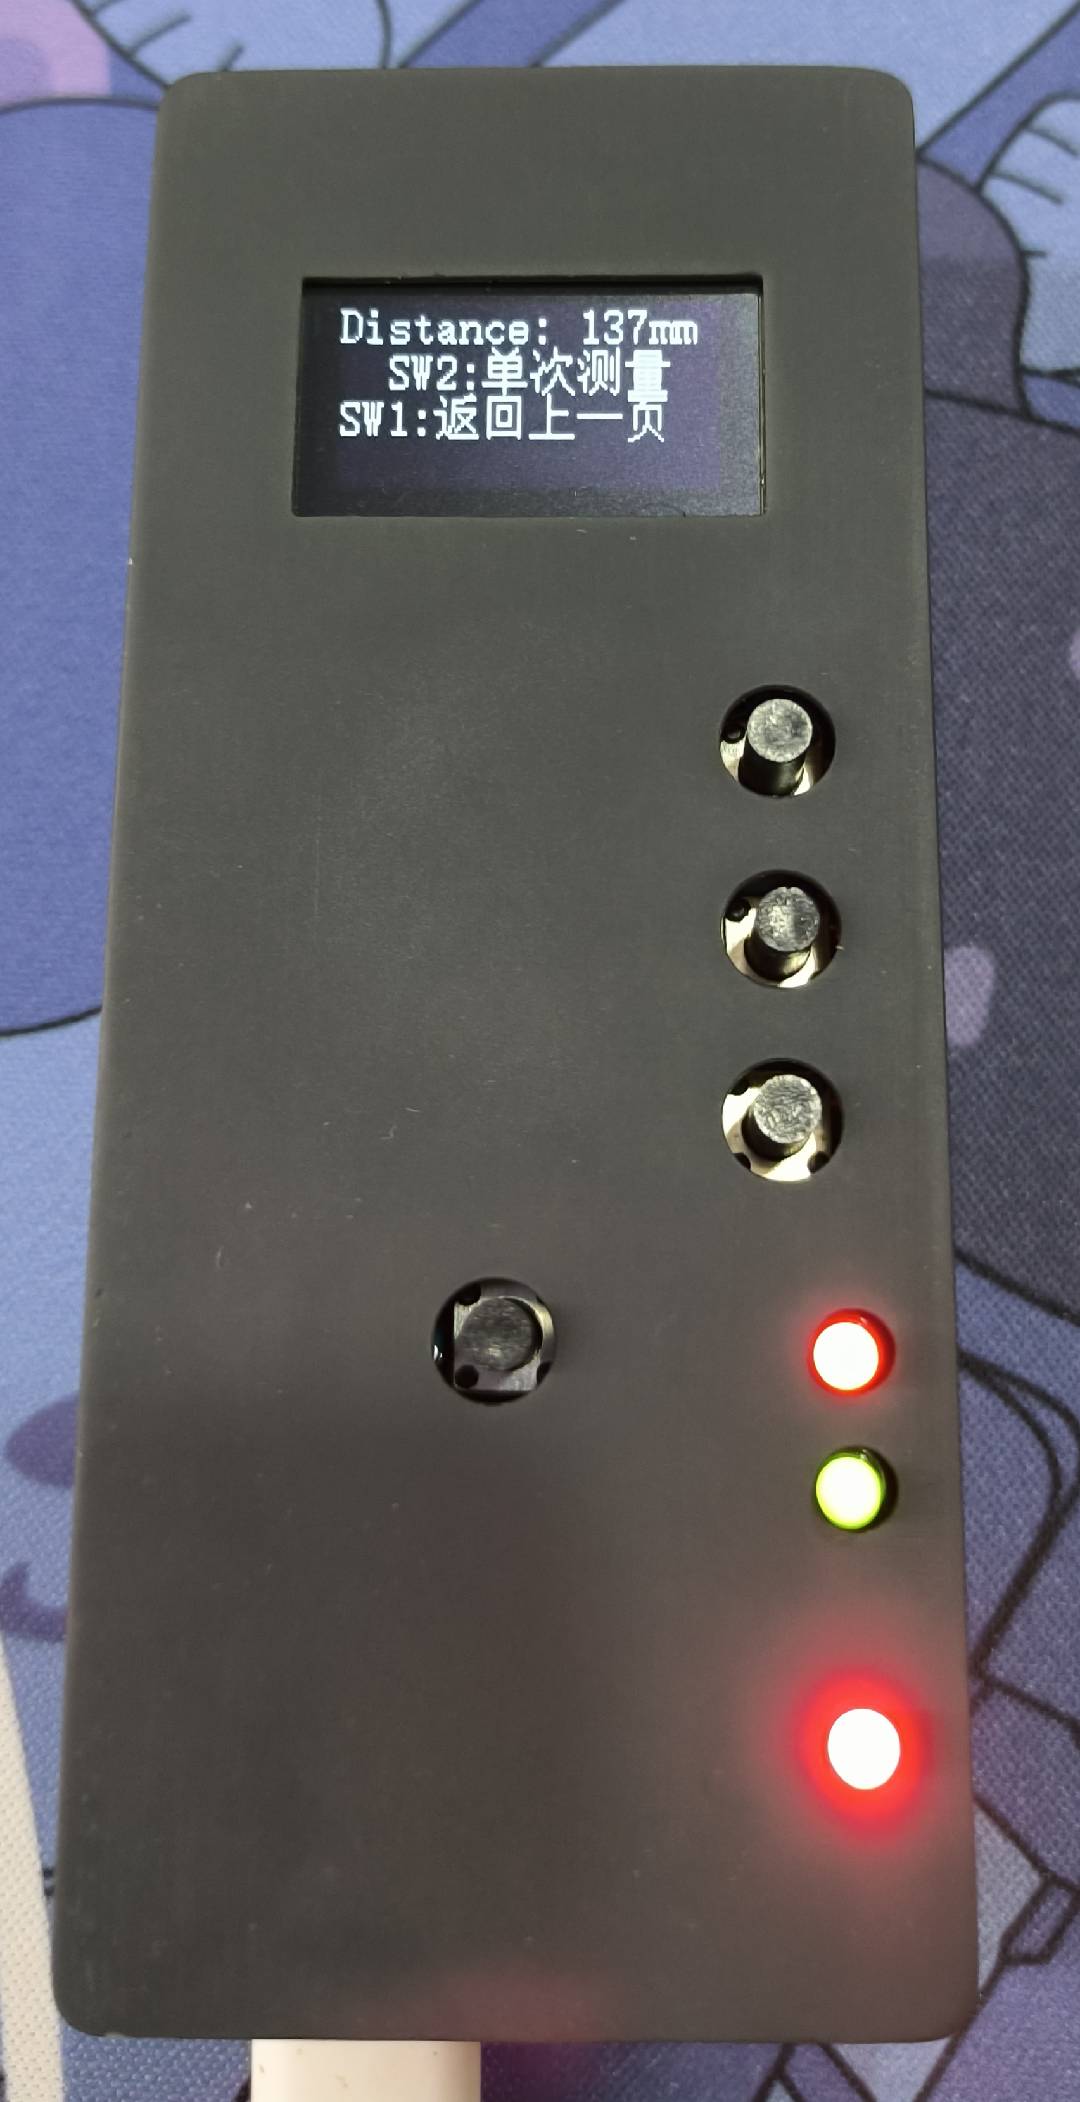
Figure 8-2 Actual Result
Handheld Laser Distance Meter Program.zip
PDF_Handheld Laser Measuring Instrument.zip
Altium Handheld Laser Measuring Instrument.zip
PADS Handheld Laser Measuring Instrument.zip
BOM_Handheld Laser Measuring Instrument.xlsx
91091
Air32-based handheld oscilloscope
A handheld oscilloscope based on the Air32F103CCT6.
Introduction:
This project uses LCSC EDA for the hardware design and FreeRTOS and LVGL graphics library for the software, making it suitable for beginners. The oscilloscope preamplifier circuit is based on Lao Liang's STC oscilloscope. The main control chip is Heze Air32F103CCT6, with a maximum frequency of 256MHz, and a 3.5-inch TFT high-definition color screen (SPI communication) with a resolution of 320*480. A touchscreen interface is also provided. It is powered by a 3.7V lithium battery and can be charged via Type-C. The measured charging current is 0.9A. Due to the use of a linear charging chip, the heat generated during charging is too high, which can be improved in future projects. Operationally, a roller encoder is used for all operations.
Special Note:
For ease of learning, the code is still being organized, mainly requiring the addition of comments. Currently, only the firmware is provided for download; it will be open-sourced later. Open-source address: Gitee.
For the 3.5-inch screen, the driver IC is ST7796, with an FPC cable interface; Zhongjingyuan is recommended (no advertising fee).
The BOM is generally correct, but it's best to open the project and check it item by item.
If you encounter any bugs or other problems during use, feel free to message me.
Oscilloscope performance parameters:
1. Sampling rate: Adjustable, maximum 1MHz 2. Input voltage: -80V to +80V (theoretically, I haven't measured this high) 3. Coupling method: AC coupling and DC coupling 4. Triggering method: Rising edge and falling edge triggering 5. Uses DSP library to implement FFT spectrum
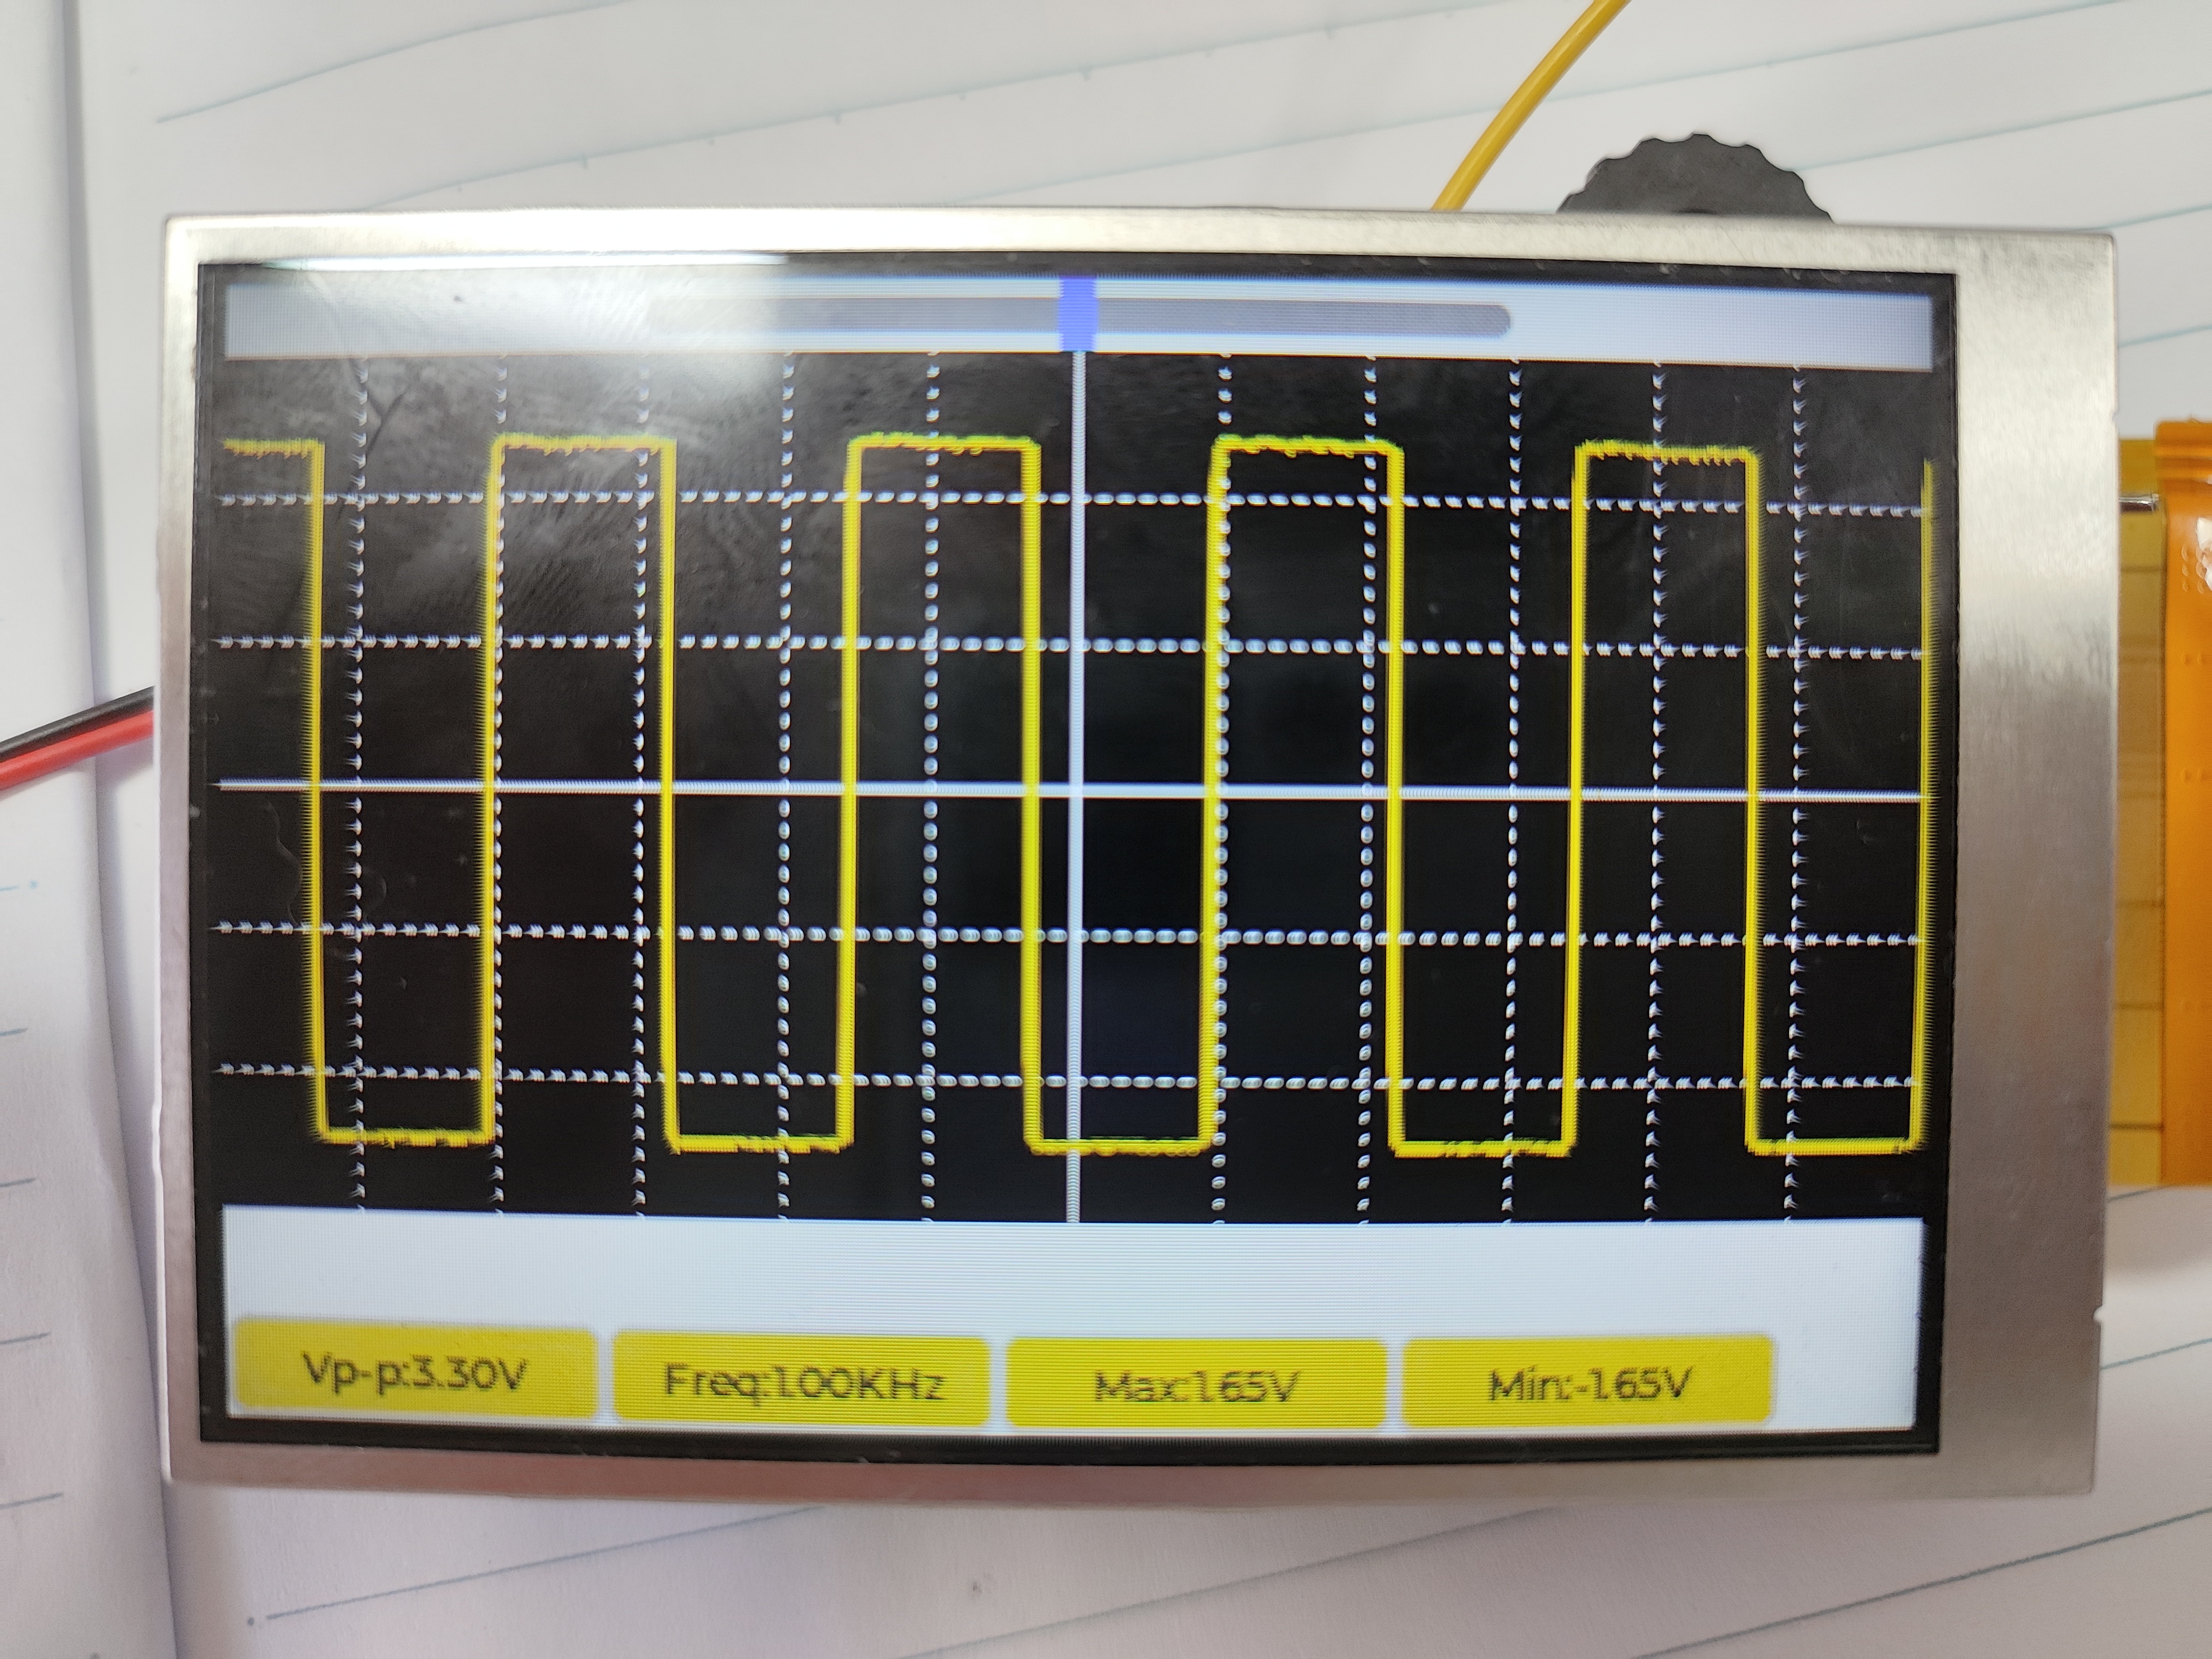
6. Includes a 1kHz square wave
7. The program is very simple; you can add code to implement other functions.
Measurement parameters:
The screen temporarily displays VPP, maximum value, minimum value, and frequency
as shown in the image above.
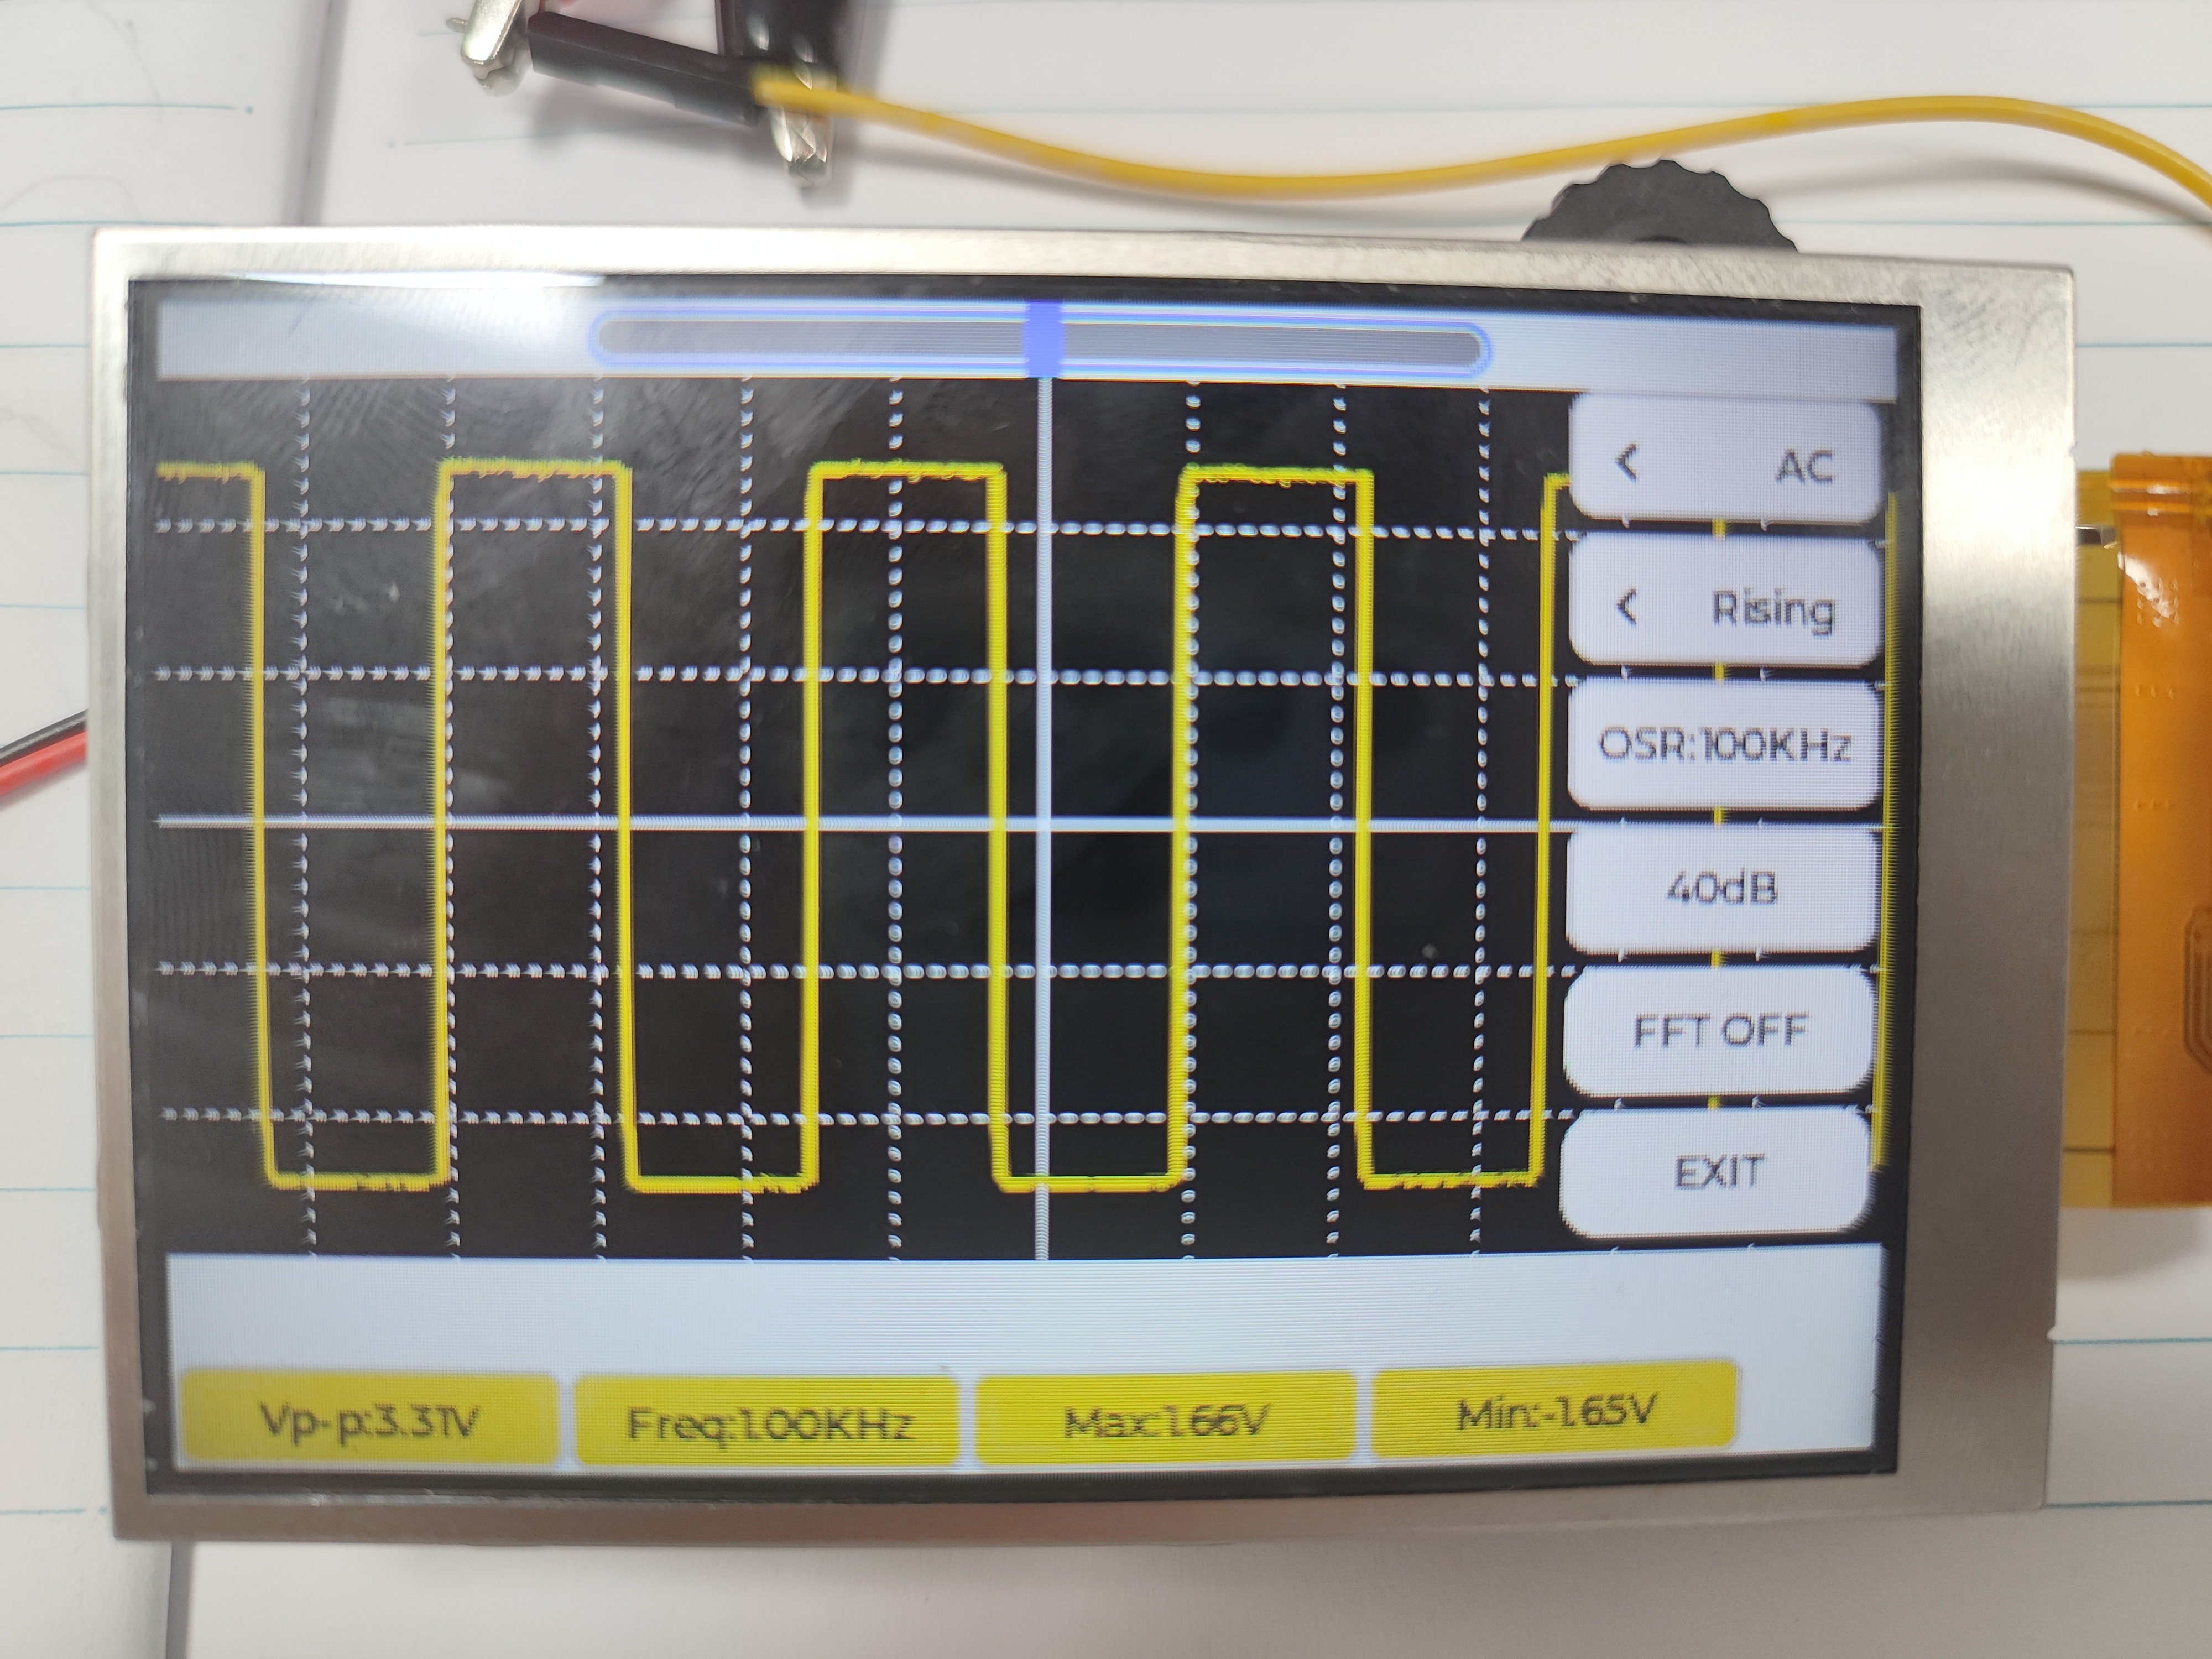
Pressing the encoder will bring up the settings interface. It will first focus on the slider at the top. Pressing the encoder will enter edit mode. Moving the encoder will move the waveform left and right. From top to bottom on the far right are the coupling method, triggering method, sampling rate, preamplifier gain, FFT spectrum, and exit.
This is my first open-source project, and there are many shortcomings. I welcome everyone to point them out, and I will continue to upgrade it in the future.
lv_0_20230802165210.mp4
Project.hex
PDF_Handheld Oscilloscope Based on Air32.zip
Altium_Handheld Oscilloscope Based on Air32.zip
PADS_Handheld Oscilloscope Based on Air32.zip
BOM_Handheld Oscilloscope Based on Air32.xlsx
91092
#8th LCSC Electronics Design Contest# Pulse Oximeter Design Based on R7FA2E1 Chip
The main controller used in this project is the R7FA2E1A72DFL, which uses the MAX30102 chip to measure blood oxygen, pulse, and temperature.
* 1. Project Function Introduction
1. Real-time detection of blood oxygen, pulse, and temperature
2. Real-time voltage detection
3. Real-time screen display
4. Battery charging support
5. Stable power supply
6. Button control interaction
In addition, it can also be used as a development board for R7FA2E1A72DFL, supporting the following functions:
1. SWD debugging and downloading
2. Serial port debugging and downloading
3. One IIC connection to MAX30102, allowing learning about IIC and MAX30102 related knowledge
4. One SPI connection to a 0.96 LCD color screen, allowing learning about IIC and screen related knowledge
5. One programmable LED
6. Two programmable buttons
7. One ADC for detecting battery voltage
*2. Project Attributes
This project is being publicly disclosed for the first time, is original, has not won any awards in other competitions, and has not participated in any school defenses.
* 3. Open Source License
GPL 3.0
*4. Hardware Part

Figure 4-1 Hardware Structure Diagram The
hardware structure diagram of this project is shown in Figure 4-1 above. This diagram contains all the hardware content, but here only the functions related to the pulse oximeter are described in detail.
1. R7FA2E1A72DFL Main Control
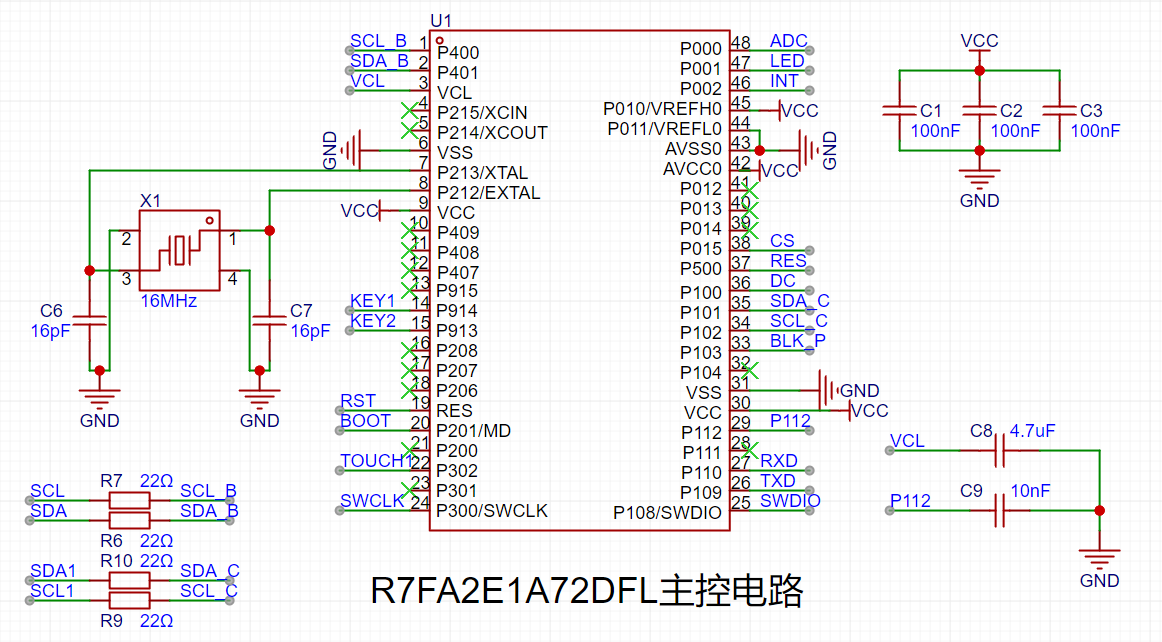
Schematic Diagram: The
main control schematic diagram of this project is shown in Figure 4-2 above. Compared with the official example, this project adds a 16MHz crystal oscillator and series resistors for SPI and IIC, and enables the ADC function.
2. Real-time Detection of Blood Oxygen, Pulse, and Temperature:

The real-time detection function of blood oxygen, pulse, and temperature in this project is implemented using a reflective scheme with the ADI MAX30102. The MAX30102 is an integrated pulse oximeter and heart rate monitor biosensor module. It integrates multiple LEDs, photodetectors, optical devices, and low-noise electronic circuitry with ambient light suppression, enabling high-precision detection of PRG (photoplethysmographic) pulse wave signals. Figure 4-3 shows the waveform detected by this device. This waveform is obtained by subtracting the minimum value from the detected raw data. The host computer software used is Anonymous Assistant.

Figure 4-3 shows the detected waveform.
Initially, the plan was to directly use the MAX30102 chip for detection. The original solution was to disassemble the chip from the MAX30102 module and then solder it onto the board for this project (the module is much cheaper than the chip, and the chip is difficult to obtain). However, the chip was likely damaged during disassembly with a hot air gun, causing it to malfunction after being soldered onto the board. Therefore, the MAX30102 module was ultimately chosen for signal detection, using IIC for communication. The MAX30102 module is shown in Figure 4-4.
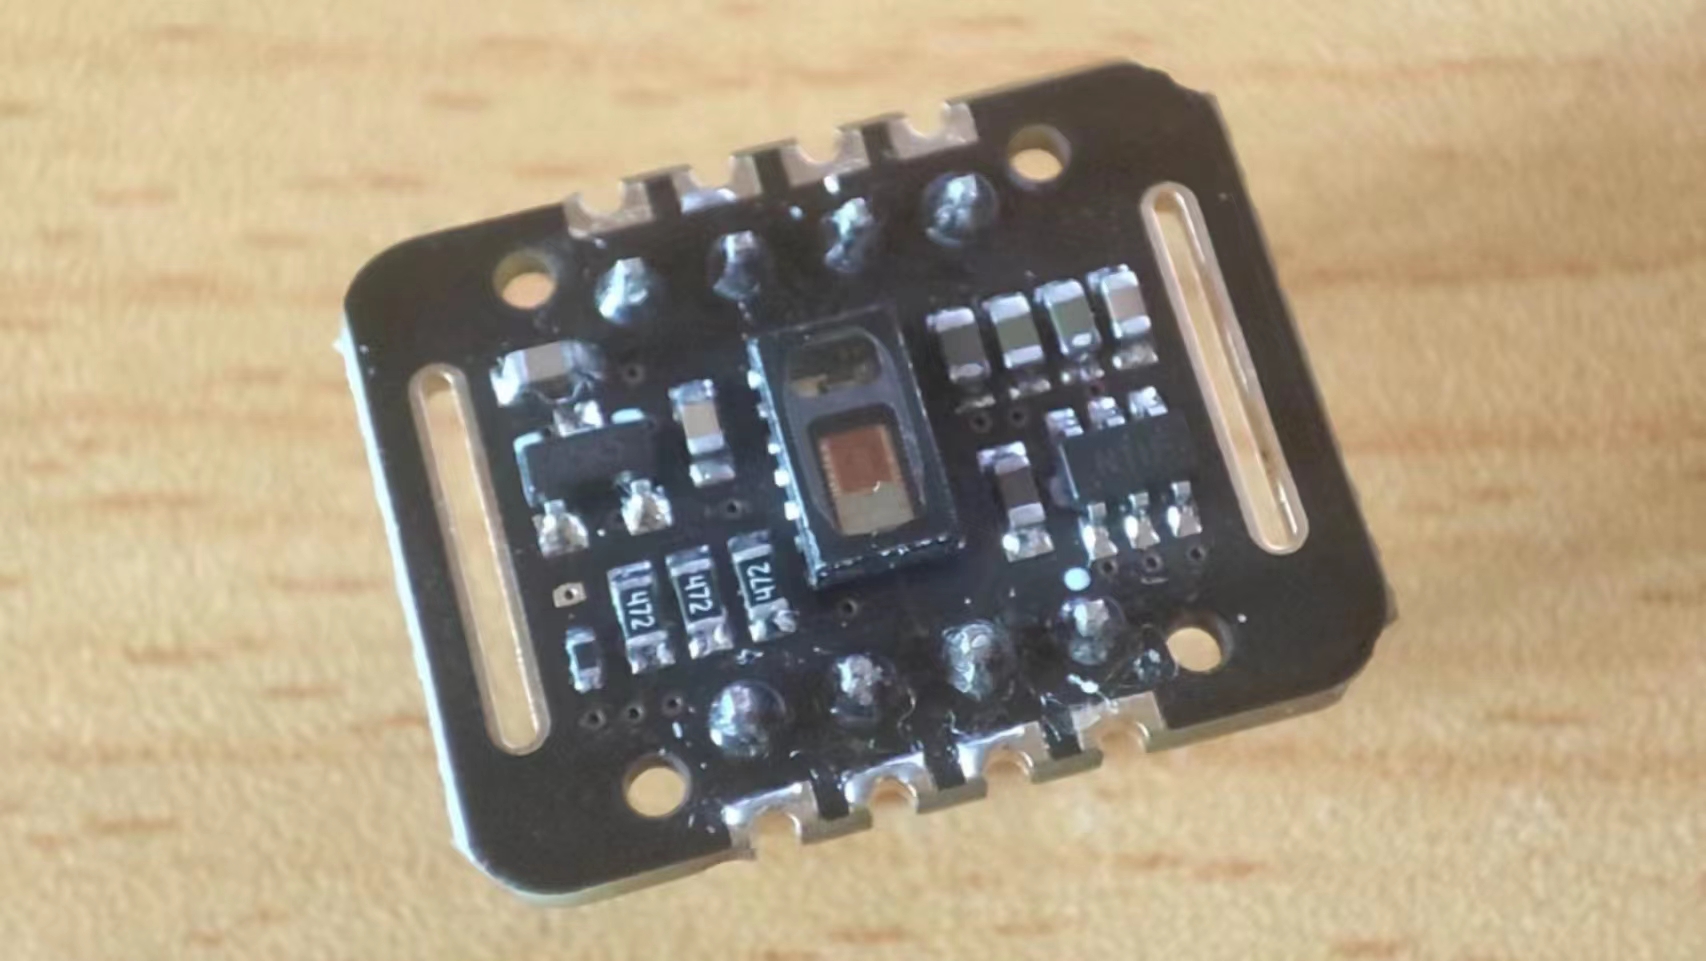
Figure 4-4: MAX30102 Module Image .
3. Real-time Voltage Detection:
Real-time voltage detection is achieved using the ADC function of the R7FA2E1A72DFL. The schematic diagram of this function is shown in Figure 4-5.

Figure 4-5: Battery Voltage Detection Schematic Diagram.
The main controller R7FA2E1A72DFL in this project uses a 3.3V power supply. The maximum voltage to be detected is 5V. Direct connection to the chip would damage it; therefore, a voltage divider is required before connection, and voltage detection is achieved through a voltage divider formula. In this design, the voltage to be detected is set as the input voltage. When the input voltage is greater than 4.2V (the voltage of a 3.7 battery can generally reach a maximum of 4.2V), it can be determined that it is charging. When it is less than 4.2V, it means the battery is supplying power normally (this judgment threshold should not be set to 4.2V, but should be slightly higher, around 4.4V). In this way, the charging status can be detected at the same time as the battery voltage.
4. Real-time screen display
The screen used in this project is a 0.96-inch LCD screen with a resolution of 160*80 and a communication interface of SPI. The schematic diagram of this part is shown in Figure 4-6.

Figure 4-6 Schematic diagram of the screen
5. Support for battery charging
The charging and discharging circuit of this project refers to the charging and discharging circuit of the official example project, with a charging indicator light. The current limiting resistor is set to 3kΩ. According to the formula in Figure 4-7, the charging current is about 400mA.

Figure 4-7 Charging current calculation formula The
schematic diagram of the charging and discharging circuit of this project is shown in Figure 4-8.

Figure 4-8 Charging and Discharging Schematic Diagram
6. Stable Power Supply
The power supply circuit of this project references the power supply circuit of the official example project, providing both TYPE-C power supply and battery power supply. When TYPE-C is connected, it supplies power and simultaneously charges the battery. When TYPE-C is not connected, the battery powers the pulse oximeter. When the power supply is connected, a 6206 linear regulator is used to obtain a 3.3V regulated voltage, providing a stable power supply for the main control and screen. The schematic diagram of the power supply section is shown in Figure 4-9.

Figure 4-9 Power Supply Schematic Diagram
7. Button Control Interaction
This project uses two buttons to implement button control interaction. Button 1 represents starting detection, and button 2 represents switching modes. The button control circuit is shown in Figure 4-10.

Figure 4-10 Button Control Circuit Schematic Diagram
8. Panel Description
There is a shell and a panel outside the PCB board. Since the buttons are designed on the front and the panel is on top of the shell, the buttons are ultimately pressed through the panel, as shown in Figure 4-11. As shown in Figure 4-12, the 3D effect of the panel, pressing the part in the red box in the figure will press the button.
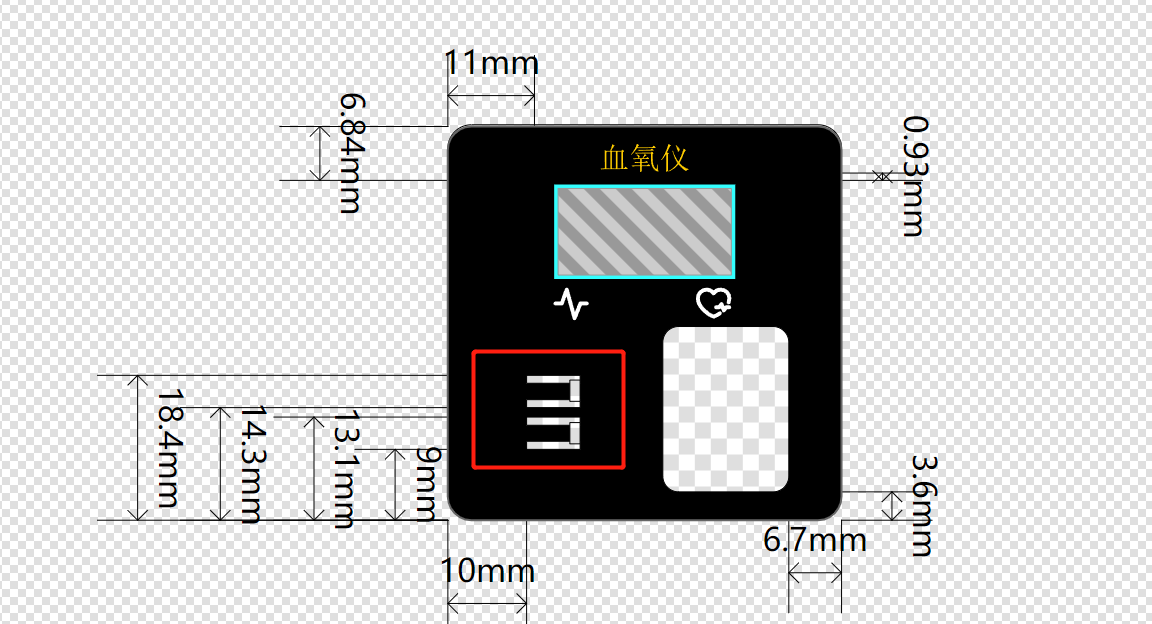
Figure 4-11 Panel Image
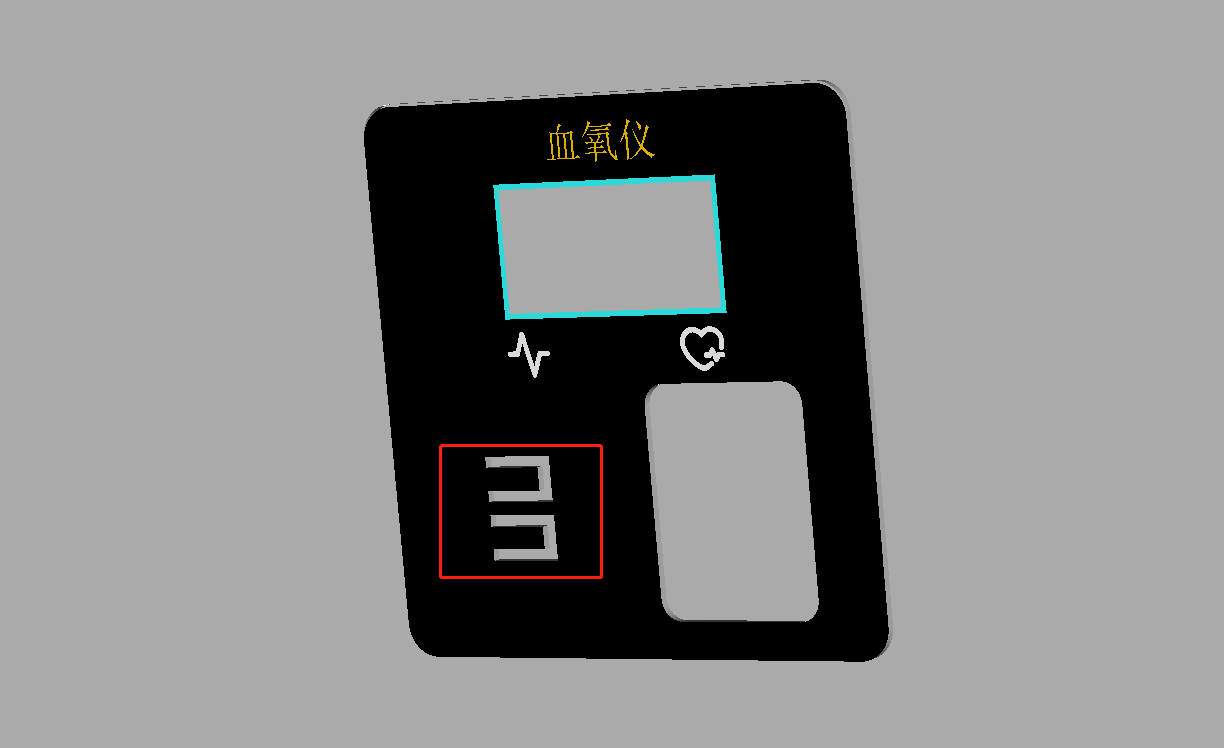
Figure 4-12 Panel 3D Rendering
9. Housing Description
When the housing thickness is too thick, the TYPE-C interface may not be easily accessible. In this case, the only option is to drill a large hole or thin the housing (this was my original approach). In this project, I used a method of drilling another hole outside the original TYPE-C through-hole outline, but not through it, as shown in Figure 4-13. The 3D effect is shown in Figure 4-14, and the actual effect is also very good, as shown in Figure 4-15.
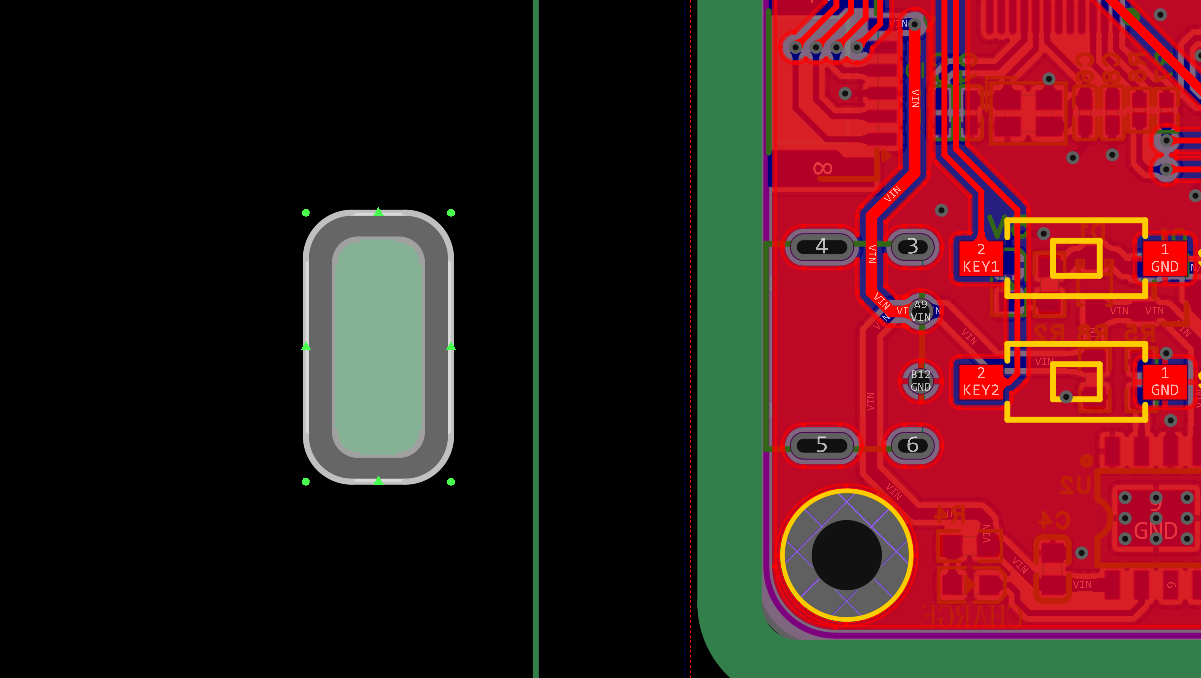
Figure 4-13 Housing Through-Hole PCB Image

Figure 4-14 Housing Through-Hole 3D Image
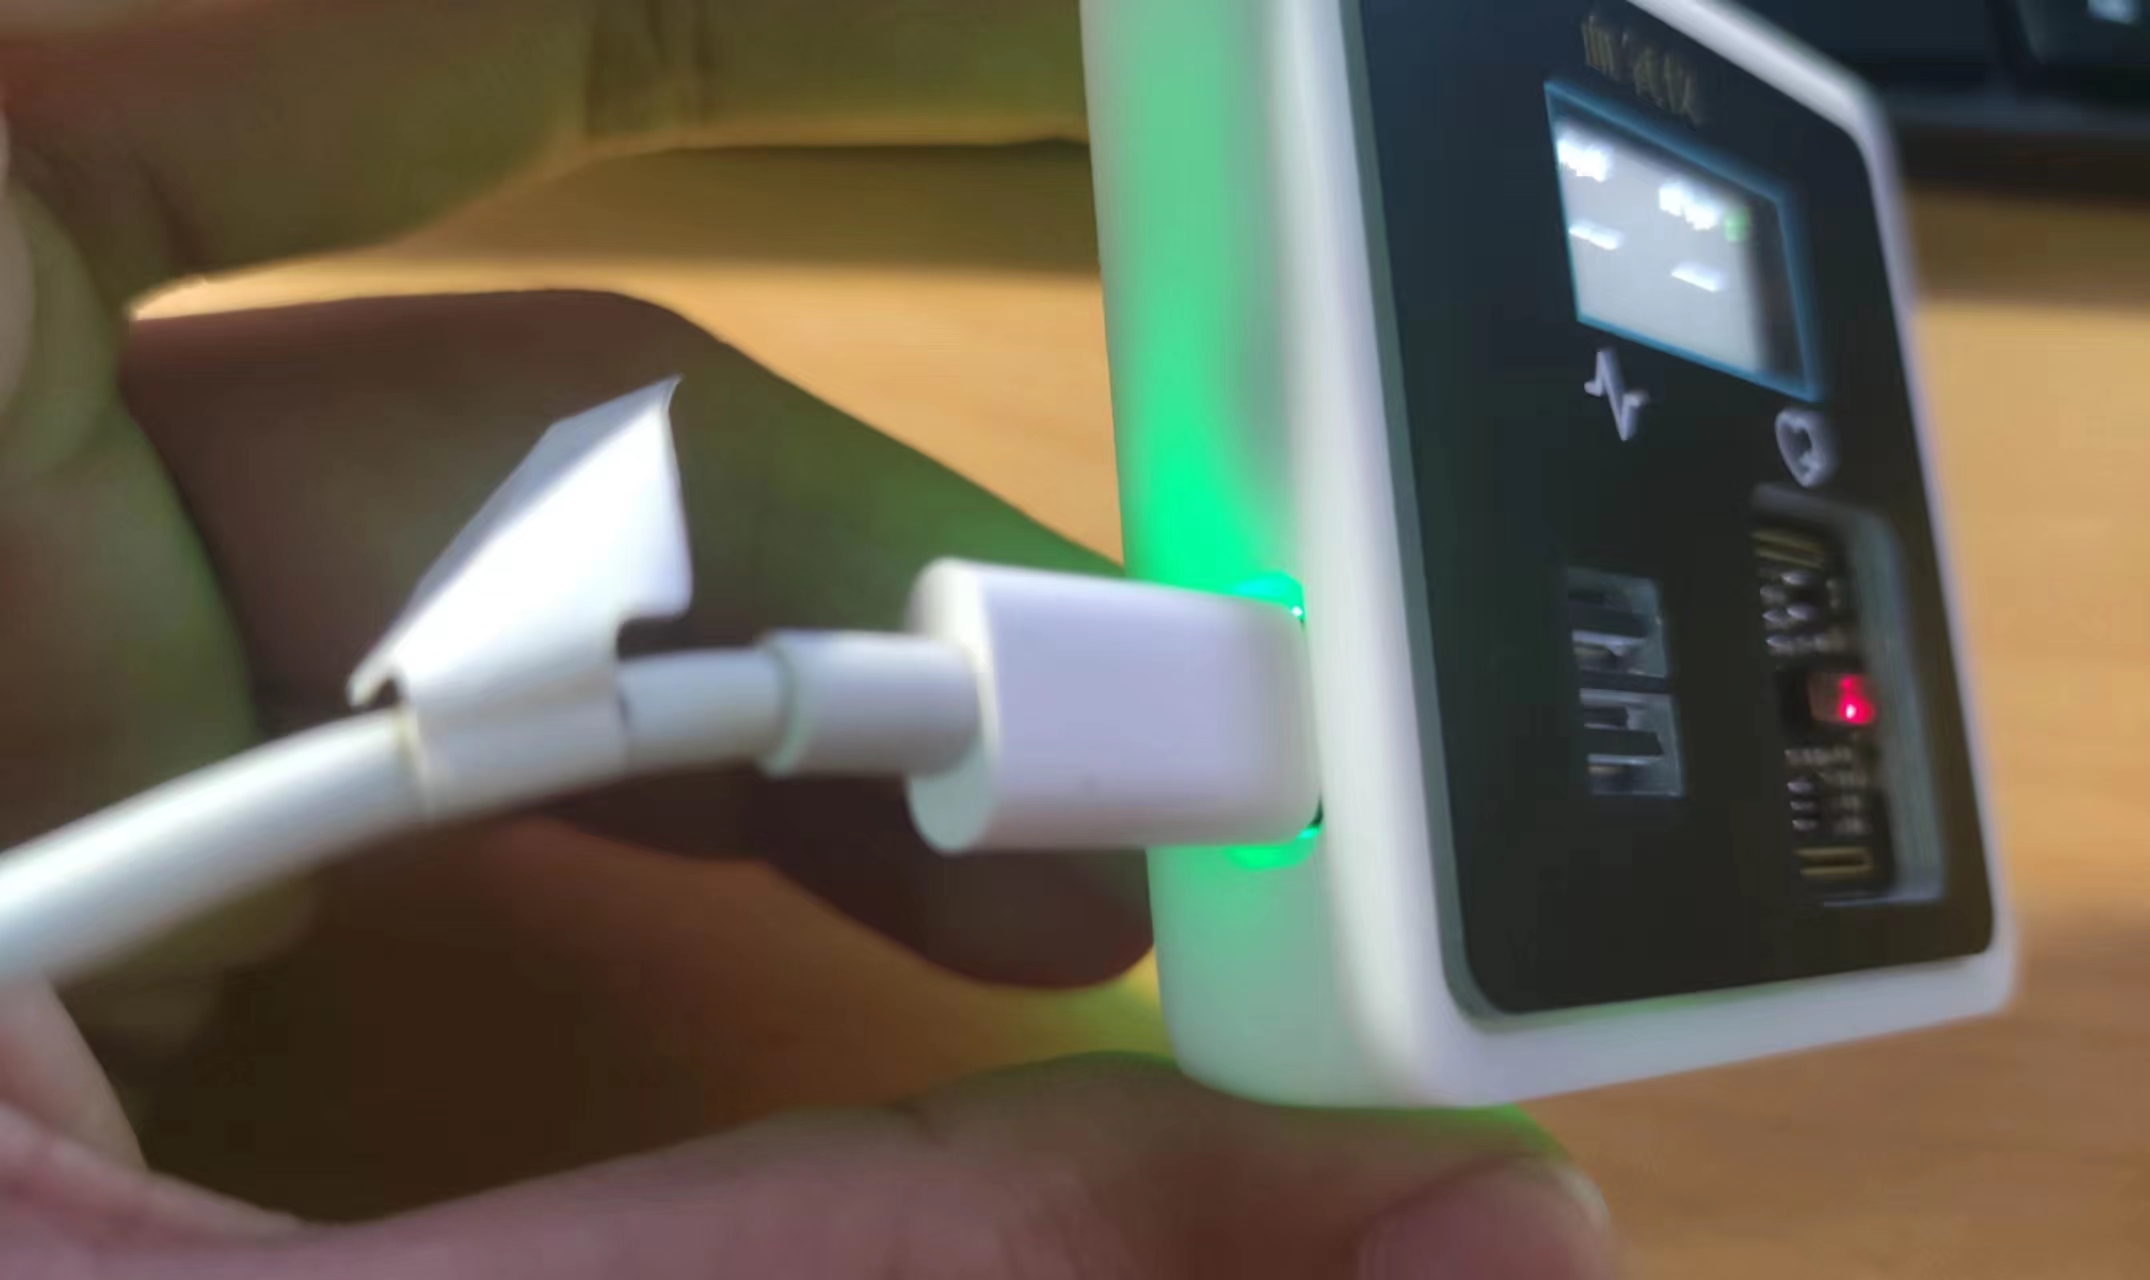
Figure 4-15 Housing Rendering The
above is all the content of the hardware part.
*5. Software Part
The software part of this project is divided into two aspects: program development and host computer debugging. The following will explain these two parts separately.
1. Program Development
For the program development, I used RASC and Keil for joint development. RASC was responsible for the chip initialization configuration, and Keil was responsible for writing the logic program. The development process of this project was both a learning process of programming and a learning process of new software. I mainly learned these two software programs through two channels: one was the official course of this training camp, the link is as follows: Making a Keil Electronic Clock Based on RASC; the other was Wildfire's tutorial course on Renesas, which currently has few video files and is mainly document-based, the link is as follows: [Wildfire] Renesas RA Series FSP Library Development Practical Guide. The configuration of these software programs can be referred to the tutorial content in the above links, so I will not elaborate further here.
1.1 RASC Initialization Configuration
Regarding the initialization configuration of RASC, the first step is stack configuration. The stack configuration of this project is shown in Figure 5-1 below.
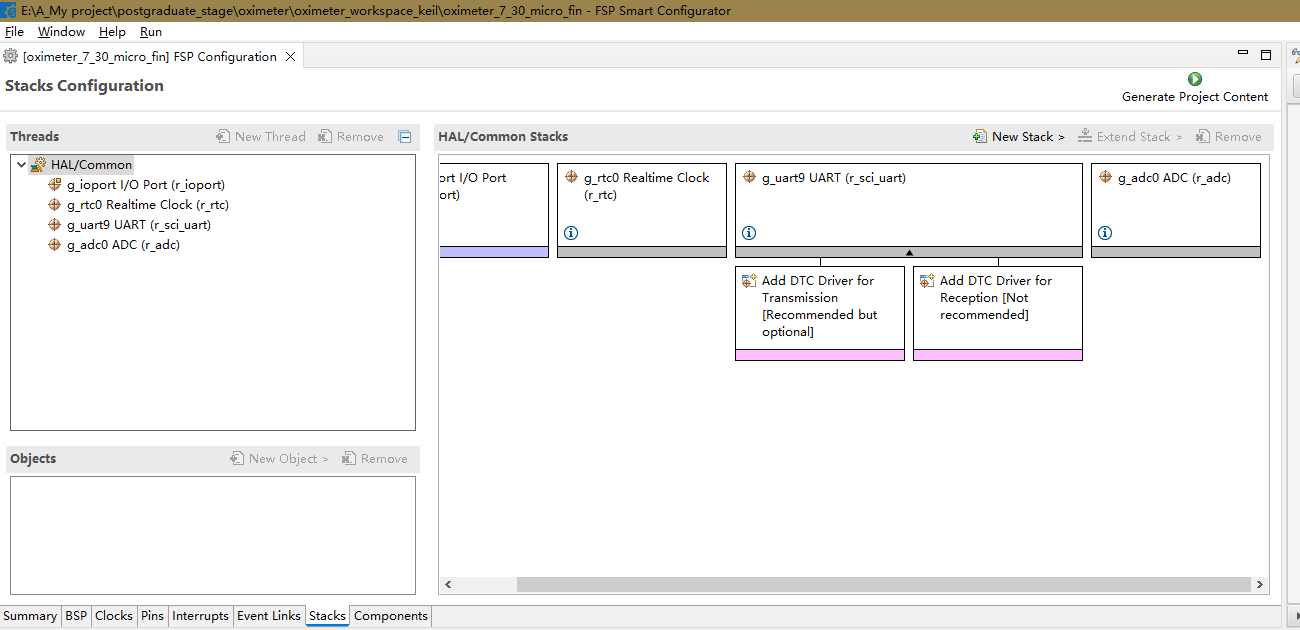
Figure 5-1 Stack Configuration
The stack used in this project mainly includes GPIO, RTC, UART, and ADC. Due to space limitations and the fact that GPIO, RTC, and UART have been explained in the tutorials above, I will not elaborate further here; I will only look at the ADC configuration. The ADC configuration is shown in Figure 5-2 below.
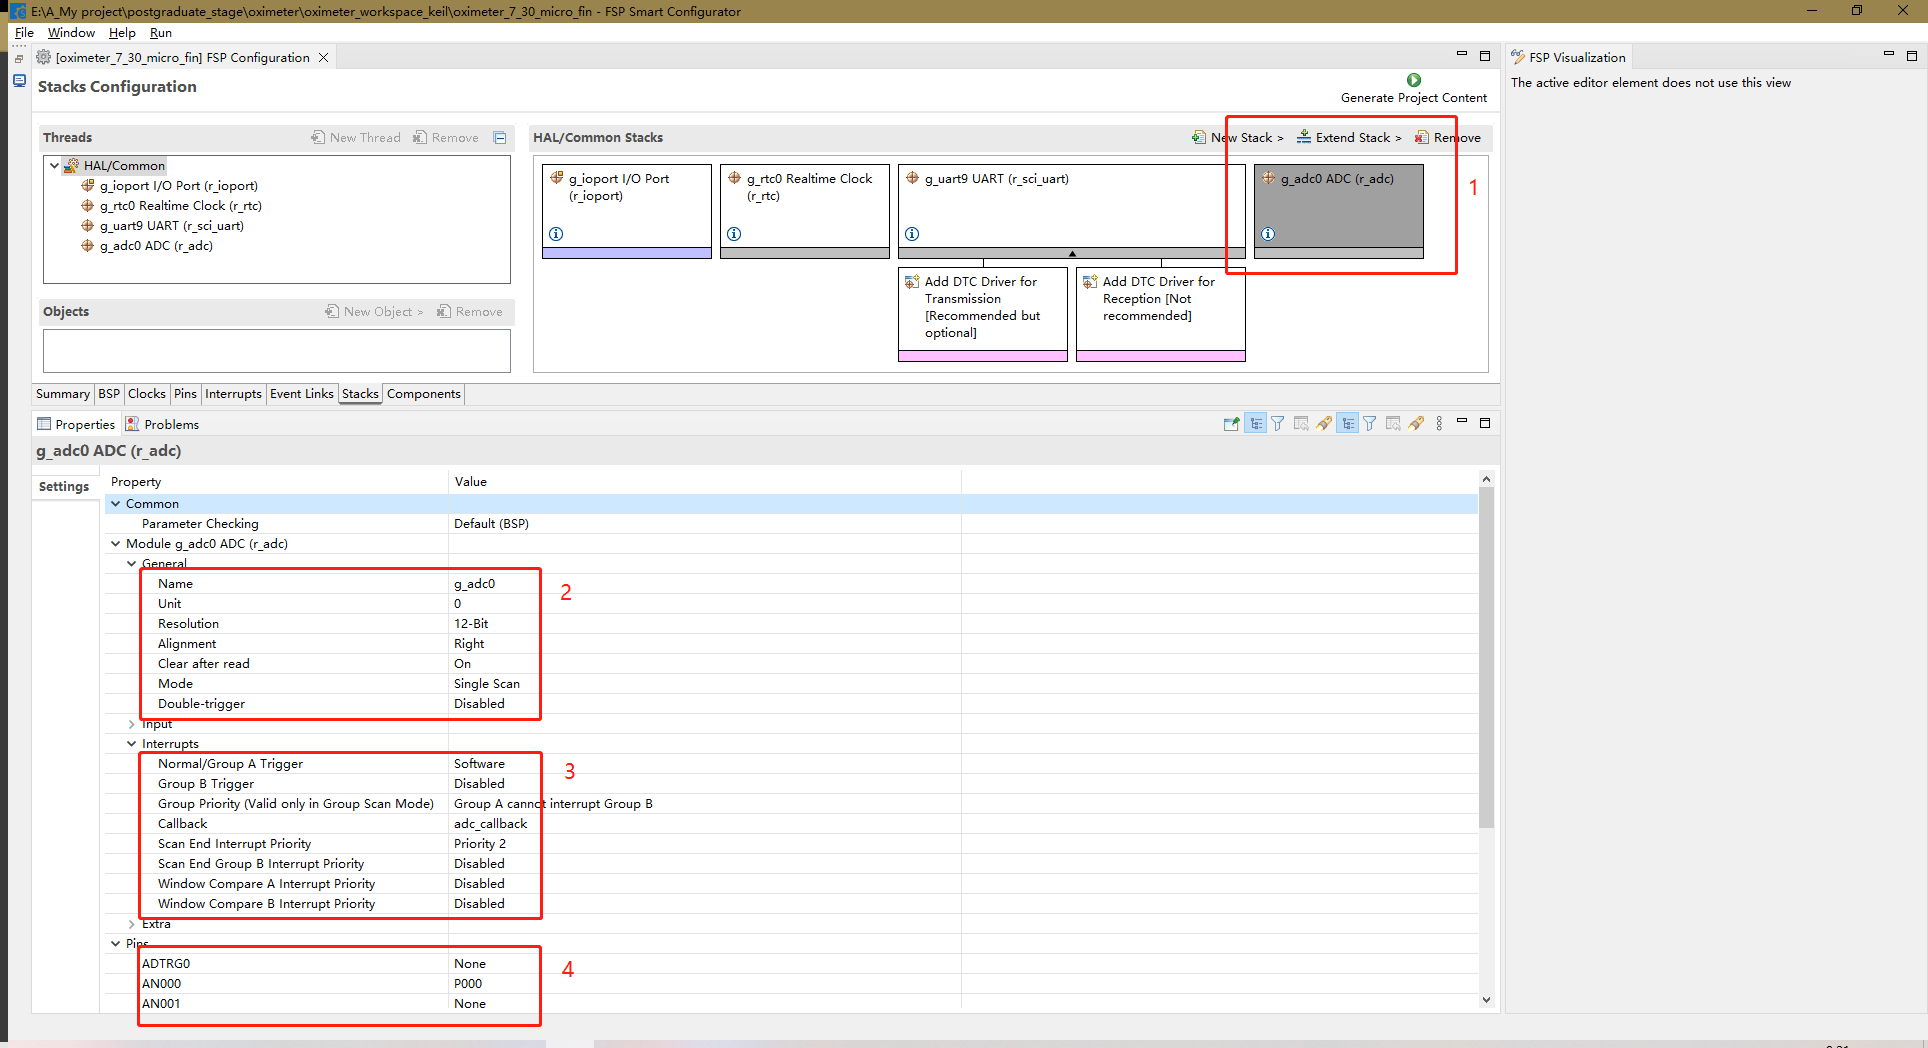
Figure 5-2 ADC_RASC Configuration Diagram.
Next is the RASC pin configuration for the chip. In this part, the pins related to IIC, SPI, ADC, LED, and buttons need to be configured. The IIC (Integrated Circuit) is used by the MAX30102. The IIC pins are software IIC, specifically pins P400 and P401, which are SCL and SDA respectively. These pins are configured as push-pull and open-drain outputs. SDA is configured as open-drain because data needs to be read while outputting. Besides the IIC pins, this section also includes an interrupt pin, INT, configured as a pull-up input. The SPI (Split SPI) is used for the screen. This section includes SPI pins and related screen pins, including chip select (CS-P015), reset (RES-P500), data/command control (DC-P100), data (SDA-P101), clock (SCL-P102), and backlight control (BLK-P103). Except for SDA, which is configured as an open-drain output, all others are configured as push-pull outputs. The LED pin is P001, configured as a push-pull output. The button pins are P914 and P013, both configured as pull-up inputs. The ADC pin configuration is different from the others, so it will be discussed later. There are many pins, so not all of them are shown in the diagram. Only one diagram is shown for each pin configuration type. Figure 5-3 below is the push-pull output configuration diagram, Figure 5-4 is the open-drain output configuration diagram, and Figure 5-5 is the pull-up input configuration diagram.

Figure 5-3 Push-pull output

Figure 5-4 Open-drain output
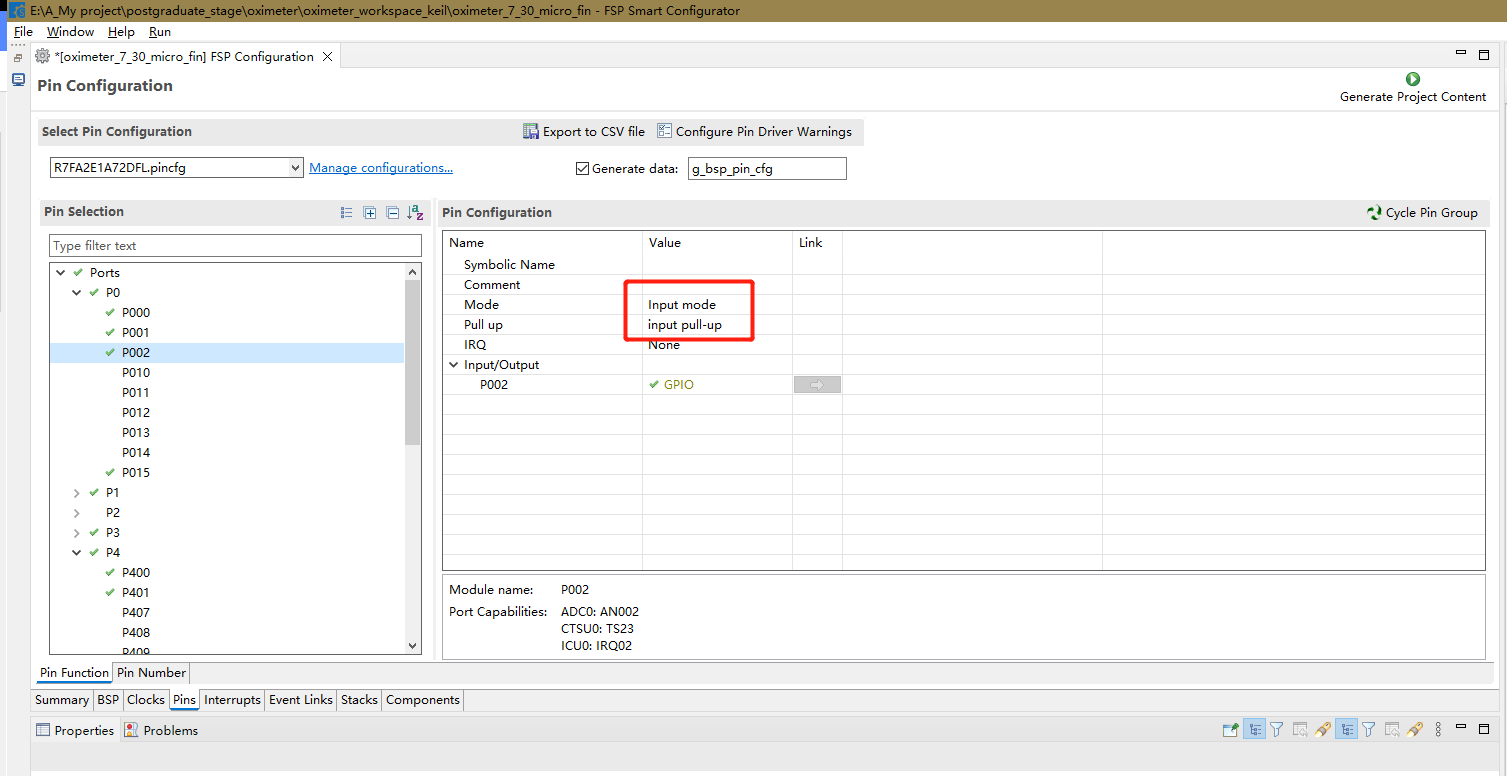
Figure 5-5 Pull-up input
ADC pin is P000, and the configuration diagram is shown in Figure 5-6 below.

Figure 5-6 ADC pin configuration diagram
The initialization configuration of RASC is now complete.
1.2 Keil logic program
1.2.1 Program description
The main flowchart of the Keil program is shown in Figure 5-7 below.

Figure 5-7 Main program flowchart
As can be seen from the main program flowchart, the program mainly consists of three functions: key scanning, sensor detection, and screen display, which are executed in a loop. The following is an explanation of the three functions.
First is the key scanning program. This program scans the key pins. When key 1 is pressed, it outputs 1; when key 2 is pressed, it outputs 2; when no key is pressed, it outputs 0. Continuous pressing is not supported. This function is based on the Zhengdian Atomic Keypad program, the link is as follows: Zhengdian Atomic Keypad Tutorial. The code is as follows:
//mode:0, does not support continuous pressing;1, supports continuous pressing;
//0, no key is pressed
//2, KEY1 is pressed
//3, KEY2 is pressed
//Note that this function has a response priority, KEY1>KEY2
uint8_t Key_Scan(uint8_t mode)
{
static uint8_t key_up=1;//Key release flag
if(mode)key_up=1; //Supports continuous pressing
if(key_up&&(KEY1_READ==0||KEY2_READ==0))
{
delay_ms(10);//Debouncing
key_up=0;
if(KEY1_READ==0)return 1;
else if(KEY2_READ==0)return 2;
}else if(KEY1_READ==1&&KEY2_READ==1)key_up=1;
return 0;//No key is pressed
}
The second is the sensor detection function, and the flowchart of this function is shown in Figure 5-8 below.
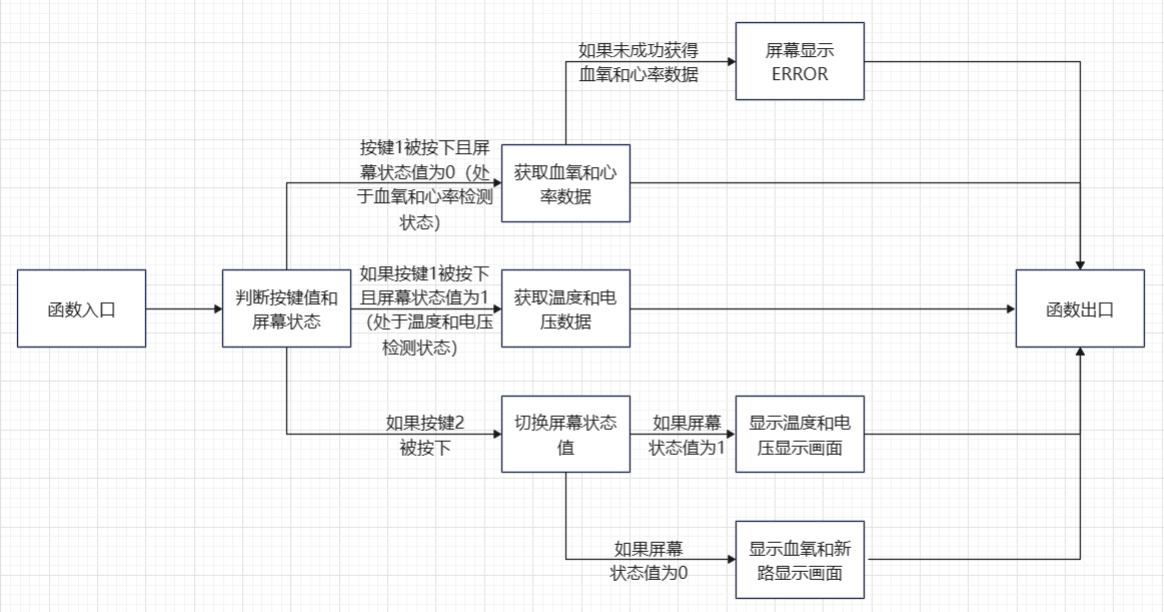
Figure 5-8 Flowchart of Sensor Detection Function.
As shown in the figure above, the main logic of this function is to perform a series of processes based on the key value and the screen status value. In summary, when key 1 is pressed, detection begins, but what is detected is determined by the screen status value. When it is the blood oxygen-heart rate status, heart rate and blood oxygen are detected; when it is the temperature-voltage status, temperature and voltage are detected. When key 2 is pressed, the screen status value is switched. The detection data is stored in a structure variable I defined, as follows:
`struct MAX30102{ uint32_t spo2_value; // Blood oxygen value uint32_t hr_value; // Heart rate value int8_t vaild_value; // Valid blood oxygen-heart rate detection value uint32_t n_ir_buffer_length; // Buffer length uint8_t temp_refresh_state; // Temperature detection refresh status float temp; // Temperature value float volt; // Voltage value };`
The sensor detection function code is as follows:
`void chedk_fuc(struct MAX30102 *max30102_data_ori, uint8_t key, uint8_t *lcd_state)
{
struct MAX30102 max30102_data = *max30102_data_ori;
if(key == 1 & *lcd_state == 0)` //When KEY1 is pressed and the LCD status is 0, blood oxygen and heart rate are detected
.
max30102_read_sp02_PR(&max30102_data);
if(max30102_data.vaild_value != 1)
{
LCD_Fill(0,22,LCD_W,LCD_H,BLACK);
LCD_ShowString(40,26,"error",RED,BLACK,32,0);
}
}
else if(key == 1 & *lcd_state == 1) //When KEY1 is pressed and LCD state is 1, check the voltage and temperature once
{
max30102_read_temp_volt(&max30102_data);
}
else if(key == 2) //When KEY2 is pressed, switch the display state
{
if(*lcd_state)
*lcd_state = 0;
else
*lcd_state =1;
LCD_Fill(0,0,LCD_W,LCD_H,BLACK); //Refresh the screen and display new content
if(*lcd_state)
{
LCD_ShowString(30,6,"temp",WHITE,BLACK,12,0);
LCD_ShowString(100,6,"volt",WHITE,BLACK,12,0);
LCD_ShowString(28,26,"--",WHITE,BLACK,32,0);
LCD_ShowString(100,26,"--",WHITE,BLACK,32,0);
max30102_read_temp_volt(&max30102_data);
}
else
{
LCD_ShowString(30,6,"%sp02",WHITE,BLACK,12,0);
LCD_ShowString(100,6,"PR bpm",WHITE,BLACK,12,0);
LCD_ShowString(28,26,"--",WHITE,BLACK,32,0);
LCD_ShowString(100,26,"--",WHITE,BLACK,32,0);
} The third function is the screen display function, whose flowchart is shown in Figure 5-9. Figure 5-9 Screen Display Function Flowchart.
As shown in the figure
, the main logic of this function is to perform a series of processes based on
the detected valid values and screen status values. In summary: when the valid value of the blood oxygen-heart rate detection is 1 and the screen status is blood oxygen-heart rate, the blood oxygen-heart rate data is displayed; when the valid value of the temperature-voltage detection is 1 and the screen status is temperature-voltage, the temperature-voltage data is displayed. Simultaneously, a counter is performed. After counting 5 times, the voltage status is checked. When the voltage value is greater than 4.35, a charging indicator "C" is displayed on the screen; otherwise, no status is displayed. Finally, all valid values are set to 0, making them invalid and preventing repeated display. The screen display function code is as follows: void LED_show_main(struct MAX30102 *max30102_data_ori, uint8_t lcd_state) { float volt; uint8_t count = 1; if(max30102_data_ori->valued_value && lcd_state == 0) { LCD_Fill(0,22,LCD_W,LCD_H,BLACK); LCD_ShowIntNum(29,26,max30102_data_ori->spo2_value,2,WHITE,BLACK,32); if(max30102_data_ori->hr_value { LCD_ShowIntNum(101,26,max30102_data_ori->hr_value,2,WHITE,BLACK,32); } else if(max30102_data_ori->hr_value >= 100) LCD_ShowIntNum(93,26,max30102_data_ori->hr_value,3,WHITE,BLACK,32); } if(max30102_data_ori->temp_refresh_state && lcd_state == 1) { LCD_Fill(0,22,LCD_W,LCD_H,BLACK); LCD_ShowFloatNum1(13,26,max30102_data_ori->temp,4,WHITE,BLACK,24); LCD_ShowFloatNum1(90,26,max30102_data_ori->volt,3,WHITE,BLACK,24); } if(count%5 == 1) //equivalent to loop 5 to check the charging status once { volt = 2 * Read_ADC_Voltage_Value(); if(volt > 4.35) LCD_ShowString(150,6,"C",GREEN,BLACK,12,0); else LCD_Fill(150,6,160,20, BLACK); count = 1; } count++;

`max30102_data_ori->valid_value = 0; // Prevent multiple screen refreshes
max30102_data_ori->temp_refresh_state = 0;
}`
1.2.2 Supplementary Explanation
Besides the above, there are a few other points to explain in this project's program.
First, regarding the MAX30102 processing algorithm, this project is based on the source code provided by a Taobao seller. This source code requires processing 500 data points per calculation, which cannot be met in this project, so it has been reduced to 100 data points. Reducing the data may affect the detection accuracy. Multiple detections can be performed, and mean filtering can be applied to improve detection accuracy. This function has been implemented in the code of this project. You can modify the `MAX_effective_detection_number` variable in the `max30102_read_sp02_PR` function in the `max30102.c` file. This variable represents the maximum number of effective detections. In the function, it means that as long as the number of successful detections reaches `MAX_effective_detection_number`, the detection is considered effective, and the data will be averaged according to `MAX_effective_detection_number` at the end. However, note that the `max30102_read_sp02_PR` function also contains the `MAX_detection_number` variable, which represents the maximum number of detections. `MAX_effective_detection_number` cannot exceed `MAX_detection_number`. The locations of these two variables are shown in Figure 5-10.

Figure 5-10: Mean filtering related code diagram
. Next is the proximity mode setting. Proximity mode refers to the mode that detects whether a finger is placed on the sensor. Enabling it can greatly reduce the false detection rate. Proximity mode essentially detects whether the value reflected back from the LED meets the condition of a finger being placed on the sensor. Based on this idea, we can set a threshold. When the average of 100 sampled values is greater than this value, it means the finger is normally placed on the sensor; when it is less than this value, it means there is an error and the data is invalid. This code is located in the `maxim_heart_rate_and_oxygen_saturation` function in the `algorithm.c` file. Figure 5-11 is the proximity mode program diagram.

Figure 5-11: Proximity mode related code
. This concludes the entire program development process.
2. Host Computer Debugging:
In order to test whether the MAX30102 has successfully detected the required PRG pulse wave signal, this project uses an anonymous host computer to display the data collected by the MAX30102 in the form of waveforms.
void AnoPTv8TxFrameF1_assistant(int32_t _ir, int32_t _red)
{
uint8_t i;
uint8_t sumcheck = 0;
uint8_t addcheck = 0;
uint8_t _cnt=0;
// Default is fine
databuf[_cnt++] = 0xAB;
databuf[_cnt++] = 0x01;
databuf[_cnt++] = 0xFE;
databuf[_cnt++] = 0xF1;
// Use these two bits to represent the number of bytes of data
databuf[_cnt++] = 8;
databuf[_cnt++] = 0;
databuf[_cnt++] = BYTE0(_ir);
databuf[_cnt++] = BYTE1(_ir);
databuf[_cnt++] = BYTE2(_ir);
databuf[_cnt++] = BYTE3(_ir);
databuf[_cnt++] = BYTE0(_red);
databuf[_cnt++] = BYTE1(_red);
databuf[_cnt++] = BYTE2(_red);
databuf[_cnt++] = BYTE3(_red);
for(i=0;i
{
sumcheck+=databuf[i];
addcheck+=sumcheck;
}
databuf[_cnt++]=sumcheck;
databuf[_cnt++]=addcheck;
R_SCI_UART_Write(&g_uart9_ctrl, databuf, _cnt);
while(uart_send_complete_flag == false);
uart_send_complete_flag = false; The
above
code is written based on the flexible format frames in the anonymous communication protocol, which can display the sent data as a waveform. It's important to note that the serial port data sending function at the end of this code cannot be changed to the printf function, because the printf function will change the format of the data sent, resulting in the serial port receiving end receiving data that is not what we want to send. Using the R_SCI_UART_Write function will send the data to the receiving end unchanged, ensuring normal communication. The anonymous communication protocol PDF file has been attached; you can download and view it if needed.
For information about the Anonymous Assistant software, please refer to the official Anonymous Assistant video, link below: Anonymous Assistant Host Computer Public Beta Version Introduction Video. Although it seems to have only been in public beta for a short time, this Anonymous Assistant is exceptionally easy to use.
That concludes the software section.
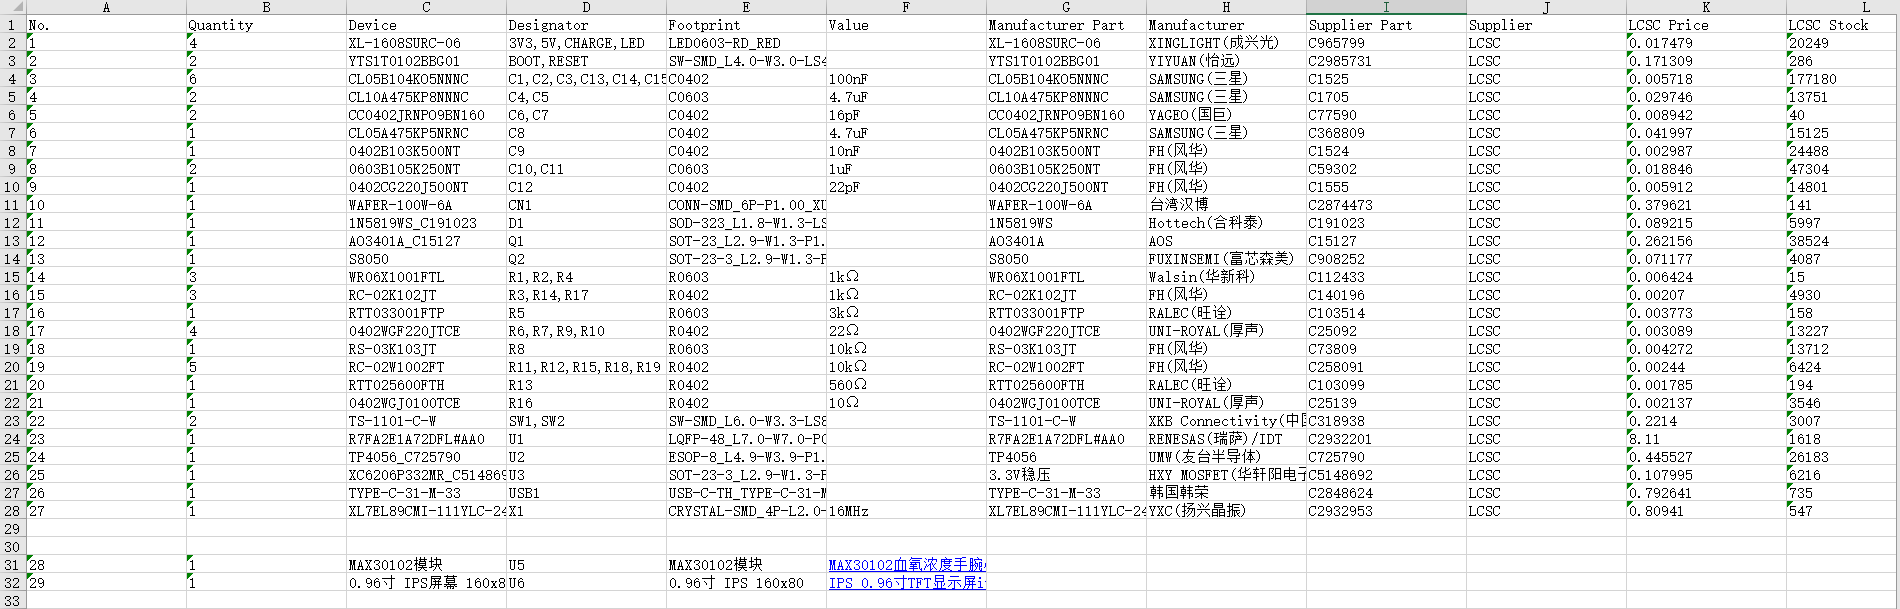
*6. BOM List
*7. Competition LOGO Verification

*8. Precautions
1. Since the MAX30102 module is used, the circuit is directly exposed, so please keep your hands dry and avoid short circuits during use.
2. Due to equipment limitations, the pulse oximeter in this project has not been experimentally calibrated and has poor accuracy. It is only suitable for testing or approximate detection and is not applicable to medical applications.
* 9. Attachment Description
1. BOM (Bill of Materials) (arranged by number)
2. Final Program
3. Anonymous Host Computer Test Program (The final program can also be debugged on a host computer, but this is not as convenient)
4. Anonymous Communication Protocol
5. A demonstration video of the overall function of the pulse oximeter
6. A test video of the pulse oximeter after exercise
7. A video of testing waveforms using Anonymous Assistant
*10. Reference
1. Reference Links
(1) MAX30102 High-sensitivity pulse oximeter and heart rate sensor for wearable health devices
(2) [LCSC Electronic Design Contest] Design of desktop electronic clock based on Renesas
(3) Keil electronic clock based on RASC
(4) [Wildfire] Practical guide to the development of Renesas RA series FSP library
(5) Tutorial on Zhengdian Atomic Keys
(6) Introduction video of the Anonymous Assistant host computer public beta version
BOM_PCB_2023-07-30.xlsx
oximeter_final.zip
oximeter_test_Ano.zip
Anonymous Communication Protocol.pdf
LCSC Electronics Design Contest: Pulse Oximeter - Overall Function Demonstration.mp4
LCSC Electronics Contest: "Pulse Oximeter" - Measuring Blood Oxygen and Heart Rate After Exercise.mp4
LCSC Electronics Contest: "Pulse Oximeter" - Anonymous Host Computer Demo.mp4
PDF_#8th LCSC Electronics Design Contest# Pulse Oximeter Design Based on R7FA2E1 Chip.zip
Altium_#8th LCSC Electronics Design Contest# Pulse Oximeter Design Based on R7FA2E1 Chip.zip
PADS_#8th LCSC Electronics Design Contest# Pulse Oximeter Design Based on R7FA2E1 Chip.zip
BOM_#8th LCSC Electronics Design Contest# Pulse Oximeter Design Based on R7FA2E1 Chip.xlsx
91093
electronic


 京公网安备 11010802033920号

 05801834