1. Introduction
As electronics enthusiasts, we all use multimeters to measure overvoltage and current to determine if a circuit is working properly. But have you ever wondered what the underlying principles of voltage and current measurement are? Can you make your own voltage and current meter? This open-source project will guide you step-by-step from hardware design principles to software code, from database setup to data visualization, to build a multi-functional IoT voltage and current meter based on the LCSC Diwenxing (CW32F030C8T6).
First, here are some pictures of the actual product. You can further improve and optimize the PCB layout and software design based on this project.
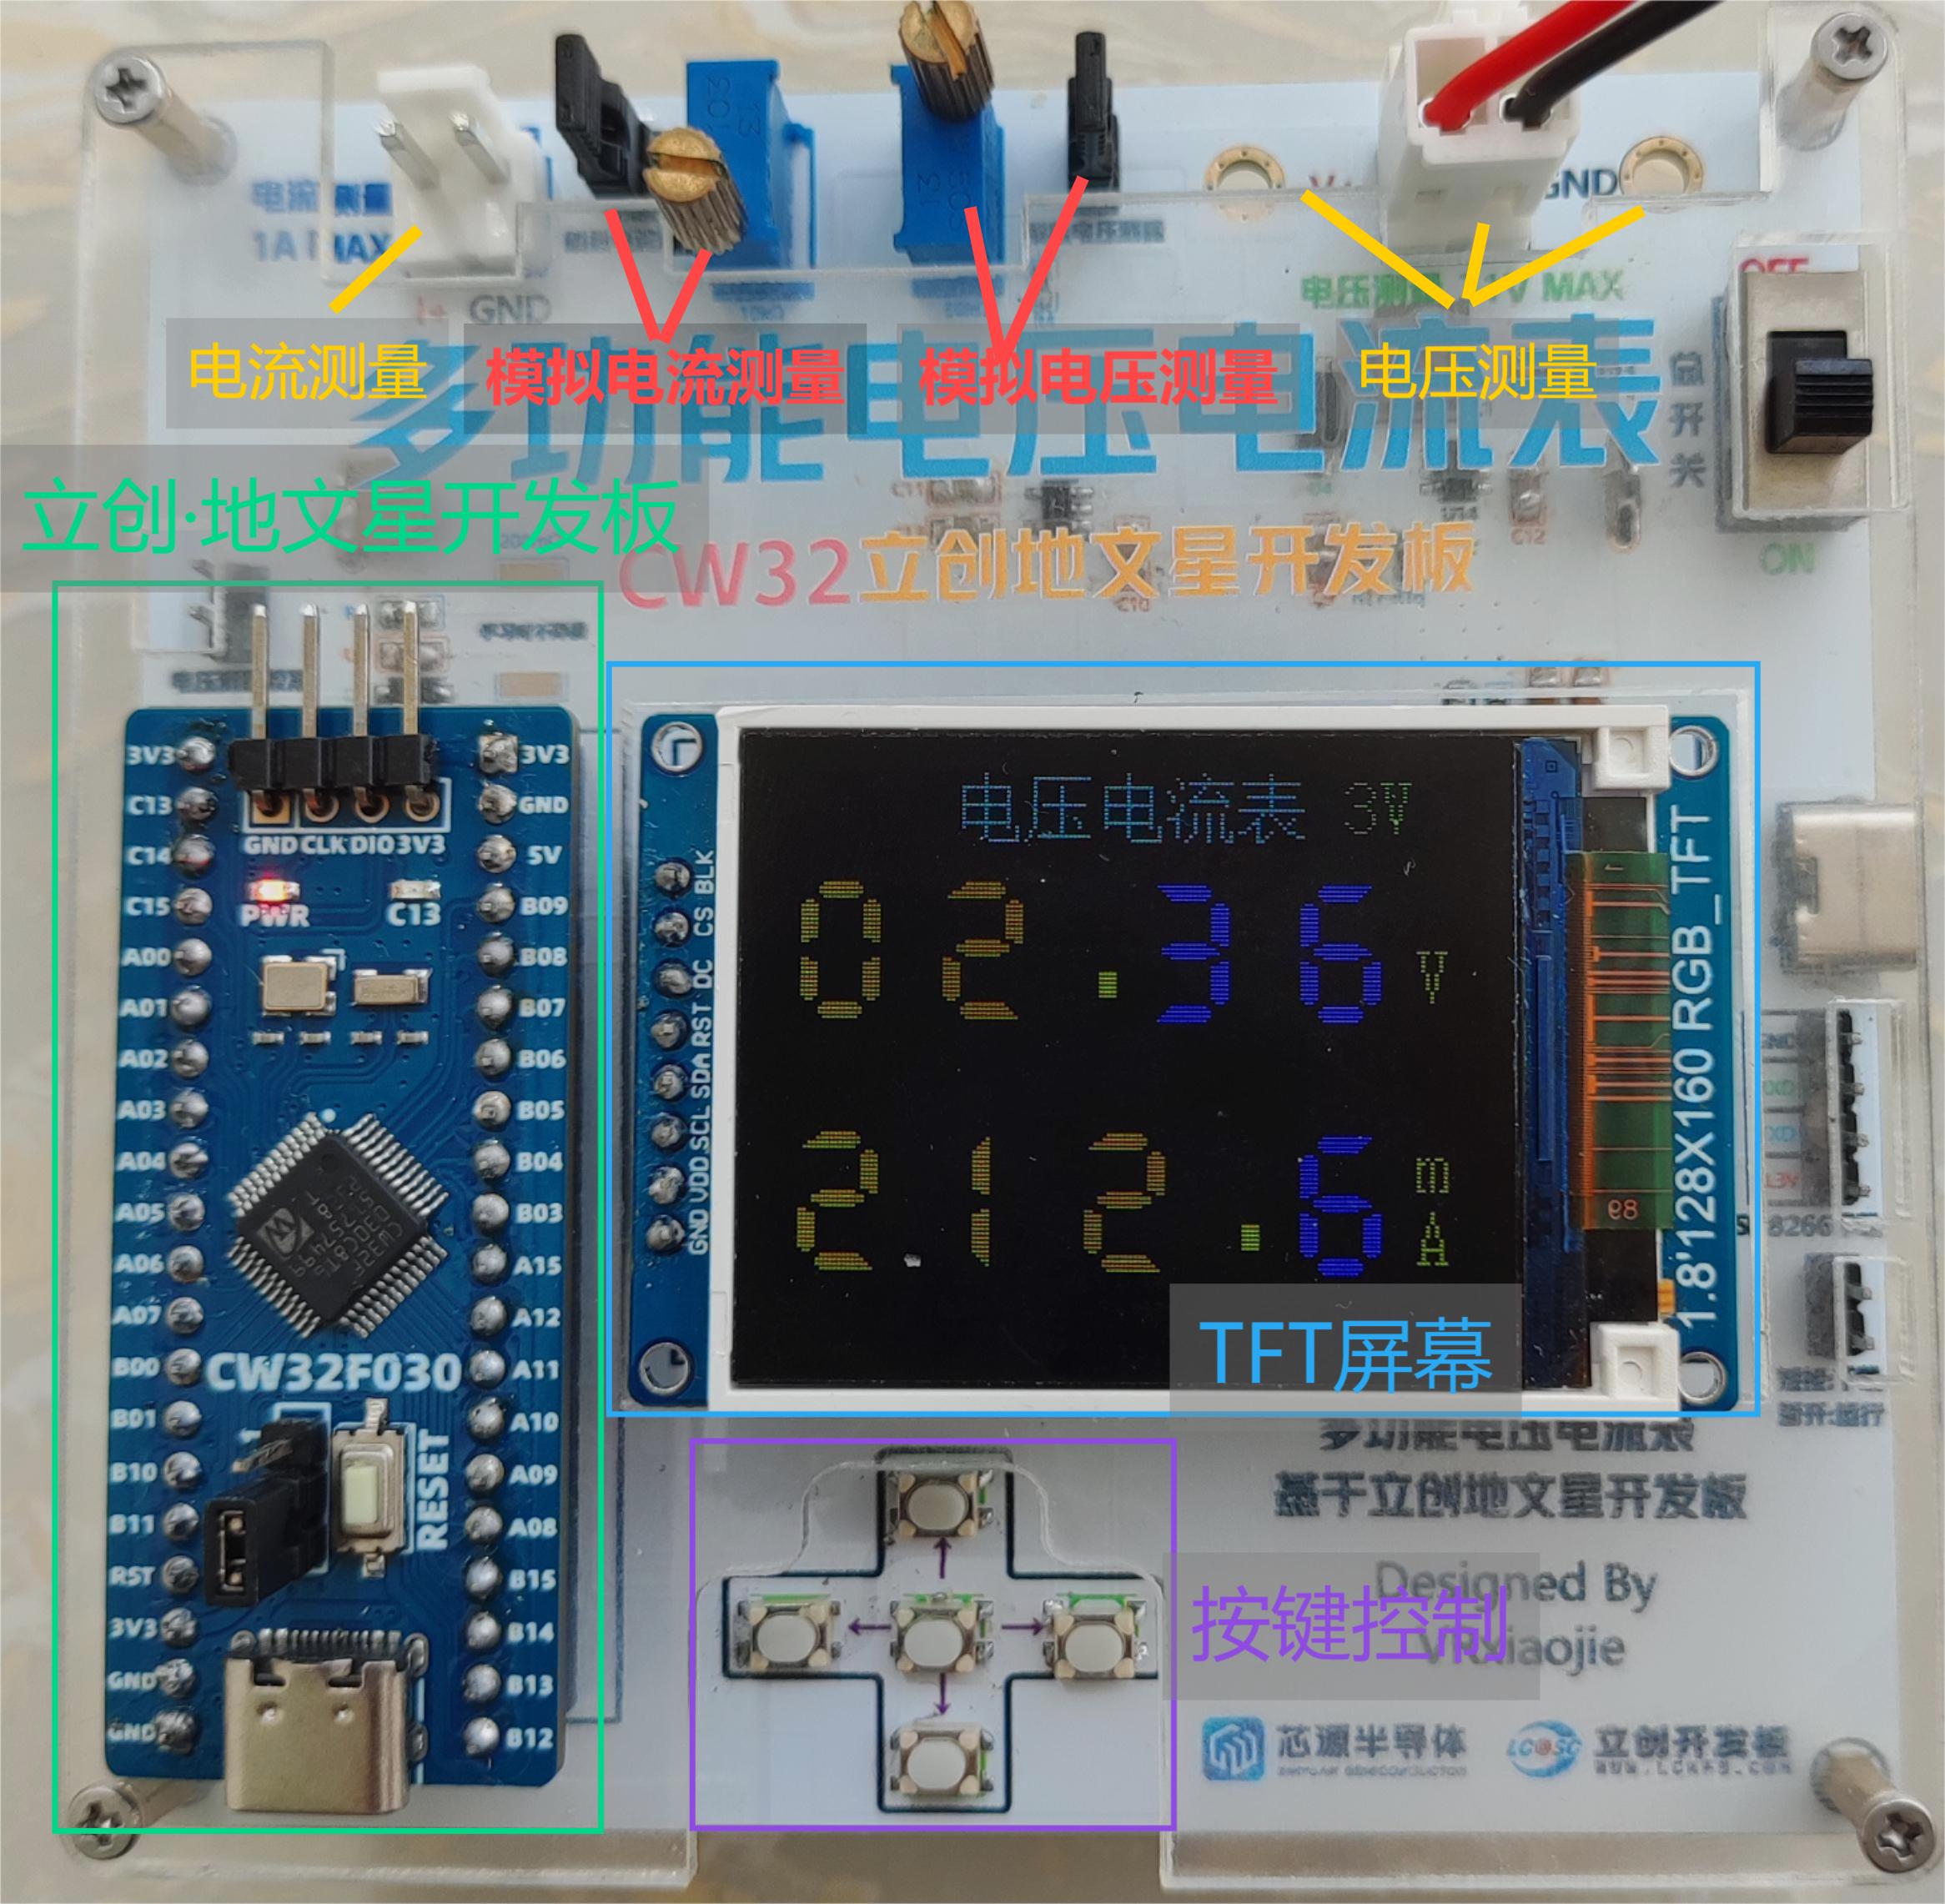
Figure 1 Front of the actual product

Figure 2 Back of the actual product
2. Hardware Design and Principles
2.1 Power Supply Circuit
The power supply topology diagram is shown in Figure 3.
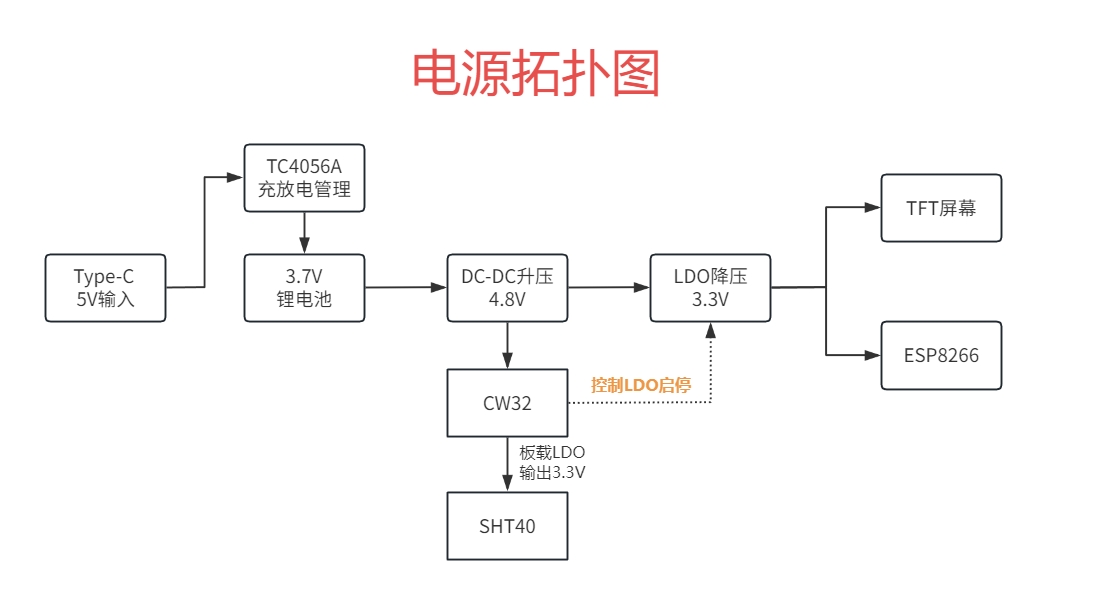
Figure 3 Power Supply Topology Diagram
The power supply section uses one 18650 lithium battery, and the charging management chip is TC4056A, which can support a maximum charging current of 1A. The circuit design is shown in Figure 4.

Figure 4 The charging management circuit
is shown in Figure 5. The DC-DC boost circuit uses the MT3608B, which has an efficiency of approximately 92% when the current is less than 100mA. The output voltage uses a resistor divider feedback method: VOUT = (1 + R2/R1) * VREF. The datasheet states VREF = 0.6V; I chose R2 = 91KΩ and R1 = 13KΩ, resulting in VOUT = 4.8V. Larger resistors are preferable here, as they draw less current and consume less power. The 4.7uH inductor is based on the chip datasheet; it's recommended to choose an inductor with a lower equivalent DC resistance to improve efficiency. A Schottky diode is essential; considering the low overall current, an SS14 is sufficient.
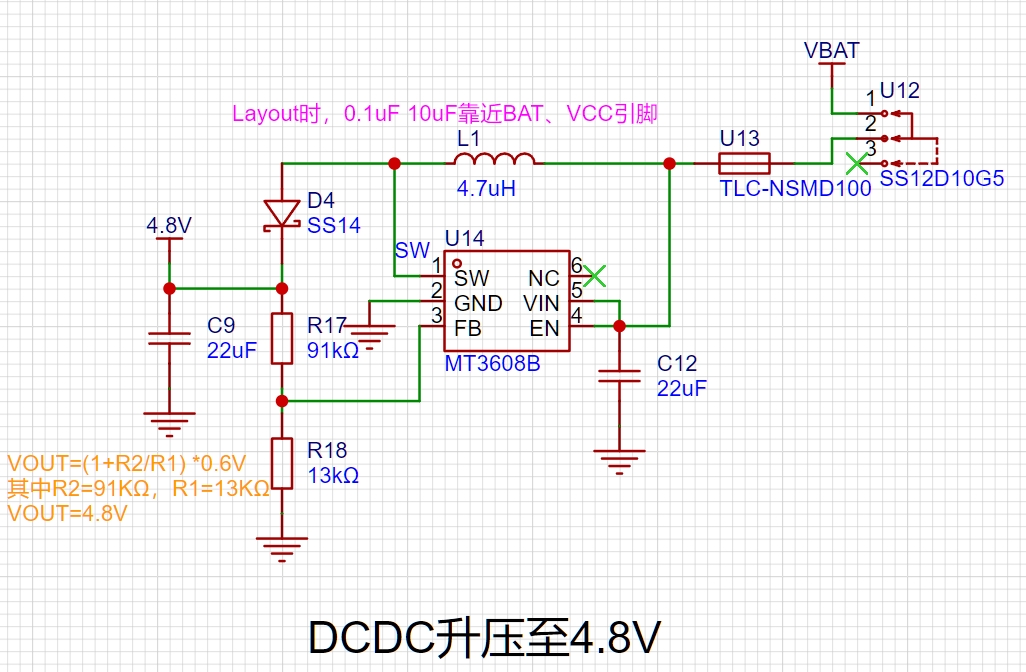
Figure 5
DC-DC Boost Circuit
The LDO used to step down to 3.3V is the RS3236-3.3. It was chosen because it has an EN pin, allowing the CW32's GPIO to control the LDO's start and stop. Furthermore, it has extremely low standby current (0.01uA), further reducing the overall system's quiescent current. The LDO circuit design is shown in Figure 6.

Figure 6 LDO Step-Down Circuit
2.2 MCU Selection – Why Choose CW32
for Voltage and Current Measurement? The core of this project is voltage data acquisition, and since voltage values are analog, an ADC (Analog-to-Digital Converter) is needed to convert them into digital values that the program can read. The LCSC Diwenxing development board uses the CW32F030C8T6, a high-speed ADC with 12-bit precision and multiple Vref reference voltages: 1.5V, 2.5V, VDD, and ExRef (PB00) pin voltages. The STM32, however, only has one VDD reference voltage. Considering accuracy, having more selectable Vrefs is naturally better. The CW32 user manual's introduction to the ADC is shown in Figure 7.

Figure 7 CW32 Datasheet Introduction to ADC
Furthermore, considering that this project uses a TFT screen, ESP8266, button control, and ADC acquisition, requiring a large number of I/O ports, the Diwenxing development board provides 32 I/O pins, which is sufficient.
2.3 ADC Circuit
ADC stands for Analog-to-Digital The abbreviation for Converter refers to an analog-to-digital converter, a device that converts continuous analog signals into discrete digital signals.
The pin functions of an ADC are described in the table below:
Port - ADC Channel
Function
PBA7 - ADC_IN7
Battery Voltage Measurement
PB00 - ADC_IN8
Voltage Measurement Calibration
PB01 - ADC_IN9
Voltage Measurement 0~3V
PB10 - ADC_IN11 Voltage Measurement 0~
31V
PB11 - ADC_IN12
Current Measurement 0~1A
2.3.1 Voltage Sampling Circuit The voltage
sampling circuit design is shown in Figure 8, with Vref set to the built-in 1.5V voltage.
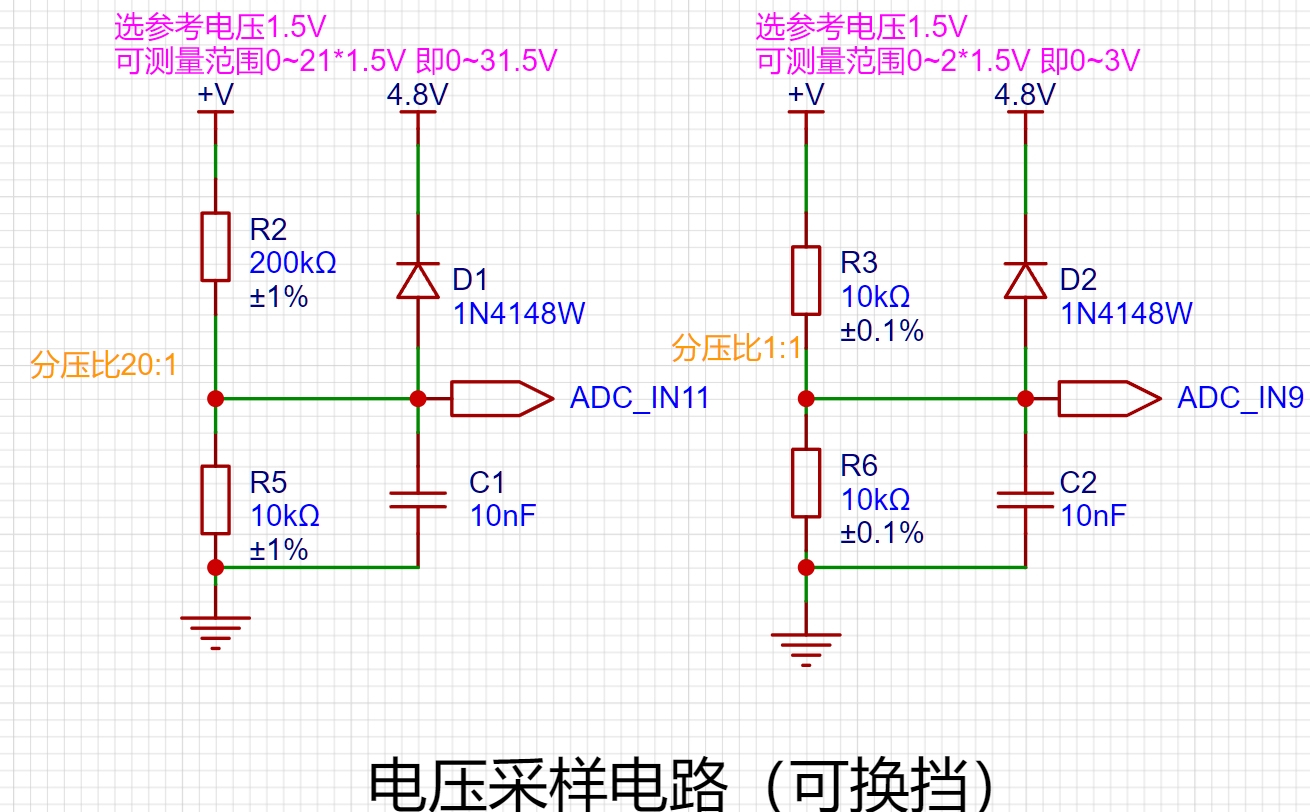
Figure 8 Voltage Sampling Circuit
For the large range, a 200k and 10k resistor voltage divider is used to sample the voltage value across the 10k resistor. The maximum range is calculated as follows:
$$
U_{adc11max}= frac {1.5}{frac{10k}{10k+200k}}=31.5V
ag {1}
$$
Take the integer 31V. When the voltage is 31V, calculate the power across resistors R2 and R5:
$$
P_{R5max}= frac{(31 imes frac{10k}{10k+200k}) ^{2}}{10k}approx 0.218mW
ag {2}
$$
$$
P_{R2max}= frac{(31 imes frac{200k}{10k+200k}) ^{2}}{200k}approx 4.36mW
ag {3}
$$
Therefore, 0603 packages (100mW) are more than sufficient for R2 and R5. Choose the surface mount resistor package according to the components you have on hand.
For the small range, two 10kΩ ±0.1% resistors are used for voltage division. The maximum range calculation method is the same as formula (1). Similarly, the range can be calculated to be 0~3V.
The automatic range switching function was later implemented in the software, achieving high-precision measurement of small voltages and high accuracy even after calibration for large voltages.
2.3.2 Current Sampling Circuit
From
$$
Is = frac{V{REF}}{4096} imes frac{1}{R{sa}} ag{4}
$$
, it can be seen that when the reference voltage $V{REF}$ is constant, the larger the sampling resistor $R_{sa}$, the smaller the corresponding $I_s$. Because I frequently measure milliampere-level currents, I naturally want the current corresponding to a unit ADC value to be as small as possible. Therefore, a 200mΩ resistor in a 2512 package with a power rating of 2W was selected.
$$
I{Rmax} = sqrt{frac{P{max}}{R_{sa}}} = sqrt{frac{2}{0.2}}approx 3.16A
ag{5}
$$
From equation (5), we know that the maximum current that the 200mΩ resistor can collect is 3.16A, which is greater than the designed collection current of 1A. At this time, the current corresponding to the unit ADC value is
$$
I_s = frac{1.5V}{4096} imes frac{1}{0.2Ω} approx 1.83mA ag{6}
$$
which meets the design requirements.
The current sampling circuit design is shown in Figure 9.
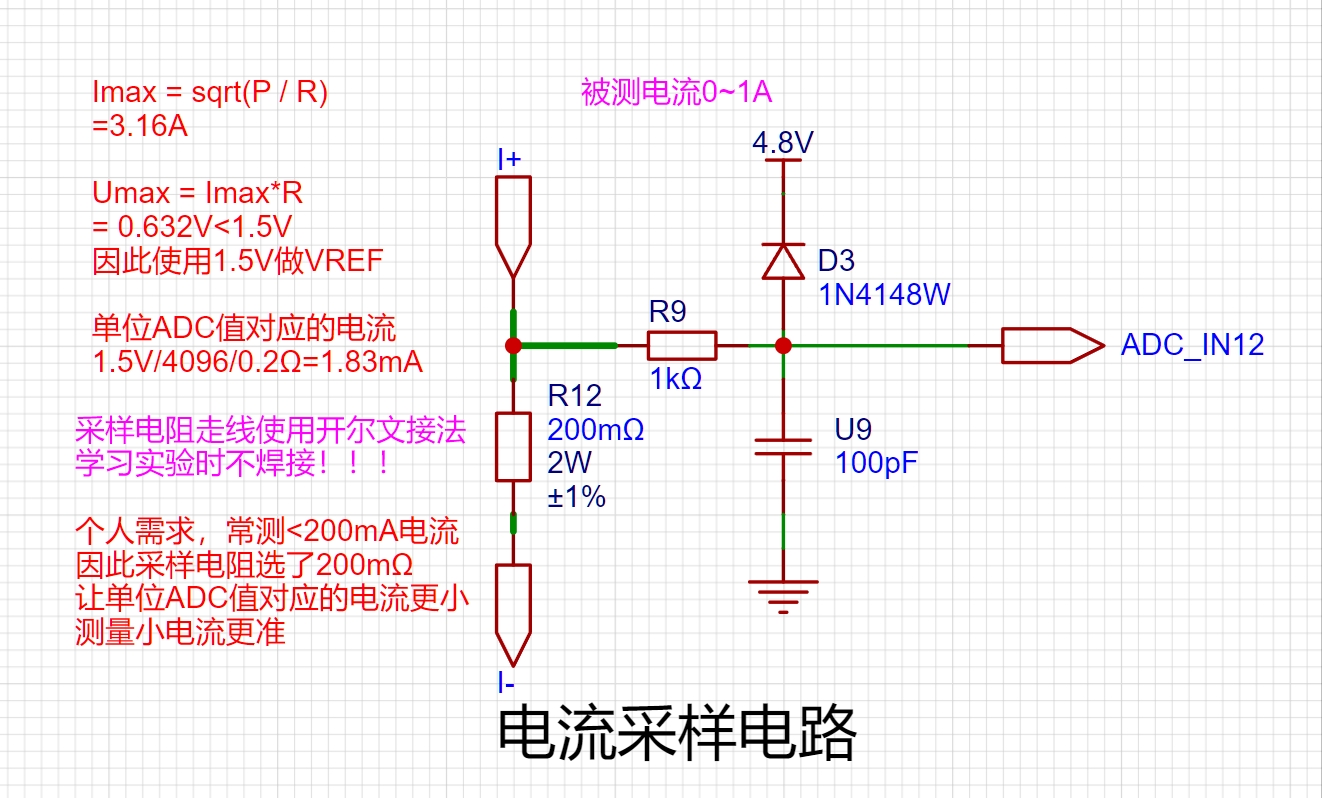
Figure 9 Current Sampling Circuit
2.3.3 Battery Voltage Sampling
The battery voltage sampling circuit design is shown in Figure 10. Two 10KΩ ±0.1% resistors are used for voltage division. The internal reference voltage is selected as 2.5V.
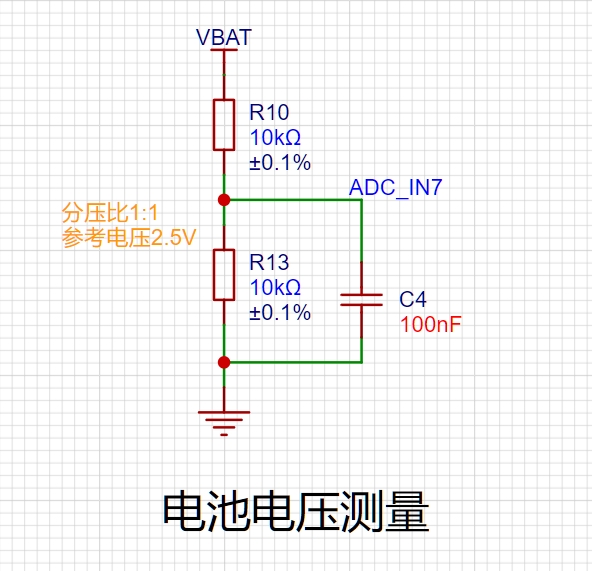
Figure 10 Battery Voltage Measurement Circuit
2.3.4 TL431 Voltage Calibration Circuit (Optional)
A TL431 voltage calibration circuit was also used in this project to provide a 2.5V reference voltage. Although the CW32 has a built-in 2.5V voltage reference, theoretically eliminating the need for an external reference, the TL431 can be used to study the application principles of voltage reference chips.
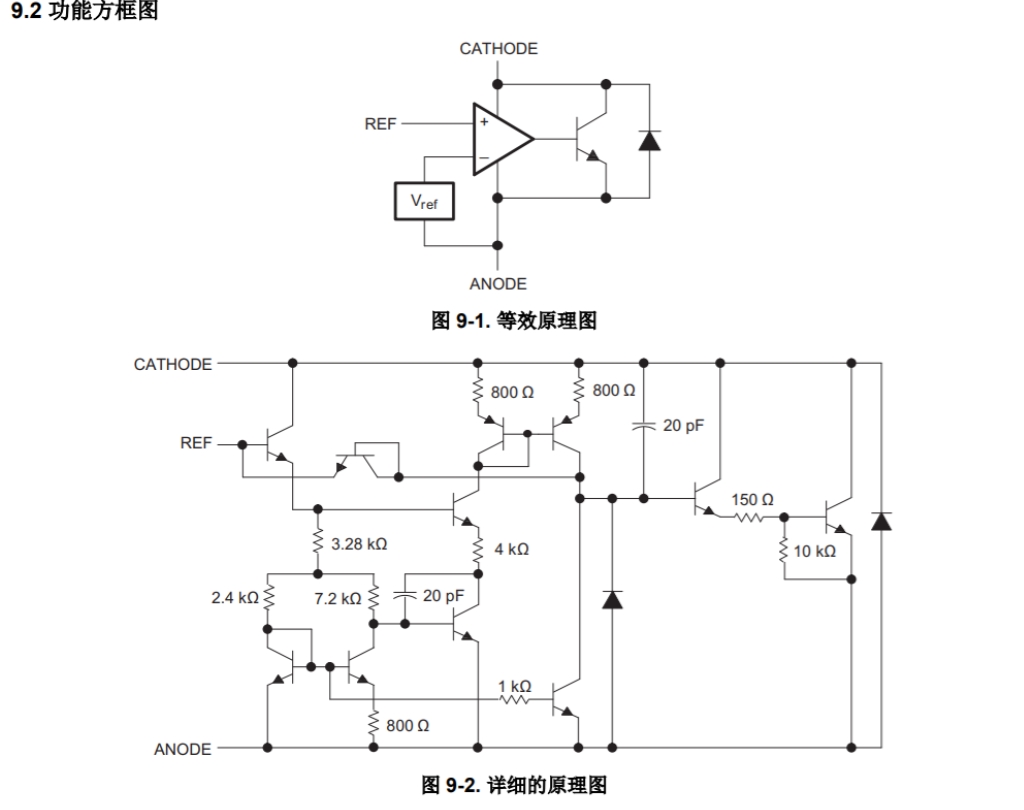
Figure 11
The TL431 schematic
is shown in Figure 11. The core of the TL431 is an operational amplifier (op-amp), which acts as a comparator in the circuit. Internally, the chip has a voltage Vref (approximately 2.5V), which acts on the inverting input of the comparator. A voltage is input to REF at the non-inverting input of the comparator. When this voltage is greater than Vref, the comparator outputs a high level, enabling the transistor and connecting the CATHODE (cathode) and ANODE (anode) terminals. If REF and CATHODE are at the same potential (connected together), the potential at REF is pulled low. When the potential at REF is pulled down below Vref, the comparator outputs a low level, the transistor turns off, and the potential at REF rises back up. When it is higher than Vref, the above process continues, and so on. Because the hardware response speed is extremely fast, the voltage at REF is almost equal to Vref.
The TL431 circuit design is shown in Figure 12.
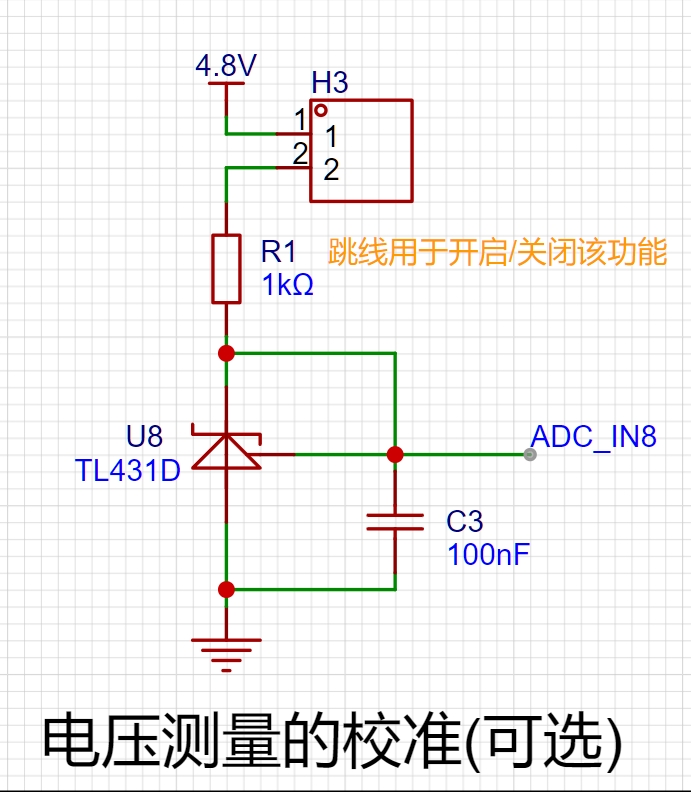
Figure 12 Voltage Calibration Circuit
2.4 The CW32's internal I/O ports
can be configured with pull-up and pull-down resistors, but this is not necessary for the external button control circuit. One end of the button is connected to the MCU's I/O, and the other end is grounded. When the button is pressed, the I/O is pulled low. The falling edge needs to be detected and an interrupt triggered during code writing; the code will be explained in the software design section (Section 3). The button circuit design is shown in Figure 13.
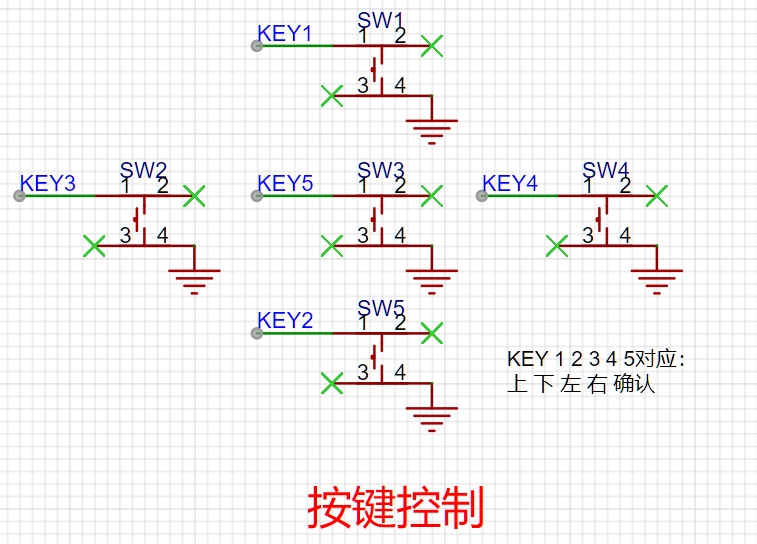
Figure 13 Button Control Circuit
The button operation logic corresponding to each I/O port is shown in the table below.
I/O Port
Operation Logic
PA12
Up
PA8
Down
PA9
Left
PA11
Right
PA10
OK
2.5
Since this project uses an "Internet of Things" voltmeter and ammeter, it must connect to the network via Wi-Fi to upload data. Therefore, Espressif's ESP8266 was used. Its core is the ESP-12F+ with a matching adapter board, which costs about 6 RMB on Taobao. The adapter board is used for easy plugging and unplugging and reuse, as shown in Figure 14. Additionally
, if you, like me, want to use a CW32 to control the ESP8266's start and stop, you need to remove a 10K resistor from the adapter board; its location is shown in Figure 14.

Figure 14 ESP8266 Module and Adapter Board
The ESP8266 circuit design is shown in Figure 15. The 8266's serial port is connected to PB8 and PB9 of the CW32, and a header pin is brought out as an external programming interface. Furthermore, GPIO0 can be grounded via a jumper cap to switch between download and debug modes without external wiring.
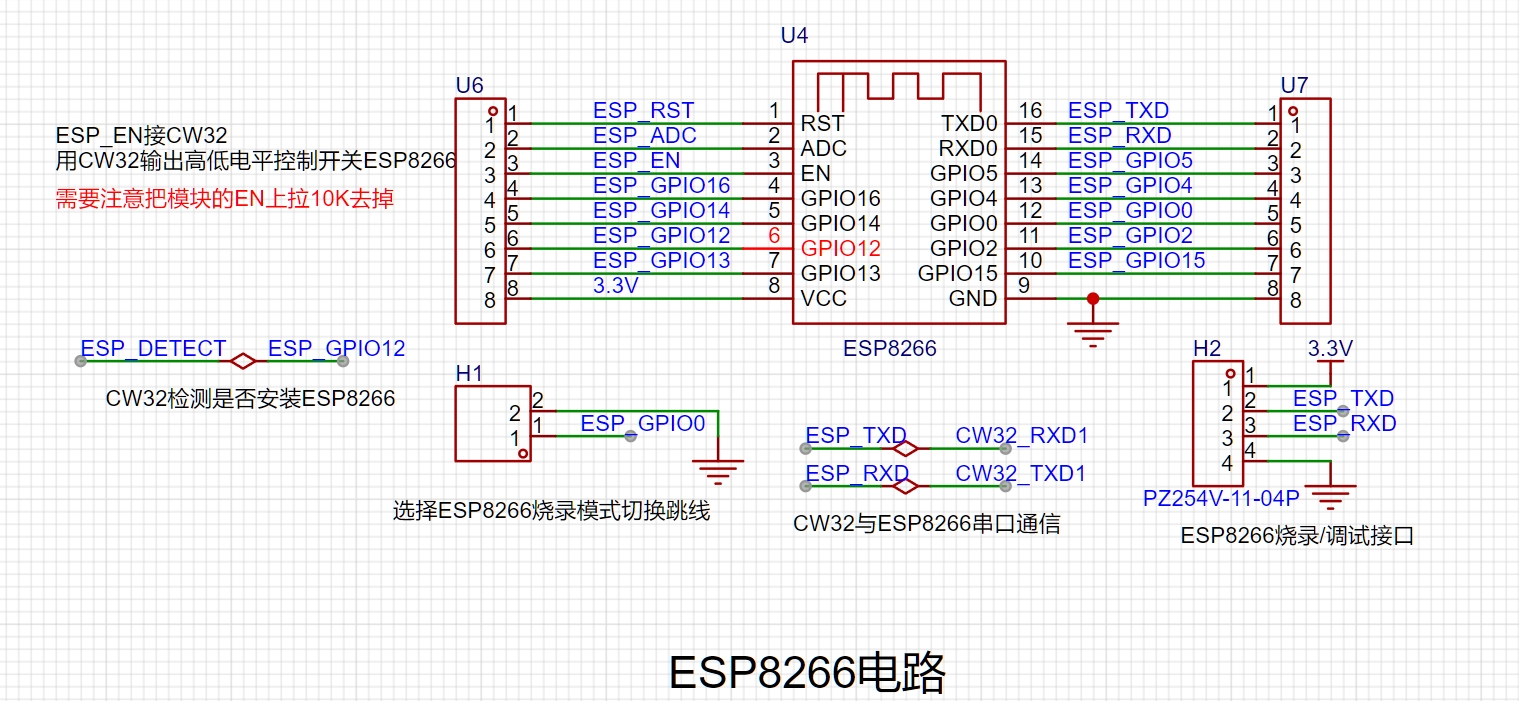
Figure 15 ESP8266 Circuit Design
2.6 The TFT screen
used in this project is a 1.8-inch color screen with a resolution of 128*160, driven by an ST7735. It uses SPI communication, and the pin definitions and functions are shown in the table below:
|Pin|Function|
|:--:|:--:|
|SCL |SPI clock, corresponding to the host computer's SCK SPI|
|SDA |SPI data input, corresponding to the host computer's MOSI SPI|
|RES |Reset, active low, high during operation|
|DC |Command mode and data mode switch bit, low for command mode, high for data mode|
|CS |Chip select signal, corresponding to the host computer's CS SPI|
|BL |Backlight, high for on, low for off, PWM dimming available|
Figure 16 shows the appearance of the TFT screen. Please confirm with the vendor whether it uses an ST7735 driver; otherwise, you will need to adapt the code yourself.
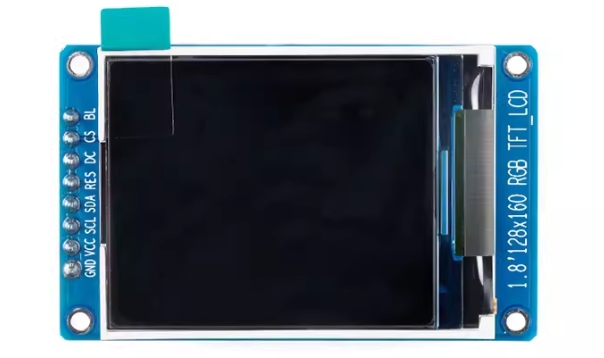
Figure 16 TFT Screen Appearance
2.7 SHT40 Temperature and Humidity Acquisition (Optional):
Based on the idea of "multi-functionality," this project can optionally add a temperature and humidity sensor to monitor temperature and humidity through the screen and send this data to a cloud database.
The SHT40 principle and code implementation can be found in my previous open-source project: Desktop Low-Power Rechargeable Thermometer and Hygrometer Based on STM32 and SHT40, which will not be elaborated here.
3 Software Design
3.1 Introduction
OK, finally we come to the software code section. More than 95% of the core implementation code here was written by myself, and this is also the first time I've created an operation menu, the logic of which is quite complex. Writing the project code took nearly 7 days.The program API documentation can be viewed online: The main parts
of the CW32-based voltmeter and ammeter DOC code include menu design , TFT screen display of images and text, ESP8266 WIFI and MQTT settings, voltmeter and ammeter implementation , SHT40 temperature and humidity acquisition and display system settings, ADC, timer, and button control. Due to space limitations in the open-source project documentation, a comprehensive explanation is not possible. If you are interested in the software implementation, you can download the project files in the attachment. I have written explanations for almost every function, and some important statements are also commented. If you have any questions or suggestions for code improvement, please leave a message in the comments section.
3.2 Menu Design
The menu logic adopts a two-level menu. The main menu is used to select functions, such as connecting to WIFI, voltage and current meters, etc., and is placed on the left side of the screen; while the secondary menu is used to select branches under the main function and is placed on the right side of the screen. The menu hierarchy diagram is shown in Figure 17.

Figure 17 Menu Hierarchy Diagram
Menu-related functions are all placed in the menu.c source file. The Show_Status_Bar function is used to display the current battery level, WIFI connection status, ESP8266 connection status, and MQTT connection status. The core is to call the TFT screen drawing function showimage_16, which can be viewed in the GUI.c source file. The drawn image is obtained by an image modeling tool, and the converted hexadecimal array is placed in the Picture.c file.
void Show_Status_Bar()
{
//Leftmost position displays battery level
uint16_t bat_volume = Battery_Volume();
if(bat_volume>=61 && bat_volume<=100)
{
Gui_DrawFont_Num16(0,0,GREEN,BLACK,bat_volume/10);
Gui_DrawFont_Num16(8,0,GREEN,BLACK,bat_volume%10);
}
else if(bat_volume>=21 && bat_volume<=60)
{
Gui_DrawFont_Num16(0,0,YELLOW,BLACK,bat_volume/10);
Gui_DrawFont_Num16(8,0,YELLOW,BLACK,bat_volume%10);
}
else if(bat_volume>0&& bat_volume<=20)
{
Gui_DrawFont_Num16(0,0,RED,BLACK,bat_volume/10);
Gui_DrawFont_Num16(8,0,RED,BLACK,bat_volume%10);
}
Gui_DrawFont_GBK16(16,0,WHITE,BLACK,"%");
// The first one from the right displays the WIFI status
switch(WIFI_Status)
{
case 0:
showimage_16(WIFI_Disconnected_Icon,144,0);
mqtt_status = 0;
break;
case 1:
showimage_16(WIFI_Connected_Icon,144,0);
break;
}
// The second one from the right displays the ESP8266 connection status
switch(ESP8266_Status)
{
case 0 :
showimage_16(ESP8266_ERROR,124,0);
break;
case 1 :
showimage_16(ESP8266_OK,124,0);
break;
}
// The third one from the right displays the MQTT connection status
switch(mqtt_status)
{
case 0:
showimage_16(Mqtt_Error_Icon,104,0);
break;
case 1:
showimage_16(Mqtt_OK_Icon,104,0);
break;
}
}
The functions for displaying the main menu and sub-menu are Show_Main_Menu and Show_Sub_Menu, respectively. The names of the buttons are stored in the arrays char* main_menu_button[] and char* sub_menu_button[5][5] in advance, so that the button name at a certain position can be drawn according to the index value of the menu.
void Show_Main_Menu()
{
//Draw the dividing line
Gui_DrawLine(0,20,160,20,GREEN);
Gui_DrawLine(80,20,80,128,GREEN);
//Display the status bar
Show_Status_Bar();
//Render the main menu
for(uint8_t i = 0; i<5; i++)
{
uint8_t x = 0,y = 22+i*20;
Gui_DrawFont_GBK16(x,y,WHITE,BLACK,main_menu_button[i]);
}
Choose_Main_Function(); // Highlight the selected main menu
Show_Sub_Menu(); // Simultaneously display the current sub-menu
if(in_sub_menu_flag == 1) // If it's a sub-menu, highlight the selected sub-menu function.
Choose_Sub_Function();
}
void Show_Sub_Menu()
{
Lcd_Part_Clear(81,22,160,128,BLACK);
for(uint8_t i = 0; i<=sub_menu_maxidx[main_menu_index]; i++)
{
uint8_t x = 81,y = 22+i*20;
Gui_DrawFont_GBK16(x,y,WHITE,BLACK,sub_menu_button[main_menu_index][i]);
}
}
After having the overall framework, we need to delve into the details. How do we display the currently selected button after clicking the up, down, left, and right arrow keys? This uses the following four functions, which are used to draw the selected and unselected states of the main and sub-menu buttons.
/* Sub-menu button selected */
void Choose_Sub_Function()
{
uint8_t x = 81,y=40;
Gui_DrawLine(x,y+sub_menu_index*20,x+75,y+sub_menu_index*20,ORANGE);
}
/* Main menu button selected */
void Choose_Main_Function()
{
uint8_t x = 0,y=40;
Gui_DrawLine(x,y+main_menu_index*20,x+75,y+main_menu_index*20,LIGHTBLUE);
}
// Sub-menu button restored from selected to unselected state
void Restore_Sub_Menu_Button(uint8_t idx)
{
uint8_t x = 81,y = 40;
Gui_DrawLine(x,y+idx*20,x+75,y+idx*20,BLACK);
}
//Main menu is restored from selected state to unselected state
void Restore_Main_Menu_Button(uint8_t idx)
{
uint8_t x = 0,y = 40;
Gui_DrawLine(x,y+idx*20,x+75,y+idx*20,BLACK);
}
Up to this point, it seems that one thing is still missing, which is to execute the function corresponding to the button, that is, after pressing the "OK" button, enter the interface where the function is located. The function used is Run_Function. All functions are also stored in a two-dimensional array pointing to the function address void (*FUN[5][5])(), and when calling, you only need to pass the corresponding index value.
/*Array storing each running function*/
void (*FUN[5][5])() = {
{Launch_VA_Meter,Launch_VA_Meter},//Voltage and Current
{SHT40_Show_Temp_Humid},//Thermohygrometer
{Connect_WIFI,Network_info},//WIFI
{MQTT_Setup},//MQTT
{System_Info,ESP8266_Reset,MCU_Sleep,Brightness_Setup}};//System Settings
void Run_Function()
{
in_progress_flag = 1;
Lcd_Clear(BLACK);
if(main_menu_index==0) //Separate settings for voltage and current meter menus, used for parameter passing
{
FUN[main_menu_index][sub_menu_index](sub_menu_index);
}
else
{
FUN[main_menu_index][sub_menu_index]();
}
}
3.3
The functions related to WIFI and MQTT connections are located in the `esp8266_cmd.c` file. Configuring the WIFI name and password requires configuration in the macro definitions of the `main.h` file.
Sending commands to the ESP8266 primarily relies on the official MQTT AT firmware. AT commands are very convenient; simply send commands via the serial port. For example, sending an AT command from the computer to the ESP8266's serial port will return "OK." See the official documentation for the complete AT command set. Therefore,
by using a program to have the CW32 send commands to the ESP8266 via the serial port, the same functionality as sending commands from the computer's serial port to the ESP8266 can be achieved. The function for sending commands is `ESP8266_SendCmd`, and its underlying serial port sending function is `USART_SendString`.
At the user level, simply calling the `Connect_WIFI` function completes the WIFI connection.
`void Connect_WIFI() {`
GPIO_WritePin(ESP8266_EN_PORT,ESP8266_EN_PIN,GPIO_Pin_SET); //Turn on ESP8266
delay_ms(100);
if(GPIO_ReadPin(ESP8266_PORT,ESP8266_PIN)==GPIO_Pin_SET)
{
ESP8266_Status = 1;
}
if(ESP8266_Status == 0)
{
Gui_DrawFont_GBK16(8,72,RED,YELLOW,"ESP8266 Not Found");
delay_ms(250);
return ;
}
if(WIFI_Status==0) {
delay_ms(200);
char *t = malloc(100);
strcat(t,"AT+CWJAP="");
strcat(t,WIFI_SSID);
strcat(t,"","");
strcat(t,WIFI_PASSWORD);
strcat(t,""
");
Gui_DrawFont_GBK16(0,0,WHITE,BLACK,"WIFI Connecting...");
ESP8266_SendCmd((uint8_t *)"AT+CWMODE=1,0
",(uint8_t *)"OK");
if(ESP8266_SendCmd((uint8_t *)t,(uint8_t *)"CONNECTED"))
{
WIFI_Status = 1;
FUN[2][0] = Disconnect_WIFI;
sub_menu_button[2][0]="Disconnect WIFI ";
Gui_DrawFont_GBK16(0,16,GREEN,BLACK,"WIFI Connected!");
Gui_DrawFont_GBK16(0,32,WHITE,BLACK,strcat_new("SSID:",WIFI_SSID));
ESP8266_Last_Status = 1;
free(t);
connect_retry_cnt = 0;
delay_ms(200);
Lcd_Clear(BLACK);
Show_Main_Menu();
in_progress_flag = 0;
return ;
}
else
{
free(t);
WIFI_Status = 0;
connect_retry_cnt++;
switch(connect_retry_cnt)
{
case 1:
Gui_DrawFont_GBK16(0,16,RED,BLACK,"Retrying...[1]");
Connect_WIFI();
break;
case 2:
Gui_DrawFont_GBK16(0,16,RED,BLACK,"Retrying...[2]");
Connect_WIFI();
break;
default:
connect_retry_cnt=0;
ESP8266_SendCmd((uint8_t *)"AT+CWMODE=0,0
",(uint8_t *)"OK");
Gui_DrawFont_GBK16(0,16,RED,BLACK,"WIFI Not Connected!");
delay_ms(200);
Lcd_Clear(BLACK);
Show_Main_Menu();
in_progress_flag = 0;
break;
}
return;
}
} Due
to
space limitations, please refer to the source code for the functions for querying network information and disconnecting Wi-Fi; the principles are similar.
After connecting to Wi-Fi, you can connect to MQTT. First, you need to configure MQTT.Configure the relevant parameters for the MQTT connection in the macro definitions of the header file. The specific configuration method is explained in section 4.2.3.
The MQTT publish function is MQTT_Publish. The function takes a character data array as its parameter and uses the AT+MQTTPUB command. After a series of string concatenation operations, the data is sent.
`void MQTT_Publish(char *data)
{
if(mqtt_status==1)
{
char buffer[400] = {0};
strcpy(buffer,"AT+MQTTPUB=0,"");
strcat(buffer,MQTT_TOPIC);
strcat(buffer,"","");
strcat(buffer,data);
strcat(buffer,"",0,0
");
ESP8266_SendCmd((uint8_t*)buffer,(uint8_t*)"OK");
free(buffer);
} }
`
3.4 The functions related to the voltage
and current meter are all in the va_meter.c file. The Launch_VA_Meter function is the entry function to start the voltage and current meter
. Here, the main thing is that the value drawn on the screen needs to be handled a little bit. The floating point number is converted to a string by taking the mantissa. This function contains two modes: graphic mode and digital mode, which are controlled by the va_meter_style variable.
void Launch_VA_Meter(uint8_t idx)
{
Lcd_Clear(BLACK);
Init_VAmeter_ADC();
key_flag[2]=0;
uint8_t send_wait = 100;
double mqtt_volt,mqtt_curr;
//Initialize different styles of interface
switch(idx)
{
case 0:
Gui_DrawFont_GBK16(40,0,LIGHTBLUE,BLACK,"Voltage and Current Meter");
Gui_DrawLine(0,18,160,18,WHITE);
Gui_DrawLine(0,111,160,111,WHITE);
time = 2;
va_meter_style = 0;
break;
case 1:
Gui_DrawFont_GBK16(40,0,LIGHTBLUE,BLACK,"Voltage and Ammeter");
Gui_DrawFont_Num32_2(64,24,YELLOW,BLACK,0); //Displays the decimal point of the voltage
Gui_DrawFont_GBK16(144,38,YELLOW,BLACK,"V"); //Displays the unit of voltage
Gui_DrawFont_Num32_2(96,80,YELLOW,BLACK,0); //Displays the decimal point of the current
Gui_DrawFont_GBK16(144,80,YELLOW,BLACK,"m"); //Displays the unit of voltage in meters
Gui_DrawFont_GBK16(144,96,YELLOW,BLACK,"A"); //Displays the unit of voltage in amperes
va_meter_style = 1;
break;
}
while(key_flag[2]==0) //The left button is not pressed, and it is in the loop
{
ADC_GET();
//Process voltage data
if(adc_value[0]>=4090) //When the voltage value is greater than 3V, switch to 0~31V
{
voltage_value = (adc_value[1]/4095.0 * 1.5 * 21)-0.075; //The reference voltage is 1.5V, and the voltage division ratio is 1:20. After calibration, it is 0.075V higher than the normal value, so subtract 0.075
Gui_DrawFont_GBK16(128,0,RED,BLACK,"3V");
}
else //When the voltage value is less than 3V, switch to 0~3V
{
voltage_value = (adc_value[0]/4095.0 * 1.5 * 2); //The reference voltage is 1.5V, and the voltage division ratio is 1:1
Gui_DrawFont_GBK16(128,0,GREEN,BLACK,"3V");
}
if(voltage_value <=0.3) //When the value is below 0.3, it is considered an ADC error, and the value is set to 0, making this data acquisition invalid
. voltage_value = 0.0;
mqtt_volt = voltage_value;
voltage_value *= 100; // Process to display two decimal places
for(uint8_t i = 0; i<4; i++)
voltage_num[3-i]=(int)(voltage_value/(pow(10,i))) %10;
// Process current data
current_value = ((adc_value[2]/4095.0 * 1.5)/0.2 * 1000)-10.8; // Reference voltage is 1.5V, sampling resistor is 0.2ohm, current unit is mA, calibrated to be 10.8mA higher than theoretical value
if(current_value < 0)
continue;
mqtt_curr = current_value;
current_value *= 10; // Process to display 1 decimal place
for(uint8_t i = 0; i<4; i++)
current_num[3-i]=(int)(current_value/(pow(10,i))) %10;
// MQTT send interval 4-->- approximately equal to 0.3s
send_wait++;
if(send_wait>4)
{
VAmeter_Mqtt_Send_Data(mqtt_volt,mqtt_curr);
send_wait=0;
}
switch(va_meter_style)
{
case 0:
for(uint8_t i = 0; i<2; i++)
{
Gui_DrawFont_Num16(i*8,112,GREEN,BLACK,voltage_num[i]);
}
Gui_DrawFont_GBK16(16,112,ORANGE,BLACK,".");
for(uint8_t i = 2; i<4; i++)
{
Gui_DrawFont_Num16(8+i*8,112,GREEN,BLACK,voltage_num[i]);
}
Gui_DrawFont_GBK16(40,112,ORANGE,BLACK,"V");
for(uint8_t i = 0; i<3; i++)
{
Gui_DrawFont_Num16(60+i*8,112,BLUE,BLACK,current_num[i]);
}
Gui_DrawFont_GBK16(84,112,ORANGE,BLACK,".");
Gui_DrawFont_Num16(92,112,BLUE,BLACK,current_num[3]);
Gui_DrawFont_GBK16(100,112,ORANGE,BLACK,"mA");
Draw_Value_Line();
break;
case 1:
//Voltage
for(uint8_t i = 0; i<2; i++)
Gui_DrawFont_Num32(i*32,24,ORANGE,BLACK,voltage_num[i]);
for(uint8_t i = 2; i<4; i++)
{
Gui_DrawFont_Num32(16+i*32,24,BLUE,BLACK,voltage_num[i]);
}
//Current
for(uint8_t i = 0; i<3; i++)
{
Gui_DrawFont_Num32(i*32,80,ORANGE,BLACK,current_num[i]);
}
Gui_DrawFont_Num32(112,80,BLUE,BLACK,current_num[3]);
break;
}
delay_ms(5);
}
Lcd_Clear(BLACK);
Show_Main_Menu();
in_progress_flag = 0;
key_flag[2]=0;
}
In graphics mode, the function for drawing is Draw_Value_Line. Voltage is represented by a curve, and current is represented by a bar chart.
void Draw_Value_Line()
{
if(time==158)
{
time=2;
Gui_DrawLine(2,20,2,110,BLACK);
}
voltage_value=(int)voltage_value/10;
current_value=(int)current_value/10;
// Plotting range: ordinate 20-110, abscissa 2-158
if(voltage_value>MAX_VOLTAGE_Y*10 || current_value>MAX_CURRENT_Y)
return ;
// First draw the current histogram. If the drawing order is reversed with the voltage curve, the curve will be obscured.
Gui_DrawLine(time,110-(int)(90*current_value/MAX_CURRENT_Y),time,110,BLUE);
// Then draw the voltage curve.
if(time==2)
{
Gui_DrawPoint(time,110-(int)(90*voltage_value/10/MAX_VOLTAGE_Y),GREEN);
}
else
{
Gui_DrawLine(last_time,110-(int)(90*last_voltage_value/10/MAX_VOLTAGE_Y),time,110-(int)(90*voltage_value/10/MAX_VOLTAGE_Y),GREEN); //voltage
}
Gui_DrawLine(time+1,20,time+1,110,BLACK); //Erase the value at the next moment
time++;
last_voltage_value = voltage_value;
last_time = time;
}
There is also a function VAmeter_Mqtt_Send_Data, which sends voltage, current and power data to the MQTT message queue. This function will be automatically enabled after connecting to WIFI and MQTT.
void VAmeter_Mqtt_Send_Data(double volt,double curr)
{
if(mqtt_status == 0)
return ;
double pwr = volt*curr;
char *data = malloc(150);
char t[10] = {0};
strcpy(data,"{"volt":");
num2char(t,volt,log10(volt)+1,2);
strcat(data,t);
memset(t,0,10);
strcat(data,","curr":");
num2char(t,curr,log10(curr)+1,1);
strcat(data,t);
memset(t,0,10);
strcat(data,","pwr":");
num2char(t,pwr,log10(pwr)+1,1);
strcat(data,t);
free(t);
strcat(data,"}");
MQTT_Publish(data);
free(data);
}
3.5 Interrupts, Keys, and Timers:
The entire project configures two basic timers (BTIM) and one GPIOA port interrupt. Their respective functions are shown in the table below.
Interrupt
Functions :
BTIM1:
Determines key status, interrupts every 10ms.
BTIM2:
Updates the status bar, interrupts every 1s.
GPIOA
: Wakes up from sleep, only checks the PA10 (OK key) pin.
Additionally, a general-purpose timer (GTIM3) is used to implement PWM dimming of the screen at a frequency of 1250Hz. Its initialization function is as follows:
void GTIM3_PWM_Init(void)
{
PC15_AFx_GTIM3CH2(); // Multiplexed function is general-purpose timer 3 channel 2
/*********** GTIM3 Configuration ***********/
GTIM_InitTypeDef GTIM_InitStruct; // General-purpose timer initialization structure
__RCC_GTIM3_CLK_ENABLE(); // Enable general-purpose timer 1 clock
GTIM_InitStruct.Mode = GTIM_MODE_TIME; // Timer mode
GTIM_InitStruct.OneShotMode = GTIM_COUNT_CONTINUE; // Continuous counting mode
GTIM_InitStruct.Prescaler = GTIM_PRESCALER_DIV512; // DCLK = PCLK / 128 = 64MHz / 512 = 125KHz
GTIM_InitStruct.ReloadValue = 100; // Reload value setting PWM: 1.25KHz
GTIM_InitStruct.ToggleOutState = DISABLE; // Output toggle function
GTIM_TimeBaseInit(CW_GTIM3, >IM_InitStruct); // Initialize
GTIM_OCInit(CW_GTIM3, GTIM_CHANNEL2, GTIM_OC_OUTPUT_PWM_HIGH); // Configure output compare channel 3 to PWM mode
GTIM_SetCompare2(CW_GTIM3, lcd_brightness); // Set the initial duty cycle to lcd_brightness/100 = 50/100 = 50%
GTIM_Cmd(CW_GTIM3, ENABLE); // Enable timer
}
The button-related functions are in the key.c source file. The initialization function Key_Init sets each button to pull-up input mode.
void Key_Init(void)
{
GPIO_InitTypeDef GPIO_InitStruct;
/*
PA8 -> UP_KEY
PA9->DOWN_KEY
PA10->LEFT_KEY
PA11->RIGHT_KEY
PA12->CONFIRM_KEY
*/
GPIO_InitStruct.Pins = LEFT_KEY_PIN|RIGHT_KEY_PIN|UP_KEY_PIN | CONFIRM_KEY_PIN| DOWN_KEY_PIN;
GPIO_InitStruct.Mode = GPIO_MODE_INPUT_PULLUP; //Pull-up input
GPIO_InitStruct.Speed = GPIO_SPEED_HIGH; //High output speed
GPIO_Init(CW_GPIOA, &GPIO_InitStruct); //Initialization
}
To prevent false alarms caused by key bounce, the key status is checked every time Timer BITM1 interrupts (every 10ms). The Check_Key_Status function uses a state machine.
If the key is pressed, the key index corresponding to key_status is set to 1. Then, it is checked again after 10ms. If it is still pressed, it is a true press and not a bounce, and the key index corresponding to key_flag is set to 1. Otherwise, key_flag is set to 0.
The method for detecting a long press is similar, but it checks several times. If the key is pressed for more than 130ms, it is a long press, and the key index corresponding to key_flag is set to 2.
void Check_Key_Status()
{
for(uint8_t i = 0;i<5;i++)
{
if(key_status[i]==0)
{
if(GPIO_ReadPin(key_pin_port[i],key_pin[i])==GPIO_Pin_RESET)
{
key_status[i] = 1;
}
}
else if(key_status[i] == 1)
{
if(GPIO_ReadPin(key_pin_port[i],key_pin[i])==GPIO_Pin_RESET) //Short press detected
{
key_flag[i] = 1;
key_status[i] = 2;
}
else
{
key_status[i] = 0;
}
}
else if(key_status[i] >= 2 && key_status[i]<15)
{
if(GPIO_ReadPin(key_pin_port[i],key_pin[i])==GPIO_Pin_RESET) //Intermediate state from short press to long press, the button has been pressed for at least 130ms
{
key_status[i]++;
}
else
{
key_status[i]--;
}
}
else if(key_status[i] == 15)
{
if(GPIO_ReadPin(key_pin_port[i],key_pin[i])==GPIO_Pin_RESET) //Long press detected
{
key_flag[i] = 2;
}
else
{
key_status[i]--;
}
}
else
{
if(GPIO_ReadPin(key_pin_port[i],key_pin[i])==GPIO_Pin_SET)
{
key_flag[i]=0;
} }
}
}
4
User Manual
4.1 PCB Soldering
The circuit soldering is not difficult. The smallest package is 0603, which is relatively easy to solder. The core components all use a female connector design, and there are no QFP or QFN chips to solder, so the difficulty is relatively low.
Here are a few tips for soldering:
When soldering GND pads with large areas of copper filling, appropriately increase the soldering iron temperature to prevent the heat dissipation from being too fast and causing insufficient solder temperature, resulting in cold solder joints;
solder individual chips first, such as TC4056A, MT3608, LDO, etc.;
then solder from small to large and from low to high. Other components;
When soldering the two rows of headers on the development board, you can first insert the headers into the pin headers on the development board and then solder them. This ensures that the spacing between the two rows of headers matches the development board, since the pin headers on the development board are also hand-soldered and it is difficult to achieve perfect perpendicularity.
Use a multimeter in continuity mode to test for short circuits and open circuits. If everything is fine, insert the LCSC development board, screen, ESP8266, and battery into their respective headers/connectors. Back on the computer, follow the steps in the following sections to realize a multi-functional IoT voltage and current meter.
4.2 Installing and Configuring Keil & CW32 Program Download
4.2.1 Keil Download and Installation
Keil Community Edition Download and installation are detailed in the Wiki of LCSC Development Board: LCSC Development Board Wiki Installing Keil
4.2.2 Component Package Installation
Component package is installed in the Wiki of LCSC Development Board: LCSC Development Board Wiki Component Package Installation
4.2.3 CW32 Program Download
(1) Download CW32F030C8T6_VAmeter.zip from the attachment and unzip it.
(2) Go to the folder CW32F030C8T6_VAmeter->Project->MDK, and use Keil to open the Project.uvprojx project file
. (3) Configure WIFI. As shown in Figure 18, configure the WIFI name and password in main.h.

Figure 18 Modify WIFI name and password
(4) Configure MQTT. Please return to this step after setting up the MQTT server in Section 4.5.
As shown in Figure 19, the username and password are set on the EMQX server. Please refer to Section 4.5 for details. The ClientID is set by yourself. I set it to esp8266_VAmeter for easy identification. The server address is the IP address of the EMQX device. The port generally does not need to be changed and is 1883 by default. The topic is the topic to publish messages. You can write a name that you can remember, because you will need to subscribe to this topic when configuring the Python forwarding program later.

Figure 19 MQTT connection configuration
(5) Keil downloader configuration. As shown in Figure 20, I am using ST-LINK. Please choose according to your downloader.
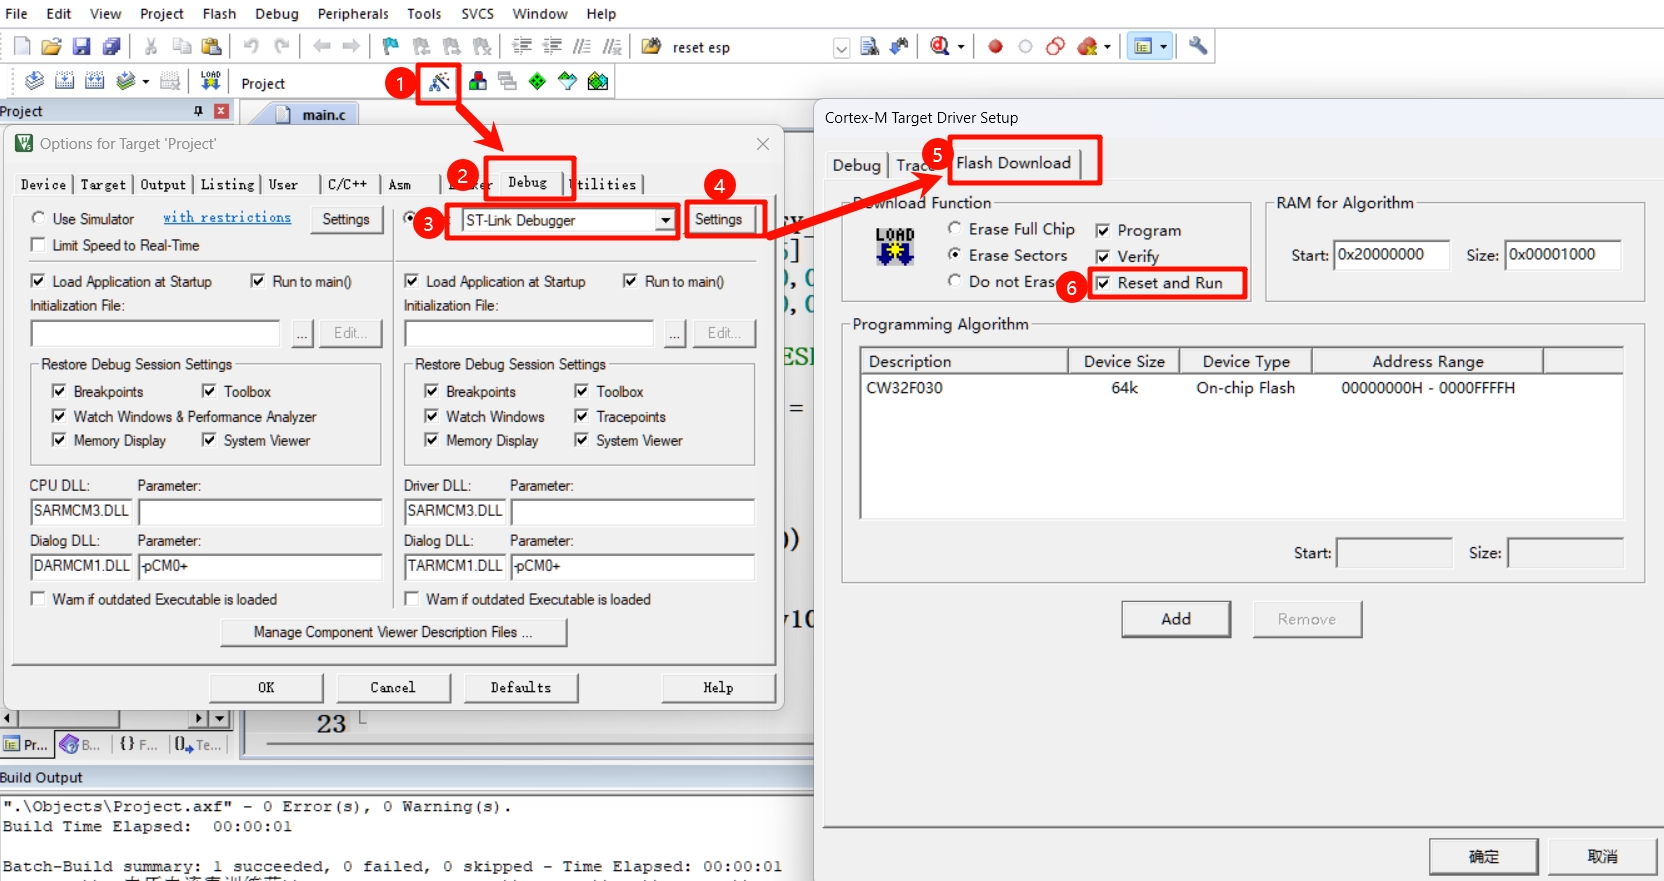
Figure 20 Keil downloader configuration
(6) Keil compiler configuration. This project uses V5.06 for compilation. The compiler installation tutorial is: https://blog.csdn.net/weixin_44807874/article/details/128627528.
To make it easier for everyone to download, I have transferred this file from the official website to the cloud drive: https://www.123pan.com/s/TBfTjv-jdvg.html
(7) Click the Rebuild button in Keil. After compilation, there should be 0 Errors and 0 Warnings, as shown in Figure 21.
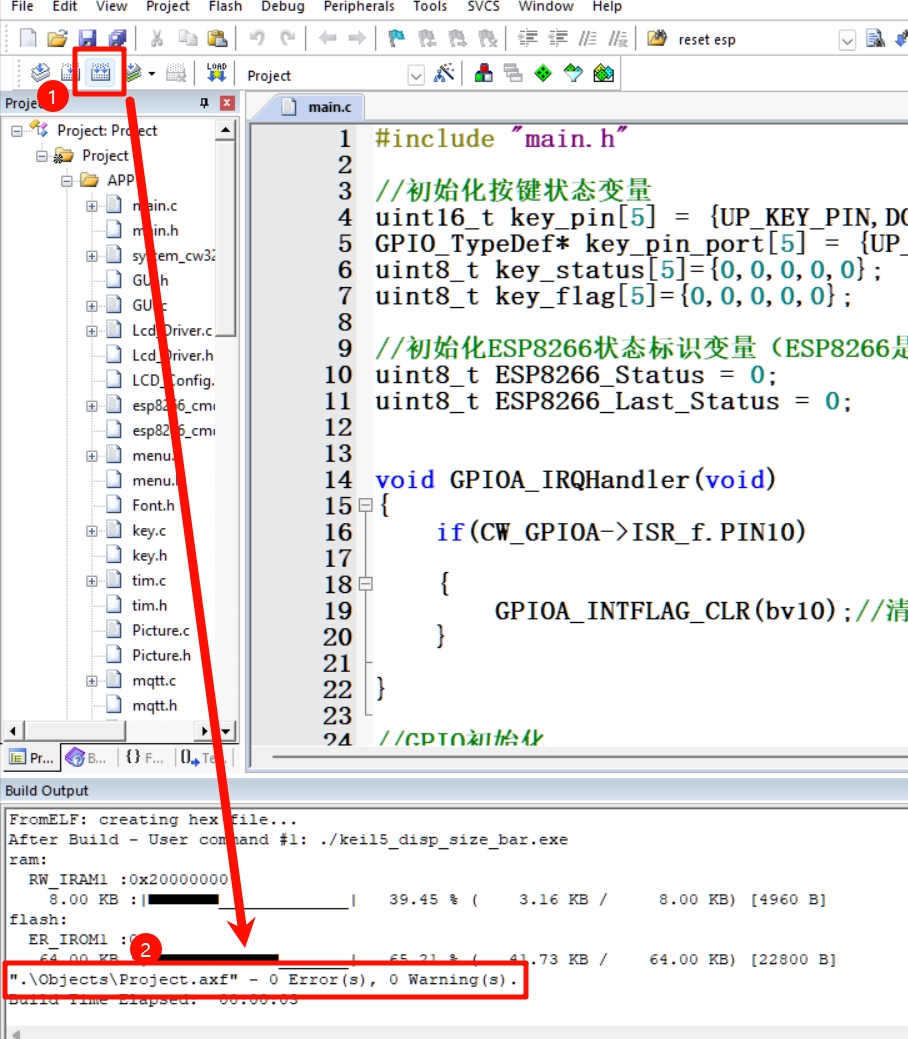
Figure 21 Recompiling Rebuild
(8) Connect the downloader, click the Download button, wait a few seconds, and it will be used normally.
4.3 Download the MQTT AT firmware of ESP8266
(1) Download and unzip flash_download_tool.zip and 1112_esp8266-4m.zip in the attachment.
(2) Using a USB to serial port module, connect the serial port module to the onboard download interface according to the table below. Serial
port module
onboard interface
3.3V
3.3V
TXD
RXD
RXD
TXD
GND
GND
(3) Using a jumper cap, short the download selection jumper, as shown in Figure 22.
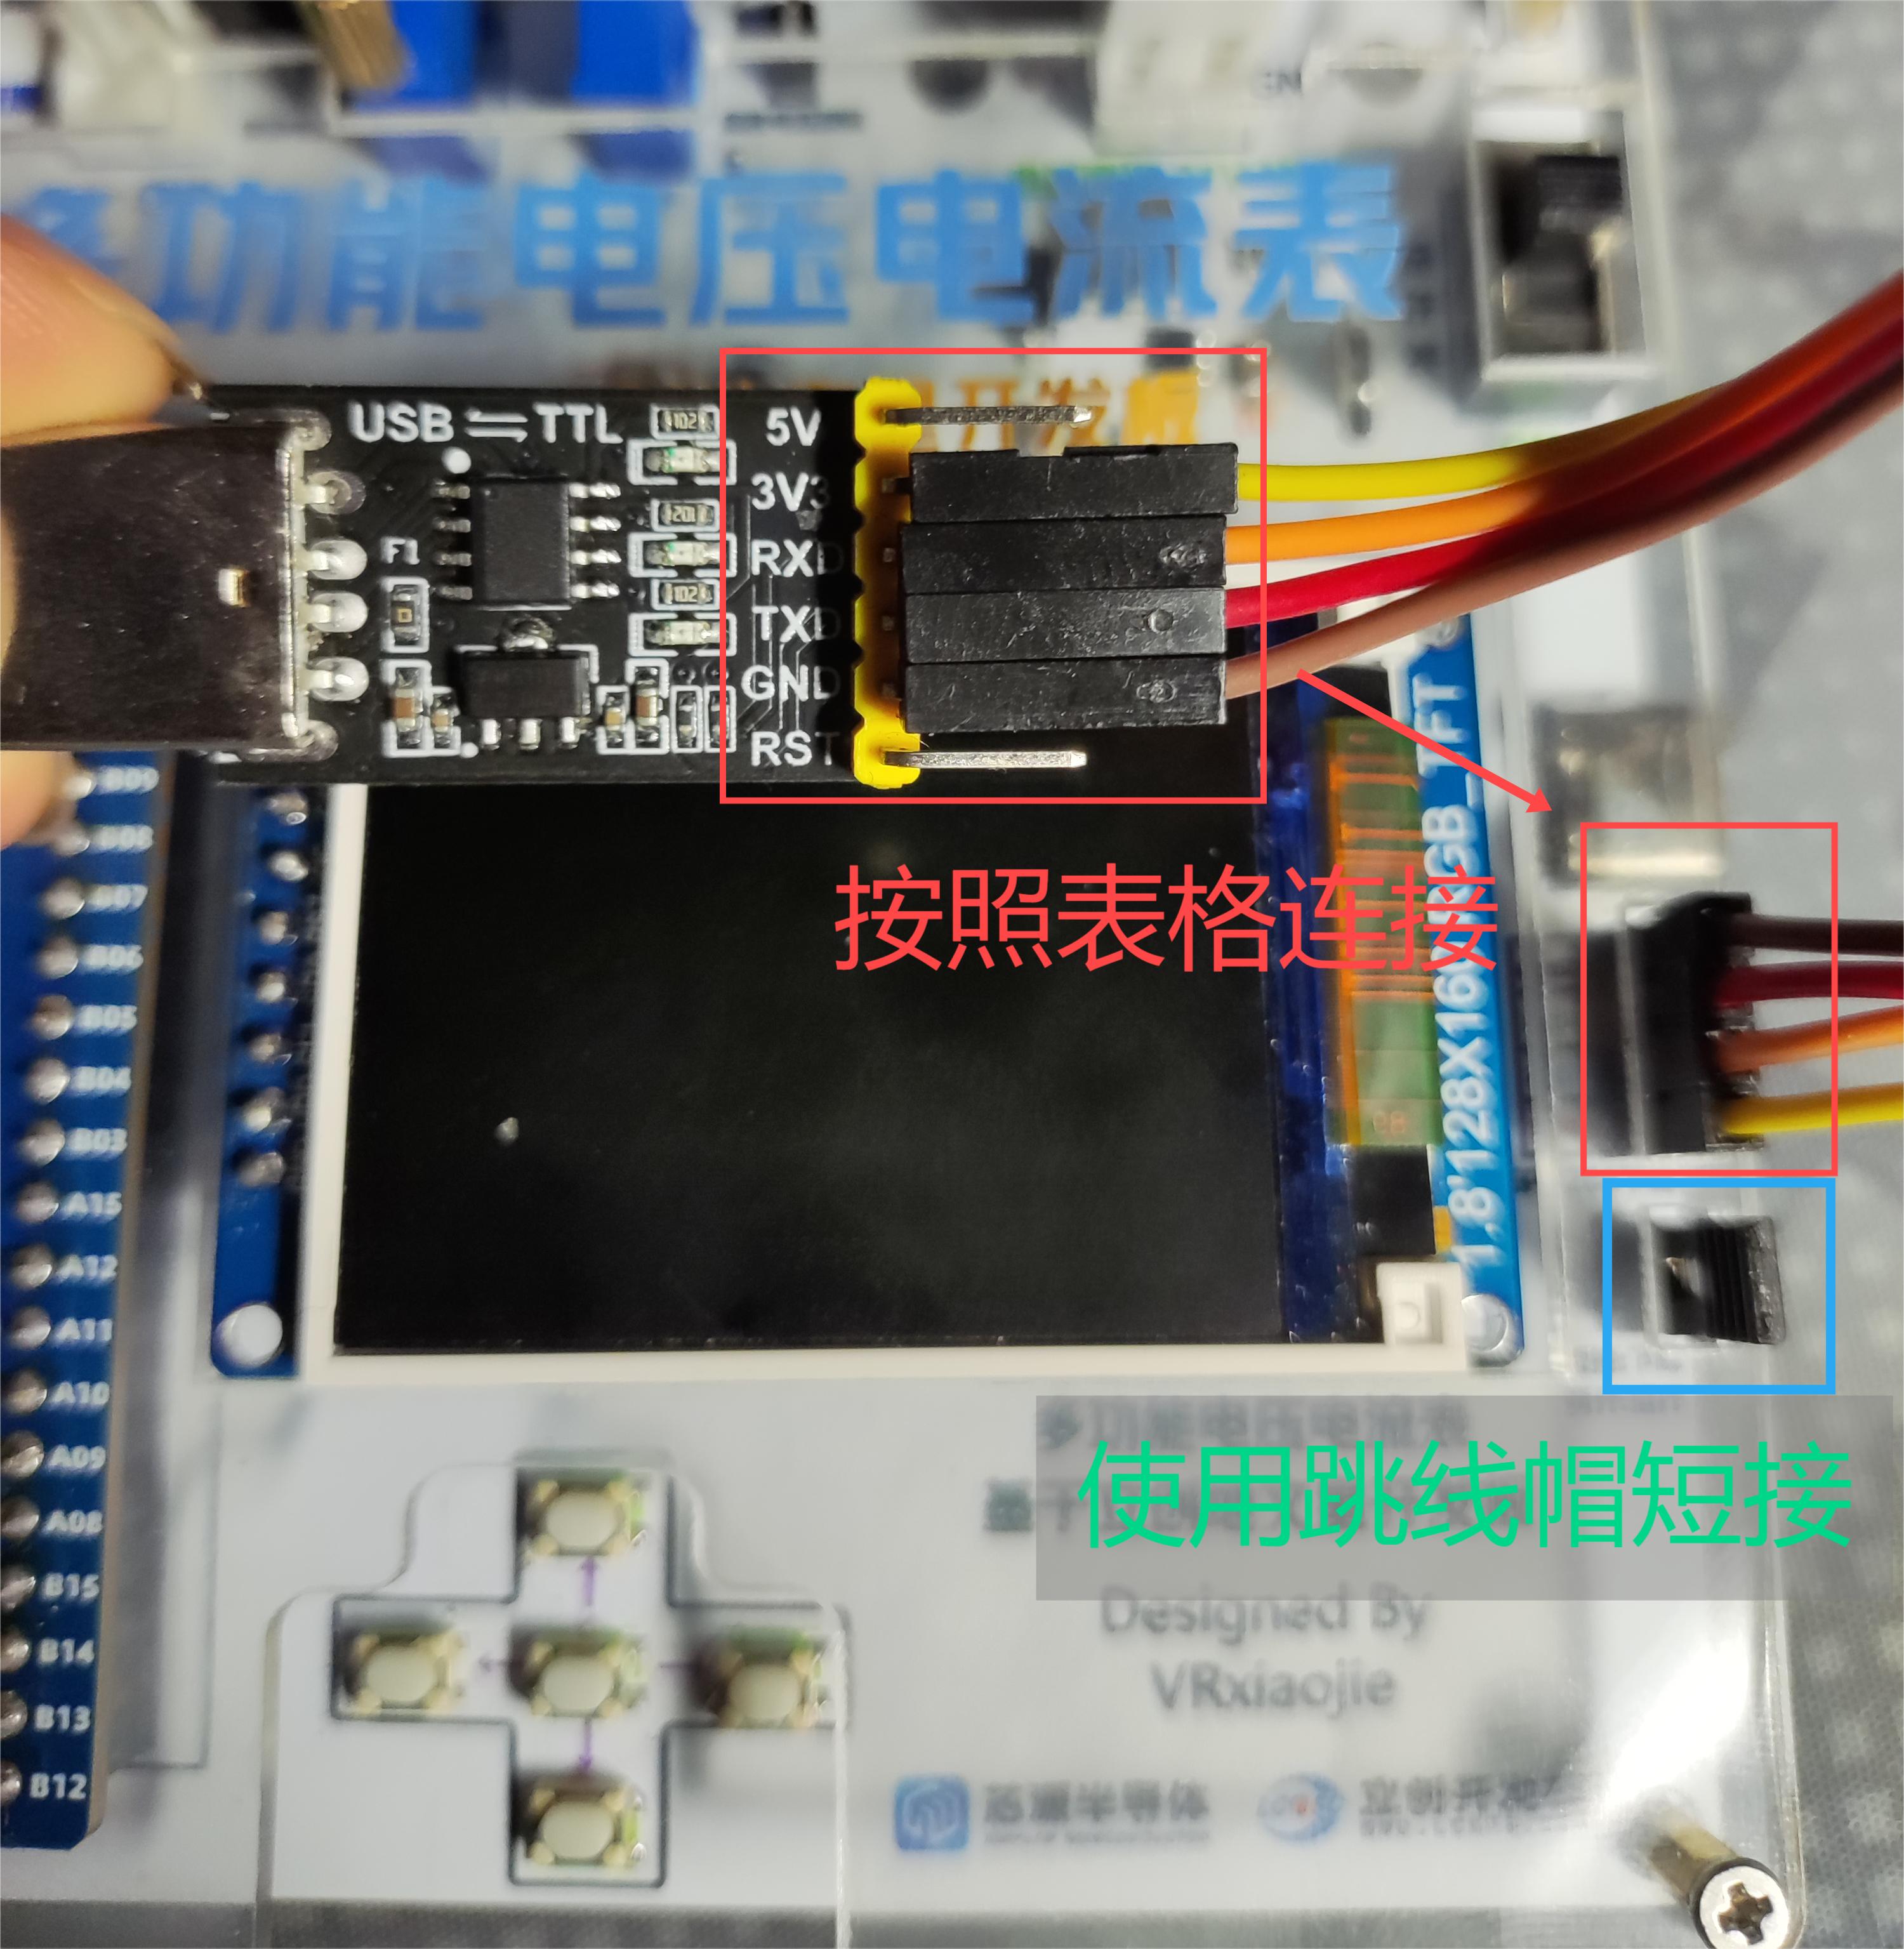
Figure 22 ESP8266 serial port download wiring
(4) Insert the serial port module into the computer, open the flash_download_tool_3.9.2.exe in the unzipped flash_download_tool folder, in the pop-up window, select ESP8266 as the first option and develop as the second option, then click OK.
In the next interface, configure it as shown in Figure 23. Select the COM port according to your computer's recognition. After configuration, click START.

Figure 23 Firmware download tool configuration
(5) Since ESP8266 is disabled by default in the CW32 program, you need to go to the CW32 menu to System Settings -- Start ESP8266.
Please note: Keep the onboard main switch off, otherwise the firmware of ESP8266 may not be able to be downloaded normally.
(6) Check the flash_download_tool on your computer. It has started downloading. Wait patiently for the progress bar to finish.
(7) Unplug the serial port module wiring and jumper cap, operate the menu to WIFI-Connect WIFI, and check if the connection is normal. You can also operate the menu to WIFI-Network Information after connection to obtain device IP and other information.
4.4 Self-built InfluxDB database
Please note: Sections 4.4, 4.5 and 4.6 are based on Docker one-click installation and deployment. If you have not installed Docker, please refer to the following tutorials for installation:
Windows Docker installation tutorial: https://www.runoob.com/docker/windows-docker-install.html
Ubuntu Docker installation tutorial: https://www.runoob.com/docker/ubuntu-docker-install.html
After installation, type the command docker -v in the command line (windows) or terminal (Linux). If it returns Docker version xx.xx.x,build xxx, the installation is successful and you can continue to the next step.
(1) Pulling the InfluxDB image
Here I use a Docker image accelerator that I built myself to accelerate the image. It may become unusable if there are too many accesses. If you have a domain name, you can refer to this tutorial and use Cloudflare. Workers can build their own.
It doesn't matter if there is no domain name, just use my image to speed it up. Open the terminal and enter the following command to create the directory to store the data.
mkdir config && mkdir data
(2) Then run the docker run command, where $PWD is the folder where the terminal is located. I changed the port mapping to 3086
sudo docker run -d
--name=influxdb2.0
-p 3086:8086
-v "$PWD/data:/var/lib/influxdb2"
-v "$PWD/config:/etc/influxdb2"
docker-mirror.vrxiaojie.top/library/influxdb:2.7.6
(3) If nothing goes wrong, it will start to automatically pull the image without any errors. Then we open the webpage and enter the IP address and port of the machine where you deployed InfluxDB, for example, mine is 192.168.50.111:3086, and we can see the welcome screen (Figure 24)

. Figure 24 InfluxDB Welcome Screen
(4) Click Next to go to the initialization settings, where you are asked to fill in the username, password, organization name, and initial Bucket name. You can fill them in yourself or follow mine (Figure 25).
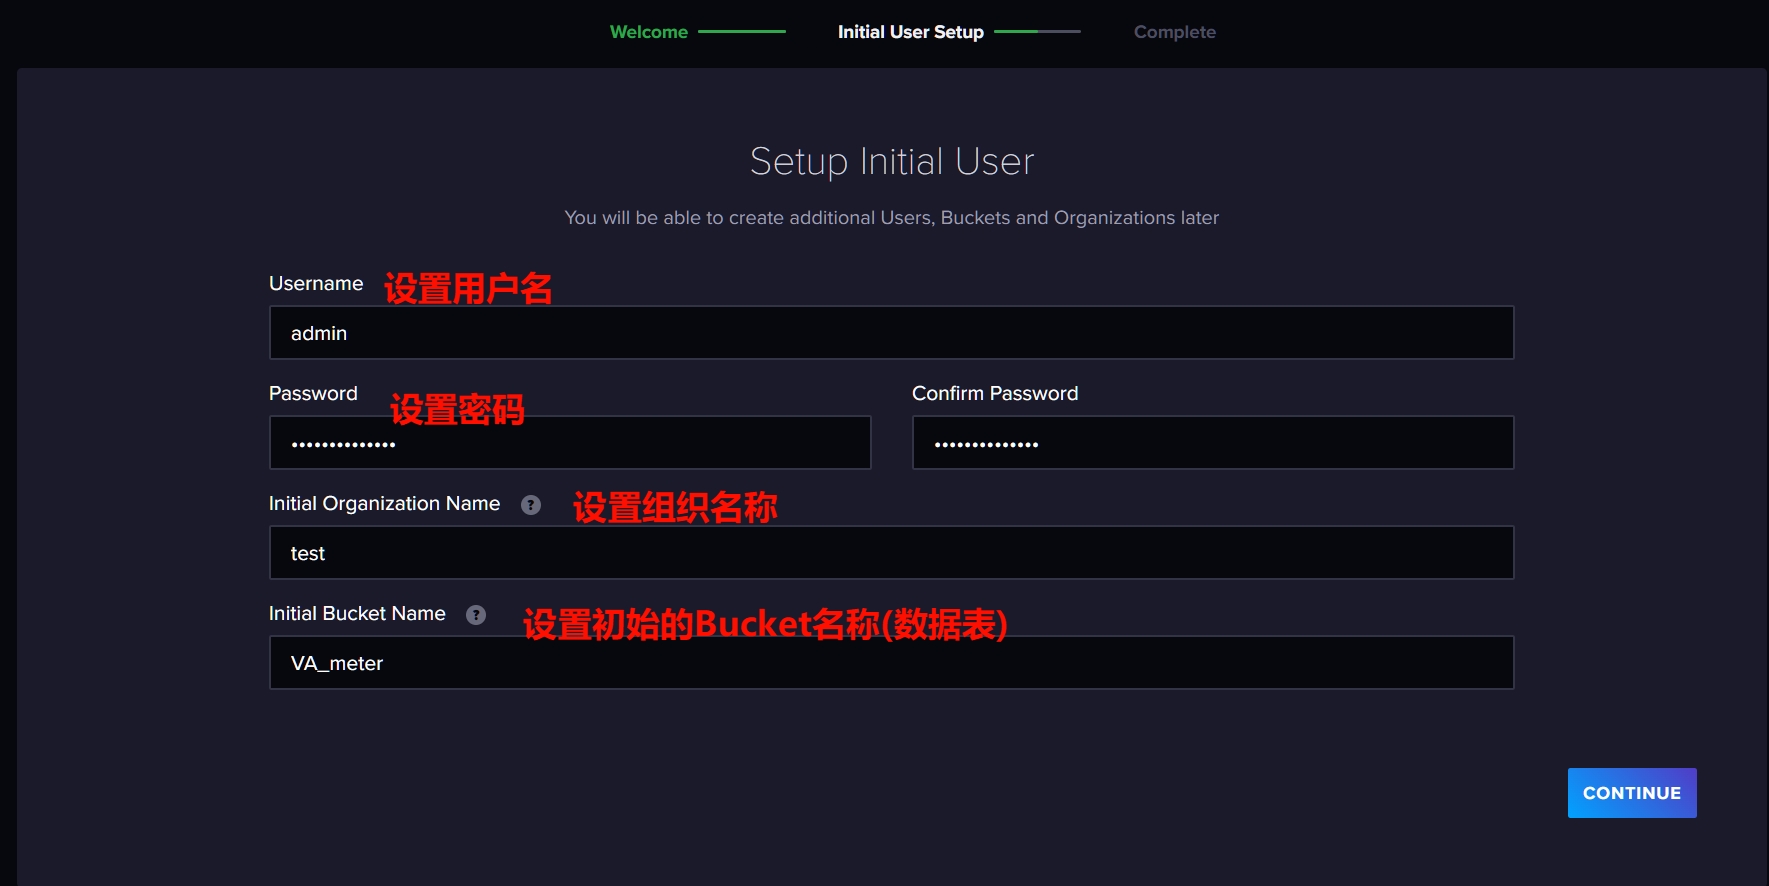
Figure 25 Initializing InfluxDB Settings
(5) Done! Save the displayed API token, which will be used later. Then click Quick Start (Figure 26)
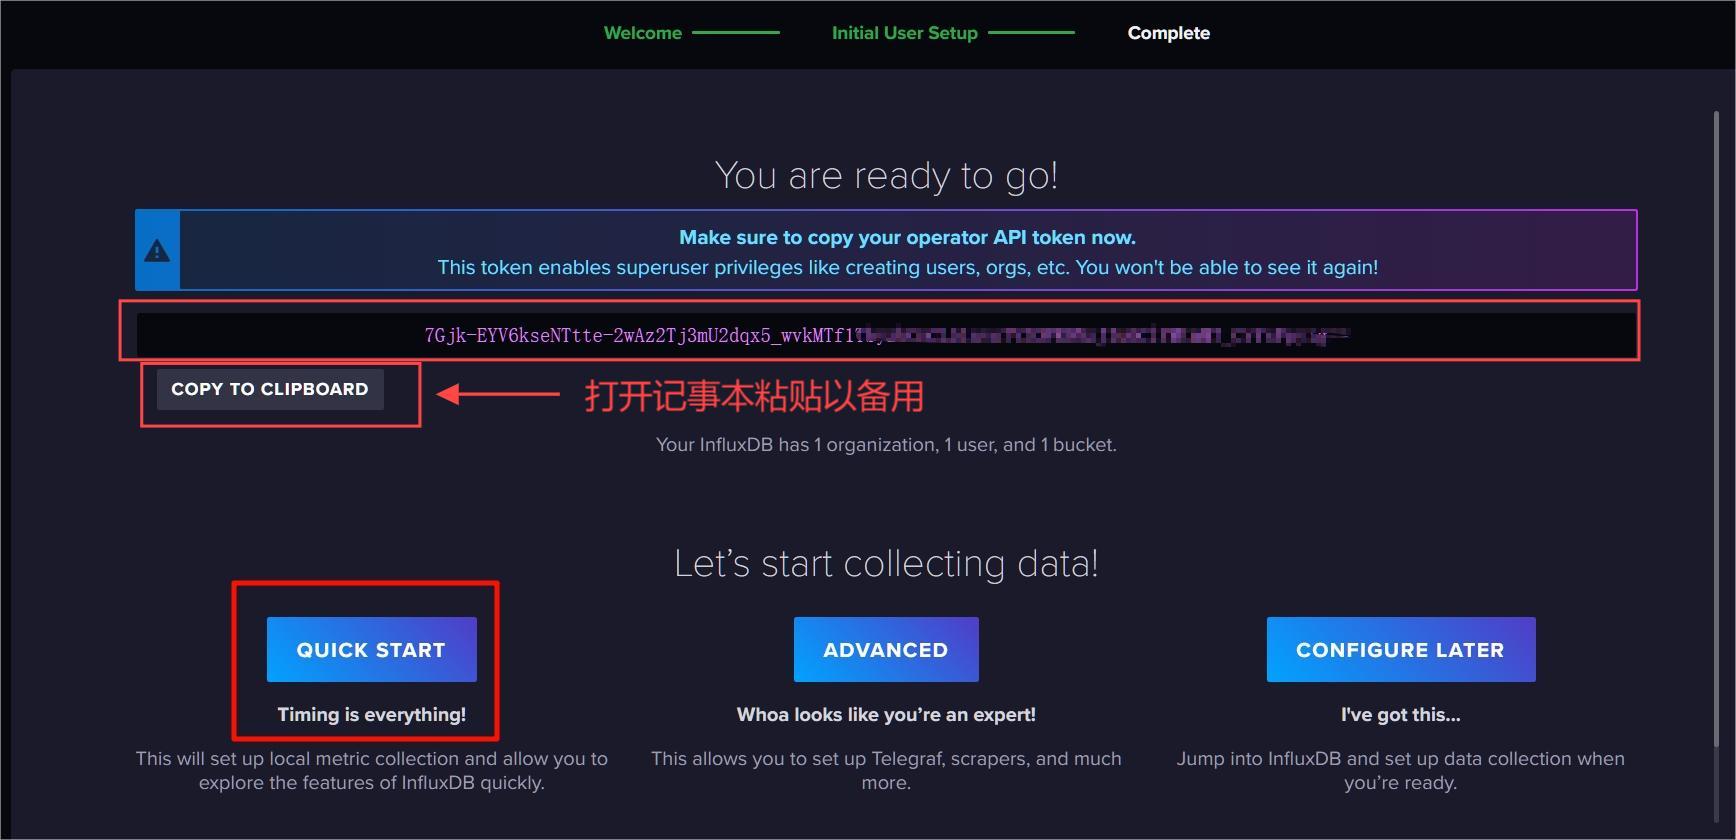
Figure 26 InfluxDB initialization complete
At this point, the InfluxDB database is set up.
4.5 Self-built MQTT server - EMQX
(1) Similar to setting up the database, find another folder and enter the command to create the folder where the EMQX log and data files are located.
mkdir data && mkdir log
(2) Then start the docker container
sudo docker run -d --name emqx
-p 1883:1883
-p 18083:18083
-v $PWD/data:/opt/emqx/data
-v $PWD/log:/opt/emqx/log
docker-mirror.vrxiaojie.top/library/emqx:5.7.1
(3) Open your browser and go to the IP address where you deployed EMQX: 18083, for example, mine is 192.168.50.111:18083. Go to the login interface. The default username for EMQX is admin and the password is public. After logging in, change the password and go to the main interface.
(4) Create client authentication, see Figure 27. Client authentication --> Create --> "Password_Based" Next --> "Built-in database" Next --> "username" "sha256" "suffix" --> Create
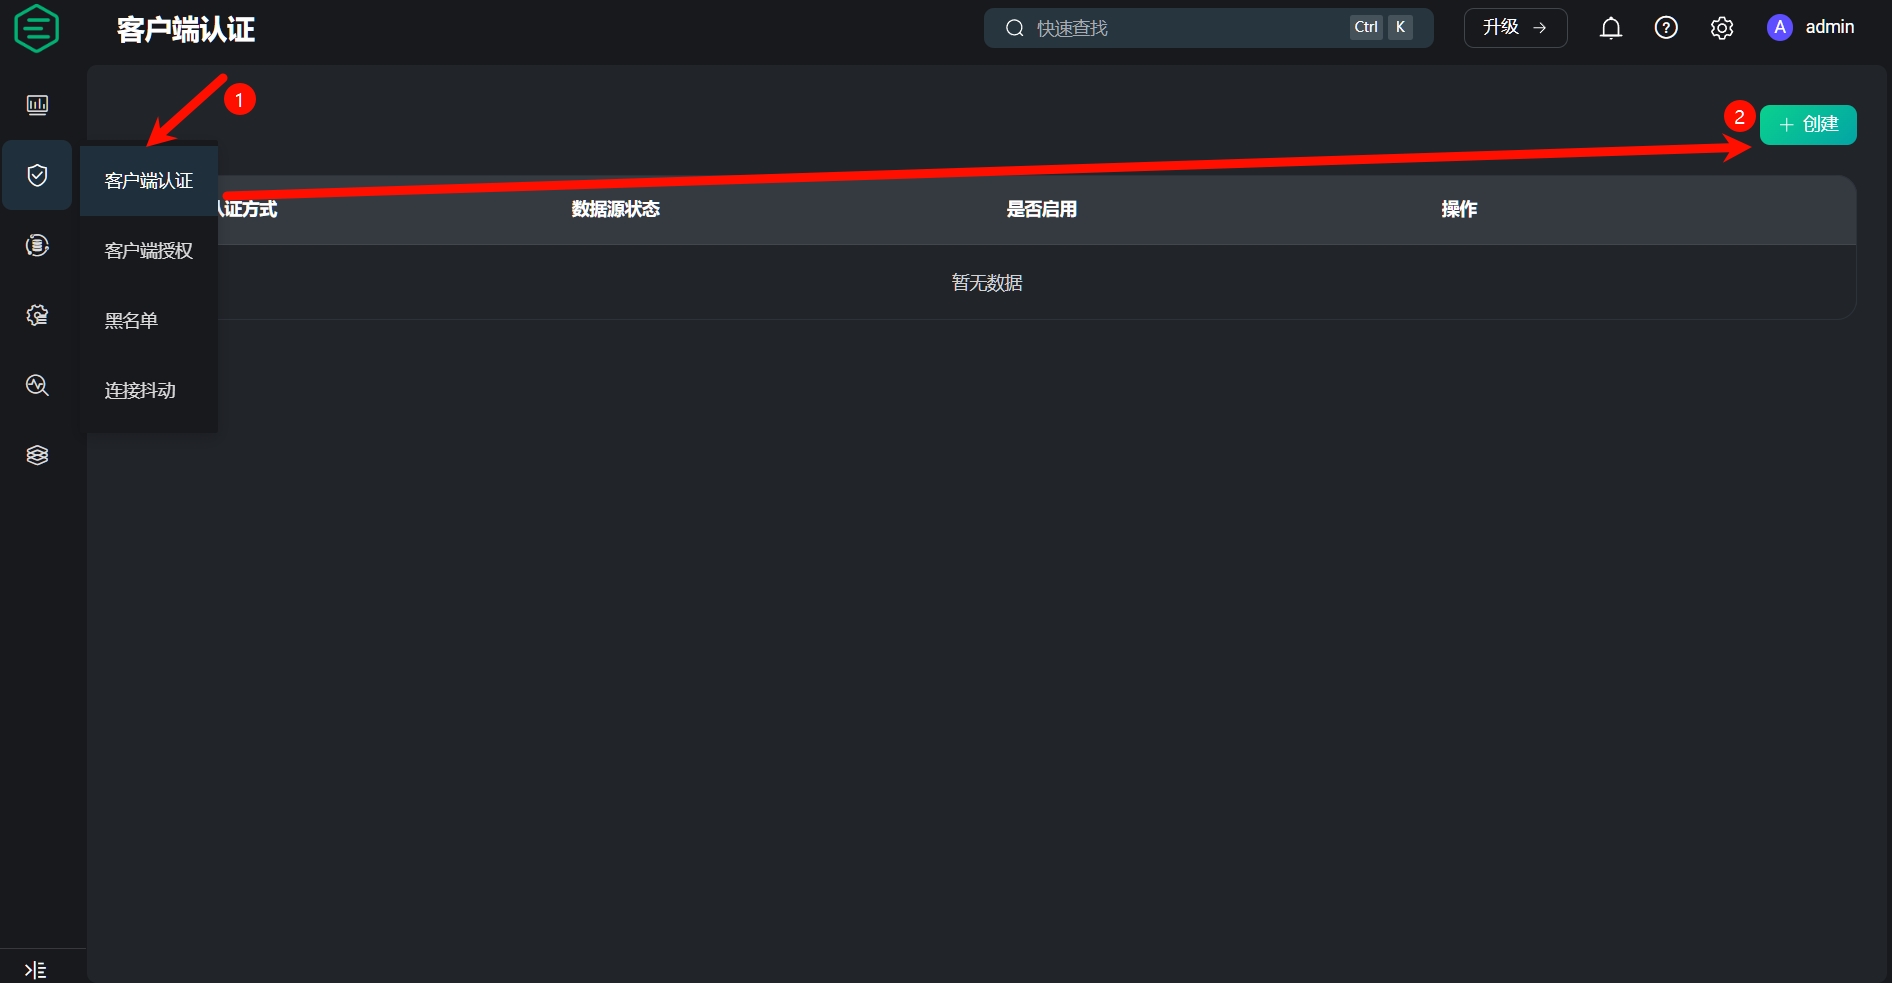
Figure 27 EMQX Create Client Authentication
(5) After successful creation, click User Management (Figure 28) --> "+" sign --> Enter the username, I wrote esp8266, password 123456 --> Create (Figure 29).
Similarly, create a username named python for use in the next section.
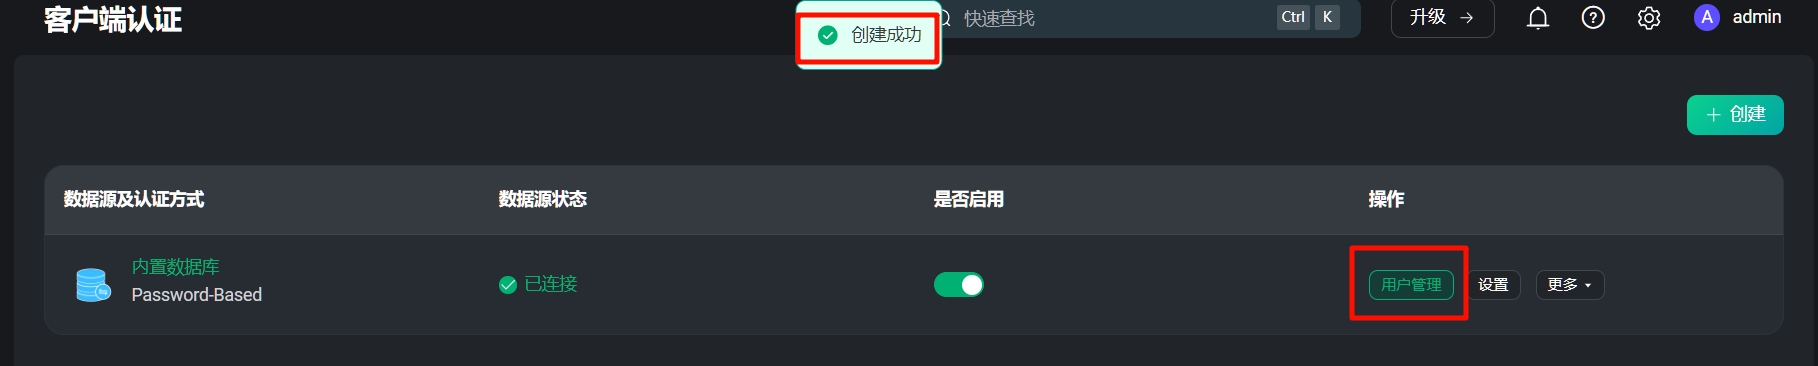
Figure 28 Create User
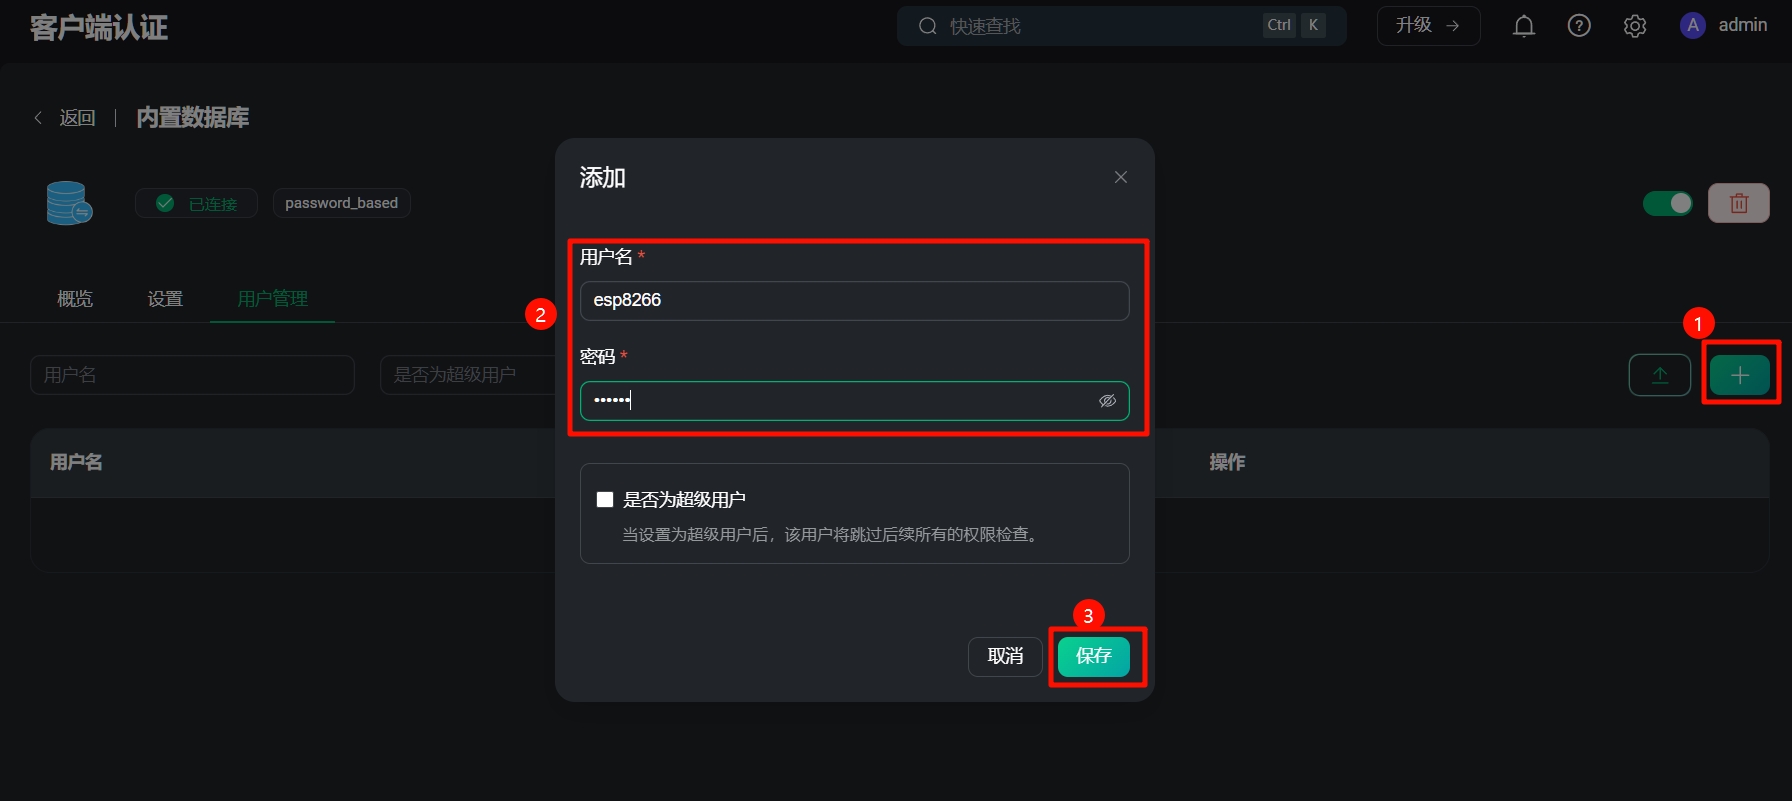
Figure 29 Set the client username and password
(6) Finally, return to step (4) in section 4.2.3, fill in the relevant parameters in the macro definition, and then download the program to CW32.
4.6 Use the Python program to receive and forward data to the database
(1) Download the python forwarding program.zip in the attachment and unzip it. Enter the directory, open the terminal and run it to install the dependency library.
pip install -r requirements.txt
(2) After completion, open emqx_receive_VA_meter.py with any editor and modify the parameters marked # in this line. As shown in Figure 30. Remember to save after modification.
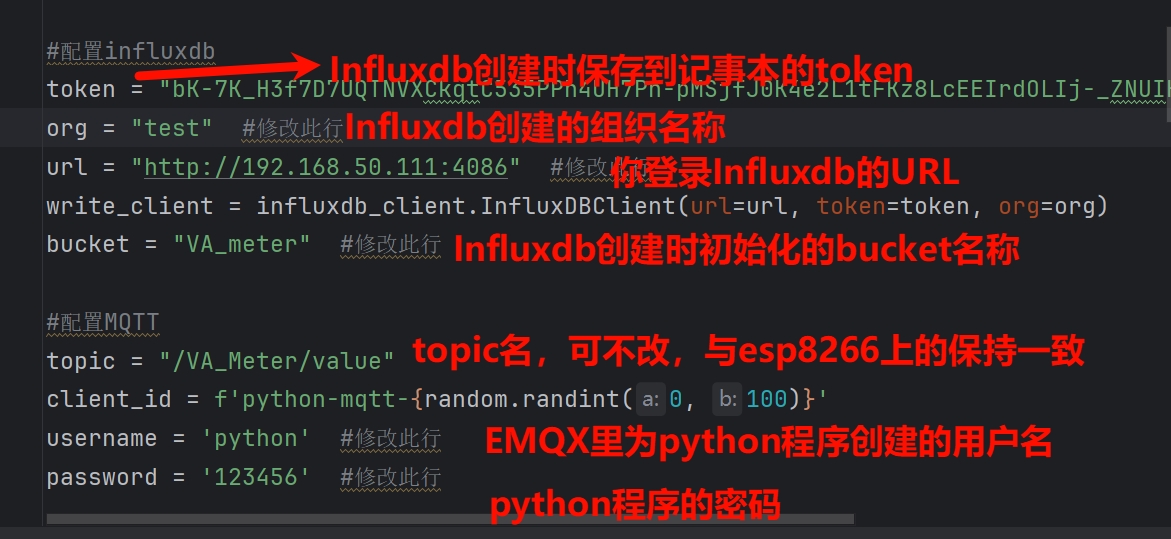
Figure 30 Python program parameter settings
(3) Run the py program. Open the terminal in the current directory and enter
python emqx_receive_VA_meter.py
If you see Connected to MQTT Broker!This indicates that the connection to the EMQX server has been successful. The program can then be placed in the background.
(4) Turn on the power switch of the voltmeter and ammeter, connect to WIFI and MQTT in sequence, and enter the voltage and current measurement function. At this point, the terminal will display the values of voltage, current, and power, as shown in Figure 31.
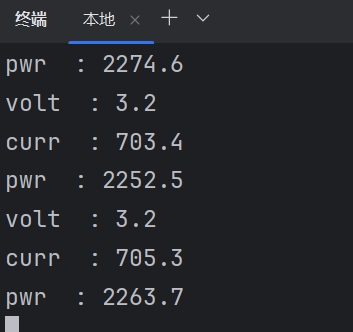
Figure 31 Data parsed by the program
(5) Enter the InfluxDB backend management interface and follow the steps shown in Figure 32 to find the data that was just sent.
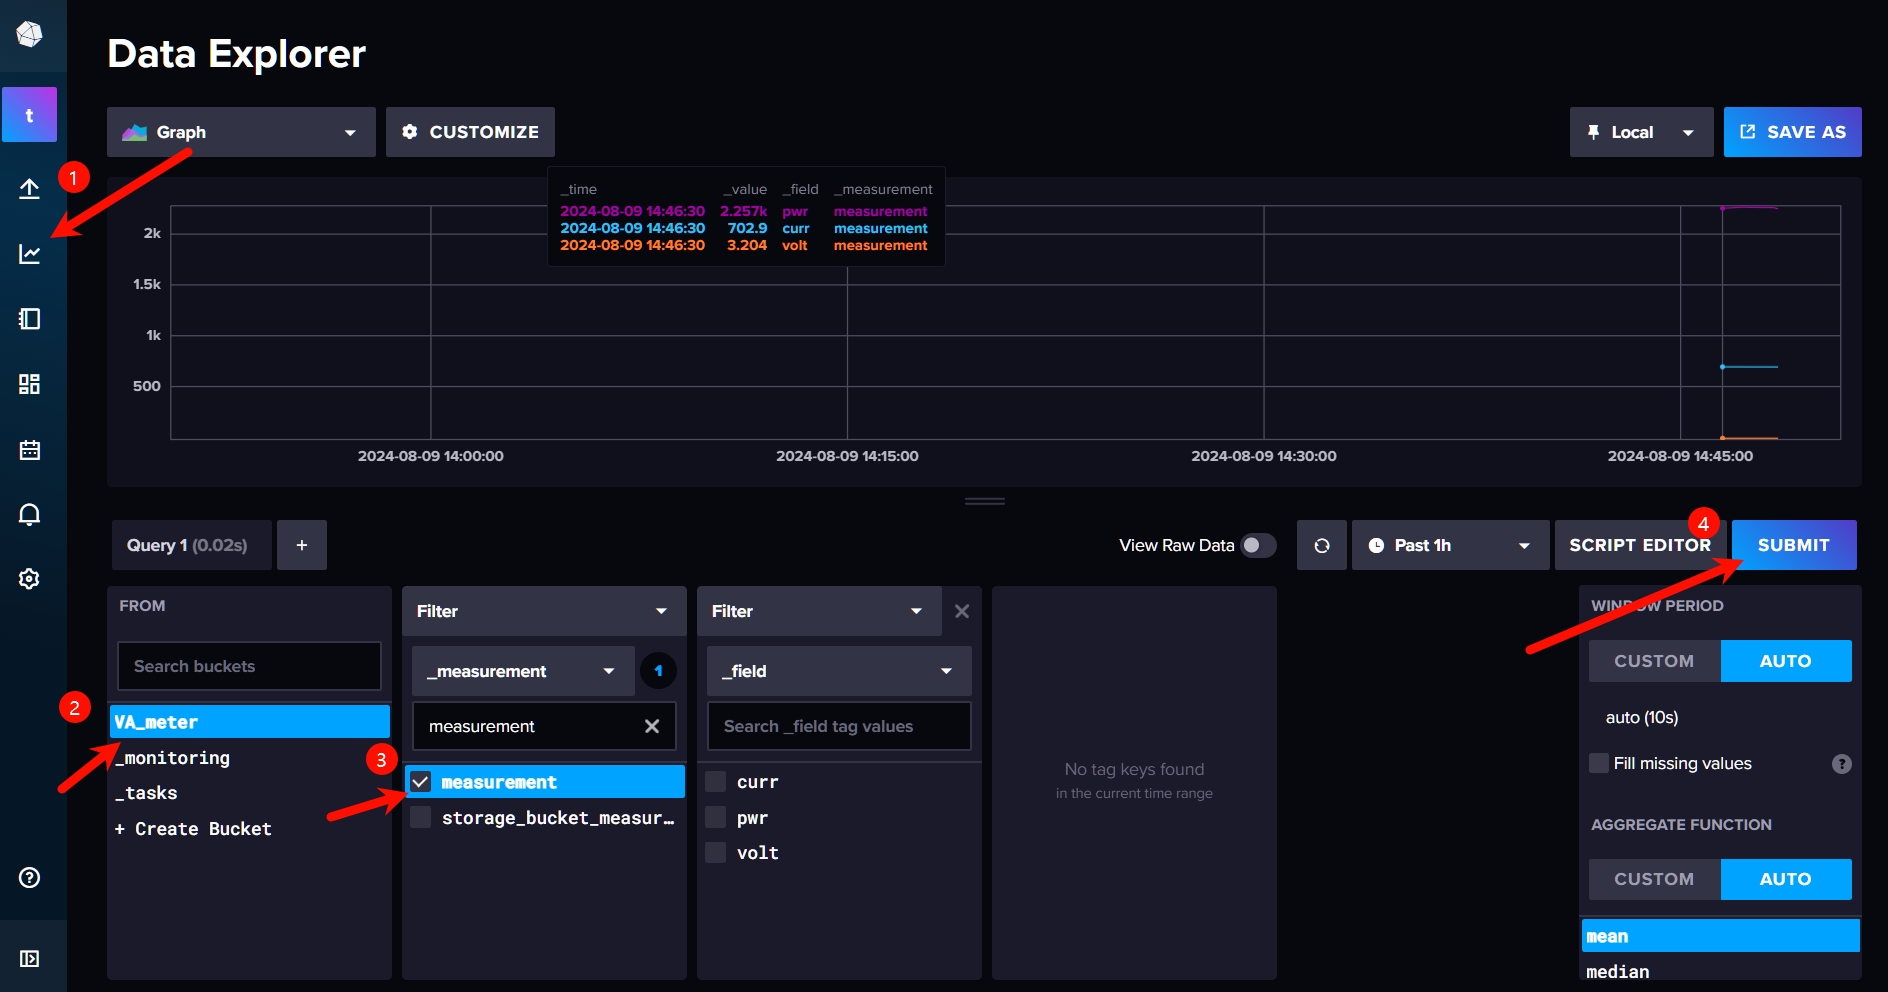
Figure 32 InfluxDB data query
4.7 Grafana data monitoring dashboard
(1) Install grafana using Docker. First, create a data folder
mkdir grafana
(2) Then docker run
sudo docker run -d --name=grafana
-p 3000:3000
-v "$PWD/grafana:/var/lib/grafana"
-e GF_DASHBOARDS_MIN_REFRESH_INTERVAL=100ms
docker-mirror.vrxiaojie.top/grafana/grafana:11.0.0
(3) Open a browser and go to the IP address where you deployed grafana:3000, for example, mine is 192.168.50.111:3000, and go to the login interface. The default username and password are both admin.
(4) Create a data source. As shown in Figure 33, click Data Sources in the left sidebar, then click Add New...
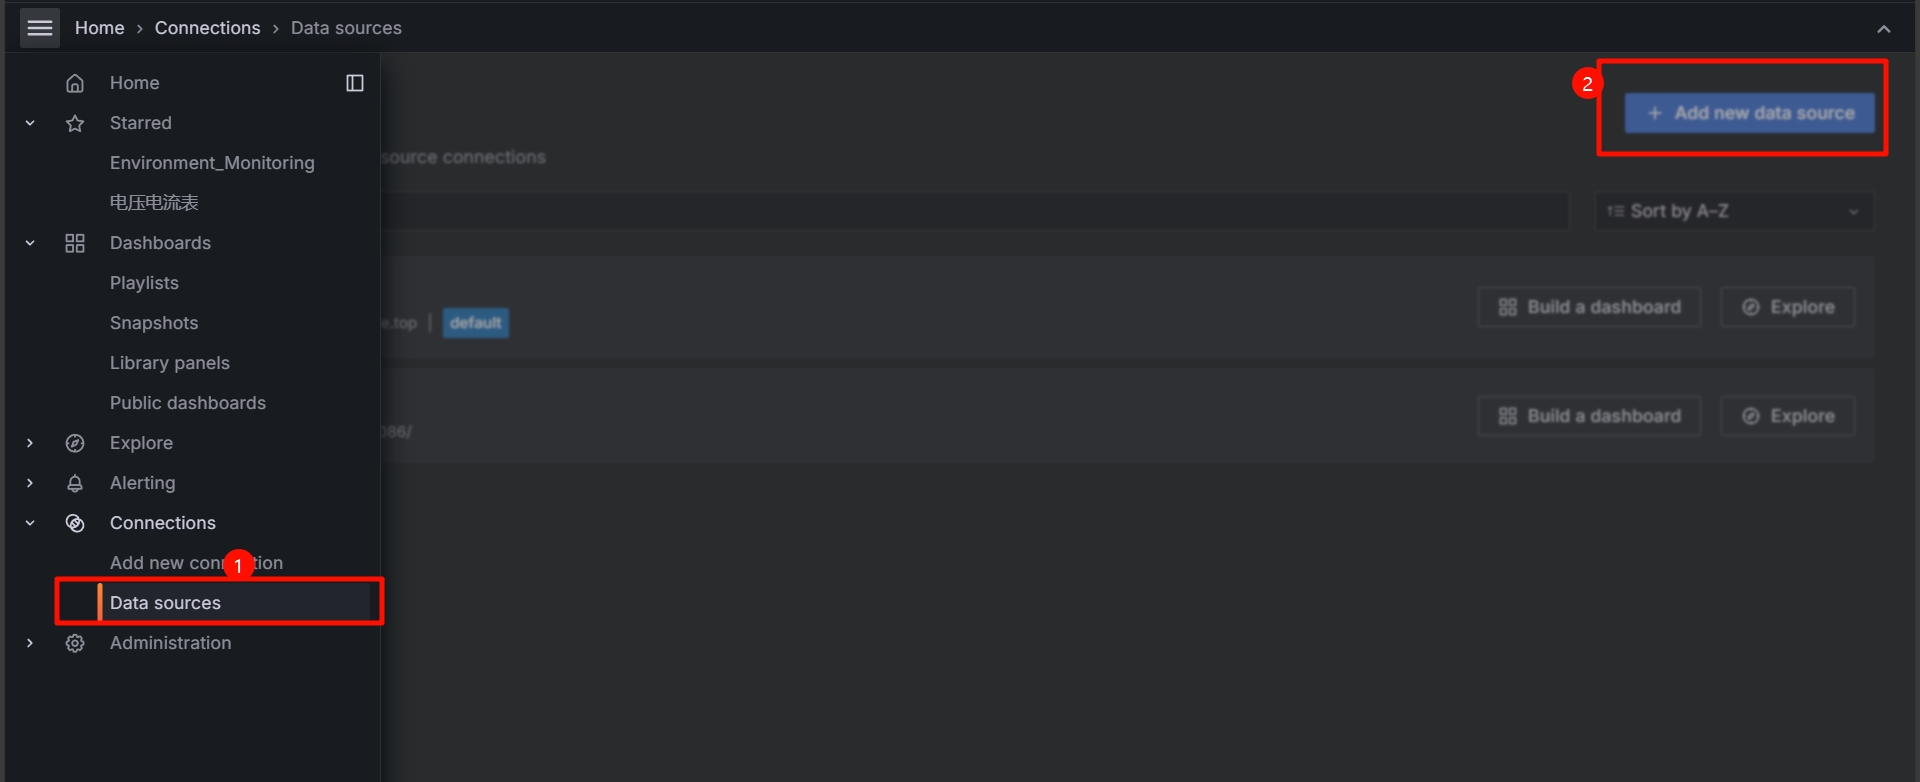
Figure 33 Grafana Add Data Source
Select InfluxDB, and then fill in the following pages as shown in Figures 34 and 35.

Figure 34 Data Source Configuration

Figure 35 Data Source Configuration
(5) Click the "+" sign in the upper right corner of the homepage, select New Dashboard, click Add visualization, and select the data source you just created. Here I will add a voltage curve as a demonstration; the other items are similar.
Return to the InfluxDB backend, in the place where we just queried the data, follow the operation in Figure 36, then copy the area code shown in Figure 37 and paste it into Grafana (Figure 38). Some styles can be adjusted in the right sidebar. After finishing, click Apply and Save.

Figure 36 Data Query Operation

Figure 37 Get Query Statement

Figure 38 Paste query statement
(6) Do the same for current and power using similar operations. See Figures 39a and 39b for the final effect.

Figure 39a Grafana dashboard PC
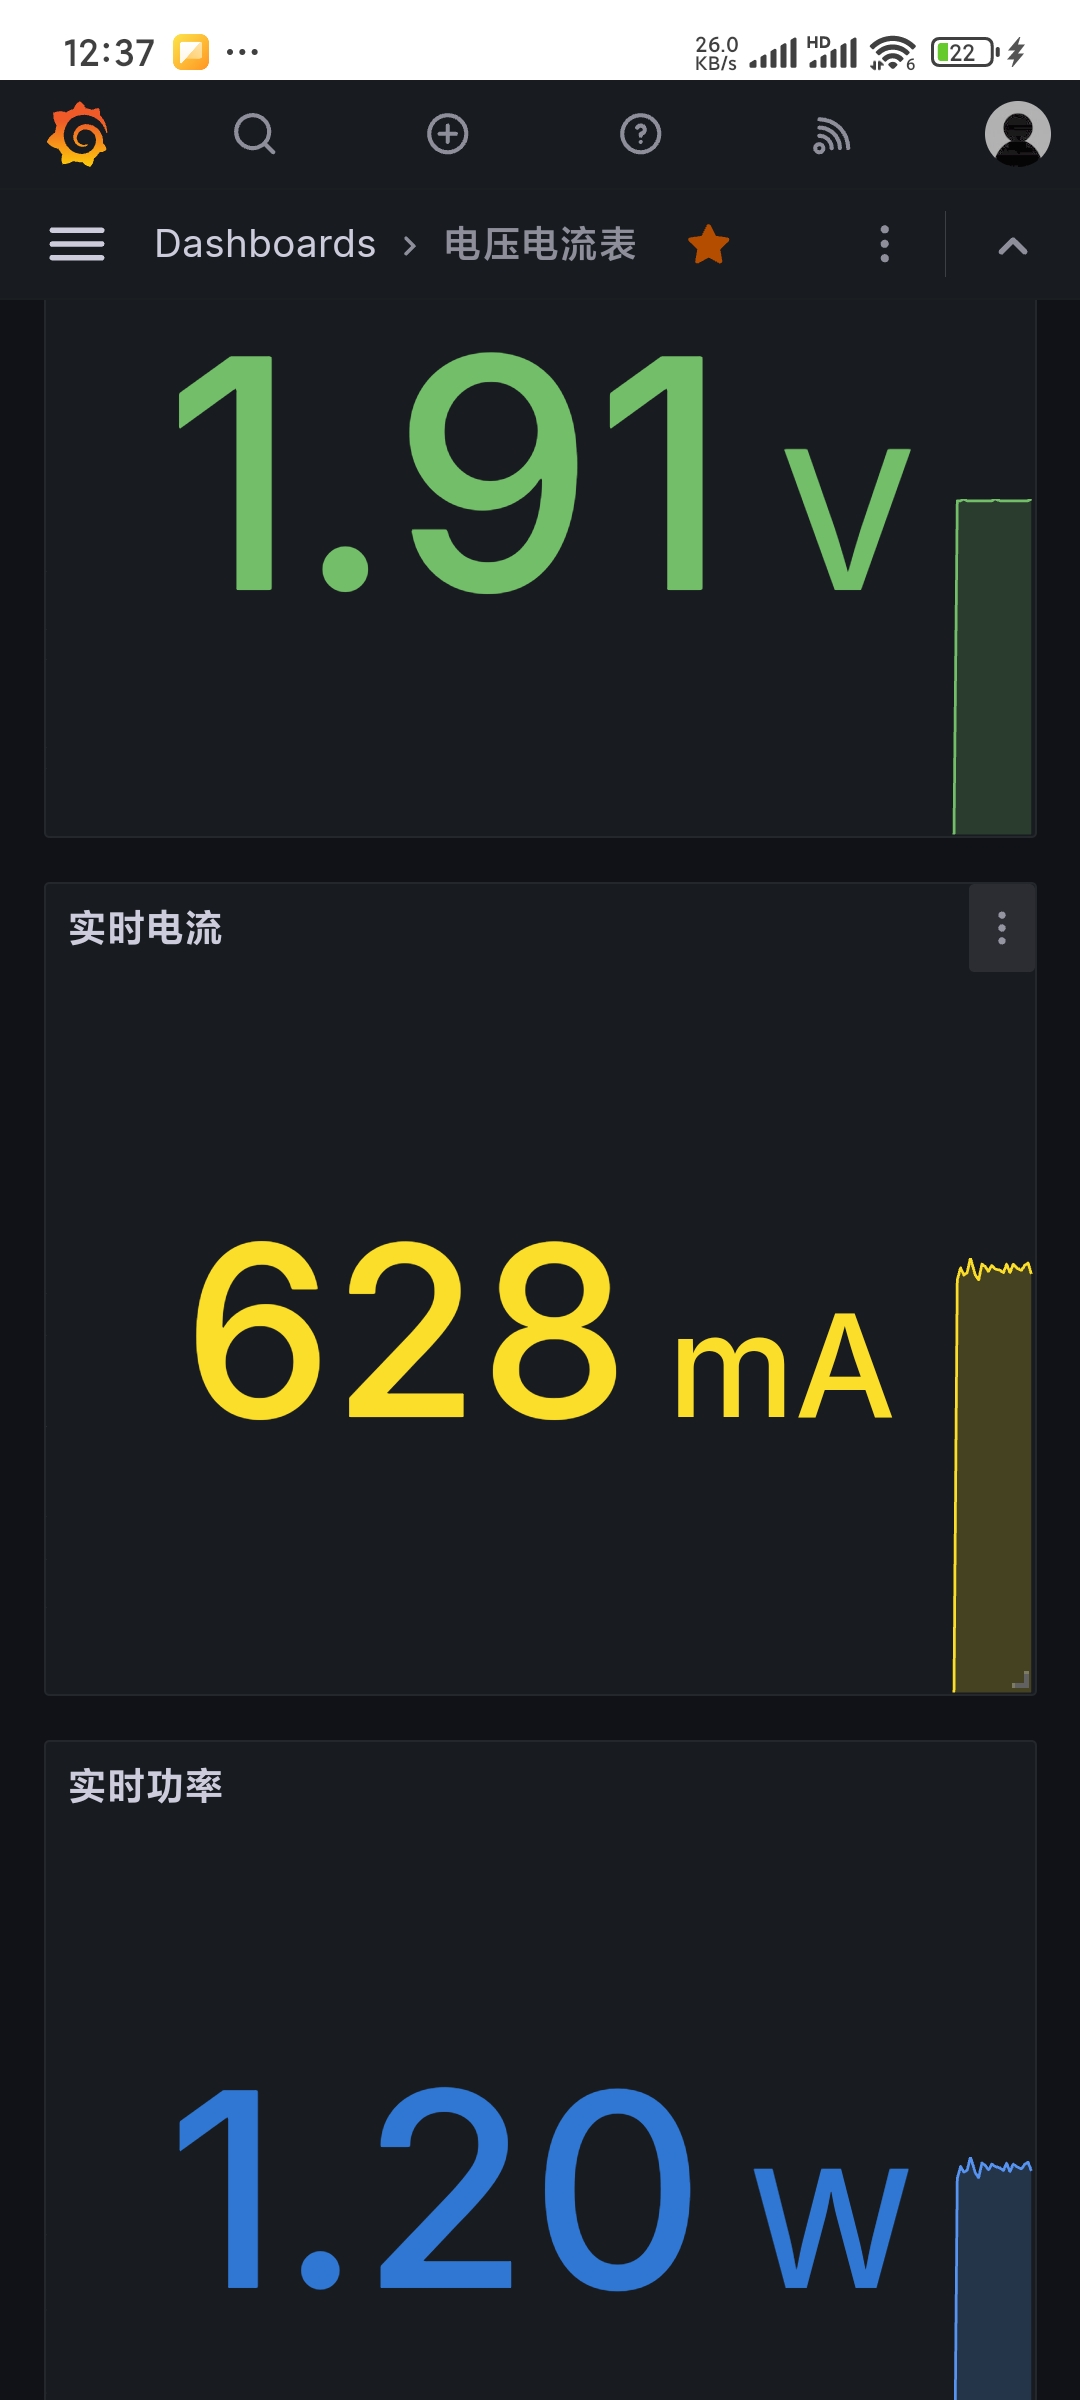
Figure 39b Grafana dashboard mobile
5.
Precautions for ordering the outer shell assembly panel:
Panel type: Acrylic panel
Number of panel styles: Multiple styles, self-made
panel size: 192.78mm 95mm
Number of sets: 1 set
No need to confirm production draft
Transparent acrylic, thickness 1.5mm or 2mm
Printing method: Front
light blocking intensity: Regular
No need for adhesive
After receiving the panel, it needs to be assembled with screws and other fasteners. The materials required are shown in the table below
| Parts | Quantity |
|:---:|:---:|
|M25 flat head screws|8|
|M28 double hexagonal copper pillars|4|
|M2*8+3 single hexagonal copper pillars|8|
|M2 Screw Cap|8|
The assembly positions of each part are shown in Figures 40-42.

Figure 40 Top View
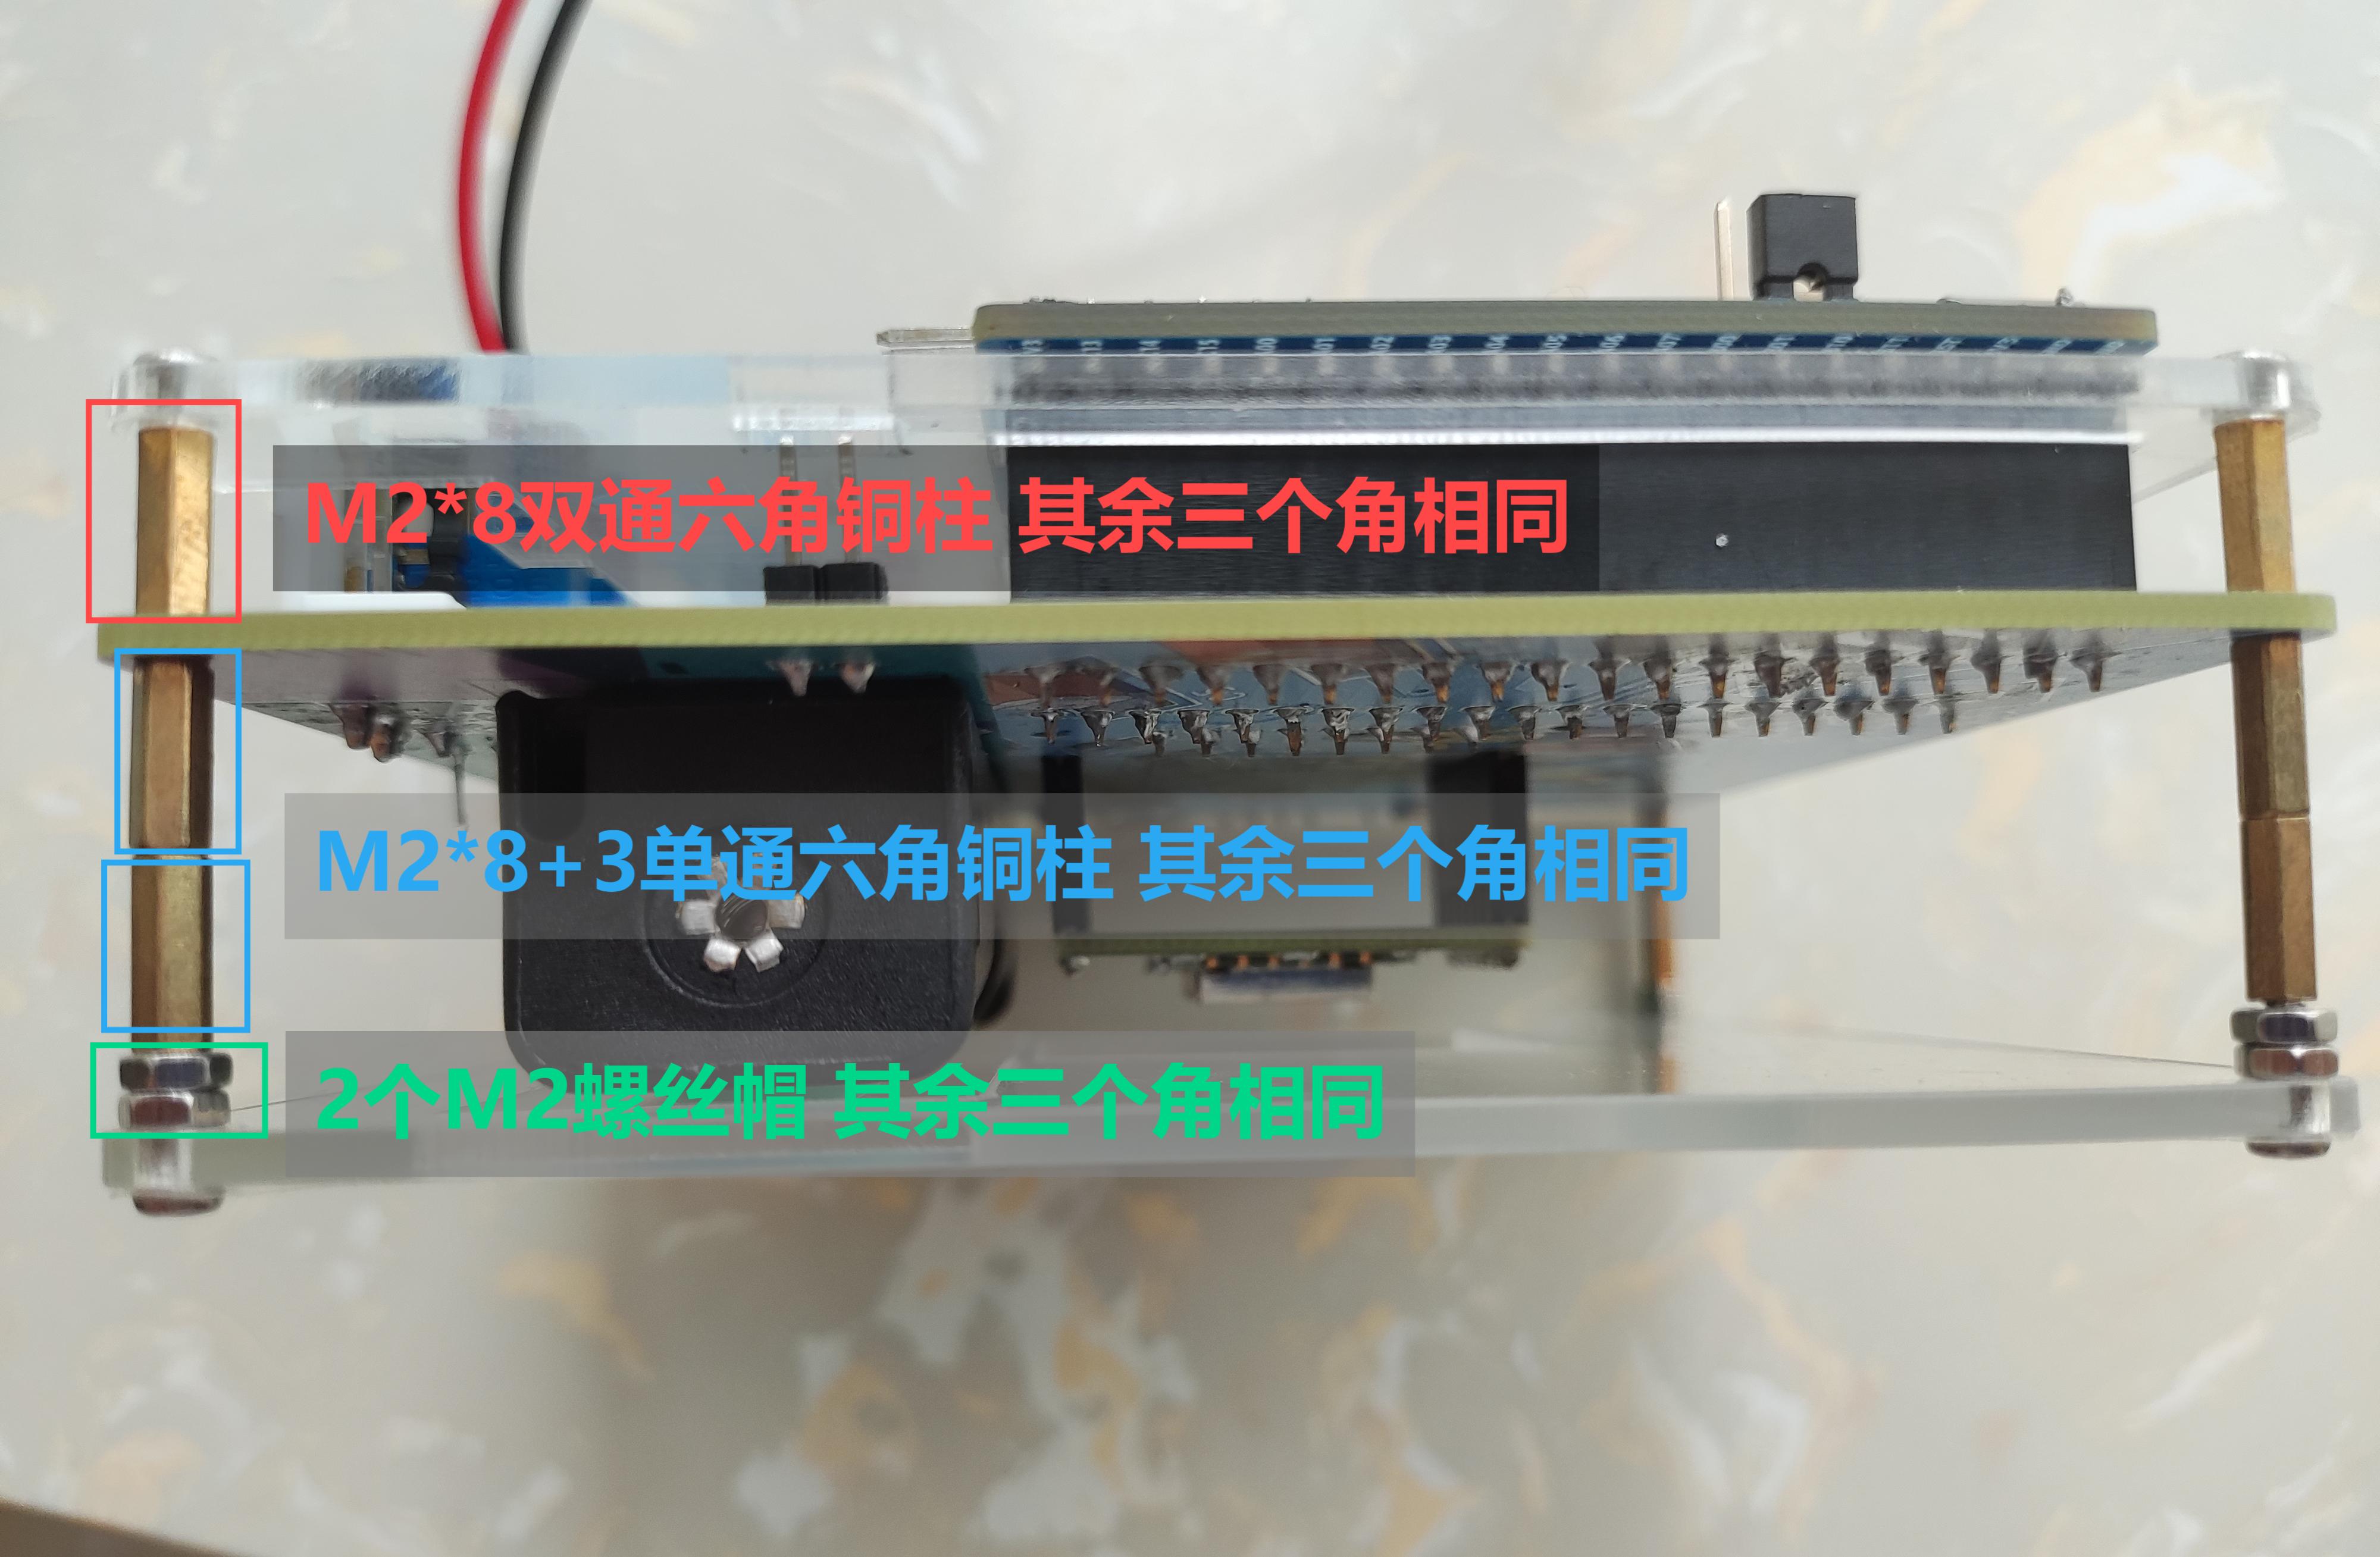
Figure 41 Side View

Figure 42 Bottom View
6 Links
This project is open source on the open source platform: https://oshwhub.com/vrxiaojie/voltage-and-ammeter-based-on-lic
Software code is open source on Github: https://github.com/vrxiaojie/CW32F030C8T6_VAmeter
Software API documentation: https://vrxiaojie.github.io/CW32F030C8T6_VAmeter/files.html
Bilibili: https://space.bilibili.com/11526854
Personal Blog: https://blog.vrxiaojie.top/
7 Open Source License
GPL 3.0
8 High-definition demo video
available on Bilibili: The multi-functional IoT voltage and current meter is based on the LCSC CW32 ESP8266 development board.


 京公网安备 11010802033920号

 1M1616-012-3365-001.7-00-AB-00-0