I. Design Background
An ADC (Analog-to-Digital Converter) is an indispensable key component in electronic systems. It converts continuous analog signals into digital signals, enabling digital processing and analysis. ADCs play a crucial role in signal conversion, measurement and data acquisition, control system input, and communication and signal processing. Their widespread application promotes the intelligent and precise control of electronic equipment across various industries, and is one of the key factors driving modern technological progress.
Digital voltmeters and ammeters combine ADC technology with circuit measurement principles, accurately converting analog voltage and current signals into digital displays for easy reading and analysis by electronic engineers. This device not only improves the accuracy and efficiency of circuit measurements but also helps engineers better understand circuit behavior, serving as a powerful assistant in electronic design and troubleshooting, and playing a vital supporting role in the work of electronic engineers. In product applications, digital voltmeters ensure the accuracy and safety of circuit design, while also providing strong support for product quality control and subsequent maintenance. Learning to design and build a digital voltmeter and ammeter
using a benchtop digital multimeter (Agilent 34401A)
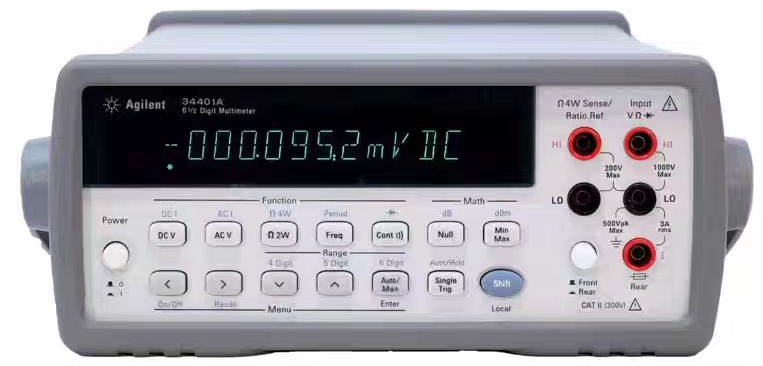
is highly beneficial for improving one's professional skills. This digital voltmeter and ammeter project covers multiple aspects, including the design and implementation of microcontroller circuits, the design of signal acquisition and processing circuits, the development and optimization of user interfaces, and the design of product appearance. It integrates knowledge from multiple fields such as electronic technology, microcontroller programming, circuit design, and industrial design. Considering the learning pace and knowledge absorption capacity of beginners, we have specially launched this introductory-level digital voltmeter and ammeter project, which is very suitable for beginners in electronic technology and those who want to learn more about microcontroller applications. This project has the following highlights:
it adopts a core board plus expansion board design concept and uses plug-in device design, making learning simpler and exploration more in-depth;
the core board uses the domestic Wuhan Xinyuan Semiconductor CW32 as the main controller, while being compatible with other similar development boards; however, the CW32 has advantages.
The project has a high degree of integration and strong practicality, and can be used as a desktop instrument after completion;
the project has rich learning materials, including circuit design tutorials, PCB design, code programming learning, and training of engineers' debugging skills.
II. Hardware Design
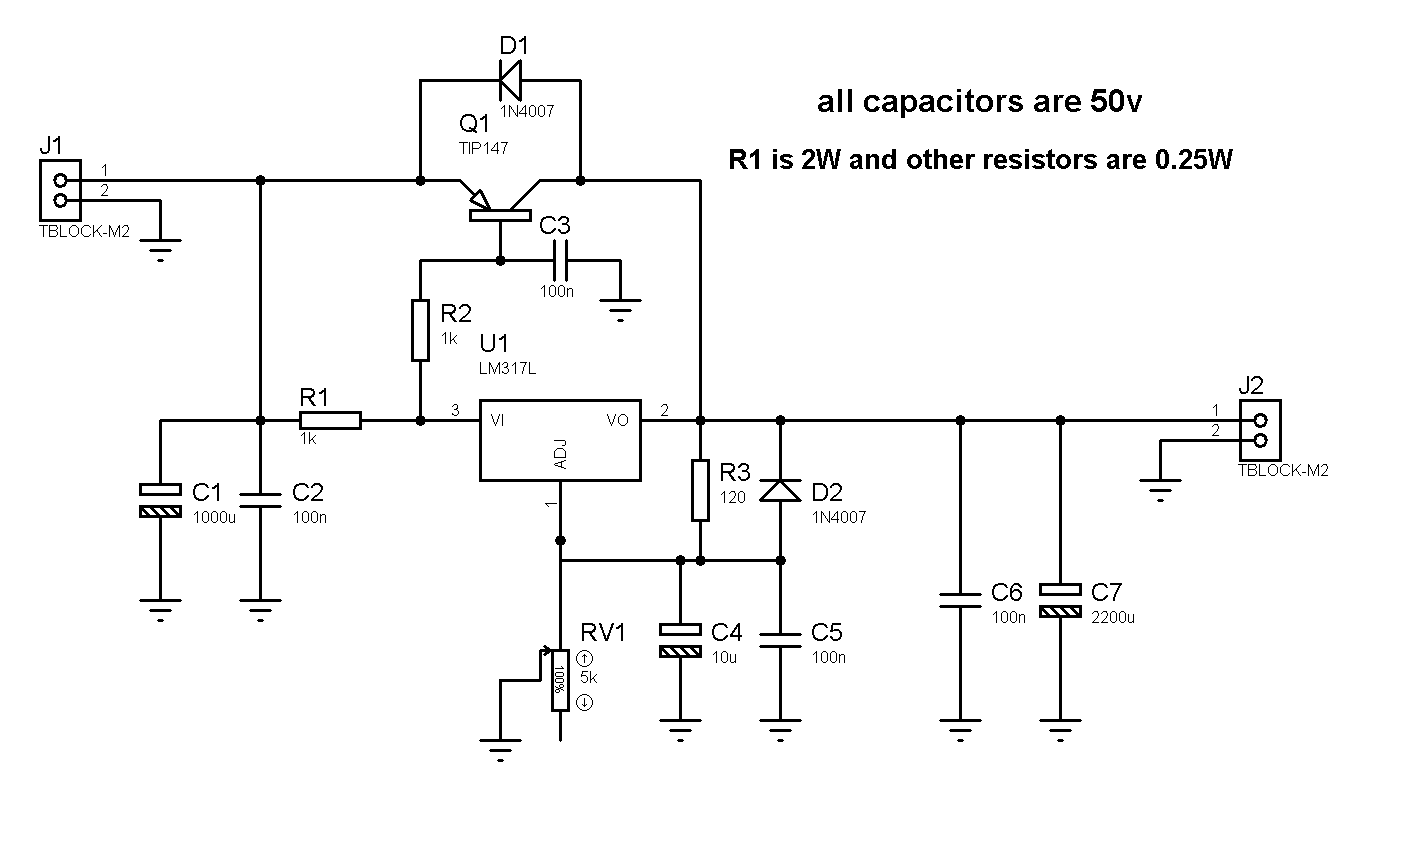
1. Project Schematic
The circuit diagram of this project adopts modular drawing. Different modules are divided into sections using lines in the circuit diagram for easy reading. The circuit diagram will be analyzed module by module below.
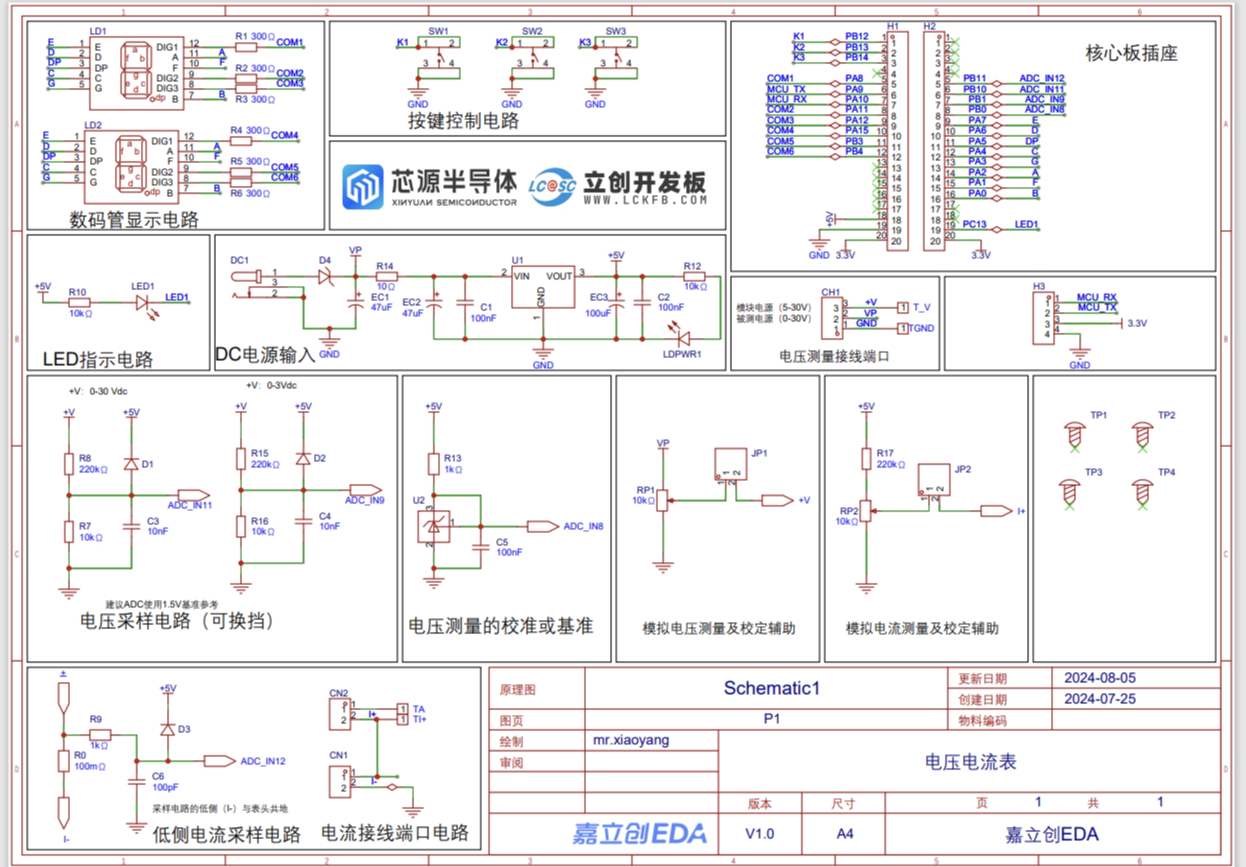
2. Circuit Analysis
1. Power Supply Circuit
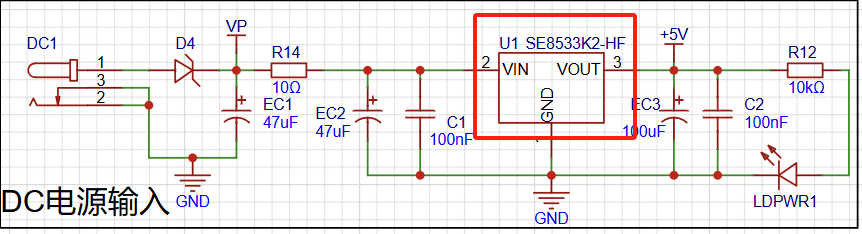
LDO (Low Dropout Linear Regulator) Selection
This project uses an LDO as the power supply. Considering that most voltmeter products are used in industrial scenarios with 24V or 36V power supplies, the
SE8550K2 with a maximum input voltage of up to 40V was selected. The main reason for not using a DC-DC step-down circuit to handle the large voltage drop is to avoid introducing DC-DC
ripple interference during the design process; a secondary reason is to reduce project costs.

Diode Reverse Connection Protection
Considering that high-voltage reverse connection will cause irreversible damage to the module, the voltmeter power supply circuit adopts a series diode scheme for reverse connection protection.
Note: The use of series diodes for reverse connection protection in this project takes into account the operating scenario where the power supply voltage of this equipment is usually higher than 5V, and the 0.7V voltage drop of the diode will not affect
the power supply . When the supply voltage is low, the overall power consumption of the project is low, and the measured supply current is low (20mA). Due to
the unique structure of the Schottky diode D4 (1N5819), its VF is lower than that of general-purpose switching diodes, as shown in the figure below, with a voltage drop of approximately 0.2V or less.


The role of the series small resistor (10Ω):
This project additionally uses a series small resistor (10Ω) for voltage division. On the one hand, this reduces
the problem of severe overheating of the LDO due to the large voltage difference under high voltage conditions. On the other hand, it utilizes the principle that the series 10-ohm low-power resistor has low overcurrent,
acting as a low-resistance fuse, providing overcurrent or short-circuit protection. (The point about using a resistor as a fuse is that, because the resistor is in an overcurrent state and in a heated state, it is 99% likely to be an open circuit; it will almost never short-circuit. Its fault
analysis determines that it is primarily an open circuit—that is, it burns out, not short-circuited.)
The series small resistor (10Ω) also reduces the peak value of the power-on surge, preventing excessive surge damage to the LDO.
If electrolytic capacitors are not used, a small series resistor (10Ω) can also prevent the inductance of the wires and the ceramic capacitor from resonating during hot-plugging. Because ceramic capacitors
have very low ESR, the damping in the LC network is very low, resulting in a high gain at the resonant point. Adding an external resistor to provide damping can suppress
the gain .
2. MCU Selection
This project uses the LCSC CW32F030C8T6 development board (core board) as the main controller, which is easy for beginners to learn from. The CW32 development board documentation can be used for learning.
Chapter materials download link
: https://pan.baidu.com/s/1erHWOS6Gej_82cJVNF_jdw?pwd=LCKF Extraction code: LCKF
Since this project involves a current and voltage meter, sampling via an ADC is required, necessitating a certain level of accuracy. The CW32's key advantages in this project include:
Wide operating temperature range: -40~105℃;
Wide operating voltage range: 1.65V~5.5V (STM32 only supports 3.3V systems)
; Strong anti-interference: HBM ESD 8KV; All ESD reliability reaches the highest international standard level (STM32 ESD 2KV);
Project focus - Better ADC: 12-bit high-speed ADC, achieving ±1.0LSB INL 11.3ENOB; Multiple Vref reference voltages (STM32 only supports VDD=Vref);
Stable and reliable eFLASH technology. (Flash0 pending).
Key characteristics of the CW32 ADC
: This project requires a focus on 4 reference voltage sources. Content from the "CW32x030 User Manual"

3. Voltage Sampling Circuit
This project uses a voltage divider circuit to achieve high voltage acquisition. The designed voltage acquisition voltage is 100V, and the current configuration acquisition voltage is 0-30V.

The voltage divider resistors in this project are designed to be 220K+10K, therefore the voltage division ratio is 22:1 (ADC_IN11).
Voltage Divider Resistor Selection
1. The maximum value of the designed measurement voltage is 30V for safety reasons (the actual maximum display value can be 99.9V or 100V);
2. The ADC reference voltage is 1.5V in this project, which can be configured through the program;
3. To reduce the power consumption of the sampling circuit, the low-side resistor (R7) is usually selected as 10K based on experience;
then the high-side resistance of the voltage divider resistor can be calculated using the above parameters:
1. Calculate the required voltage division ratio: i.e., ADC reference voltage: design input voltage. Using known parameters, 1.5V/30V = 0.05
2. Calculate the high-side resistance: i.e., the low-side resistance/voltage divider ratio. Using the known parameters, we can calculate 10K/0.05=200K.
3. Select a standard resistor: Select a resistor with a value slightly higher than the calculated value. The calculated value is 200K. We usually choose E24 series resistors. Therefore, in this project, we choose 220K, which is greater than 200K and the closest.
If, in practical use, the voltage to be measured is lower than 2/3 of the module's design voltage (66V), the voltage divider resistor can be replaced and the program modified to improve measurement accuracy. An example is provided below:
1. Assume the measured voltage is no higher than 24V, and other parameters remain unchanged
. 2. Calculations show 1.5V/24V = 0.0625, 10K/0.0625 = 160K. 160K is a standard E24 resistor and can be directly selected, or a higher value 180K can be chosen with some redundancy.
If, in practical use, the voltage to be measured is higher than the module's 99V design voltage, the voltage divider resistor can be replaced, or the reference voltage can be modified to achieve a larger voltage measurement range. An example is provided below:
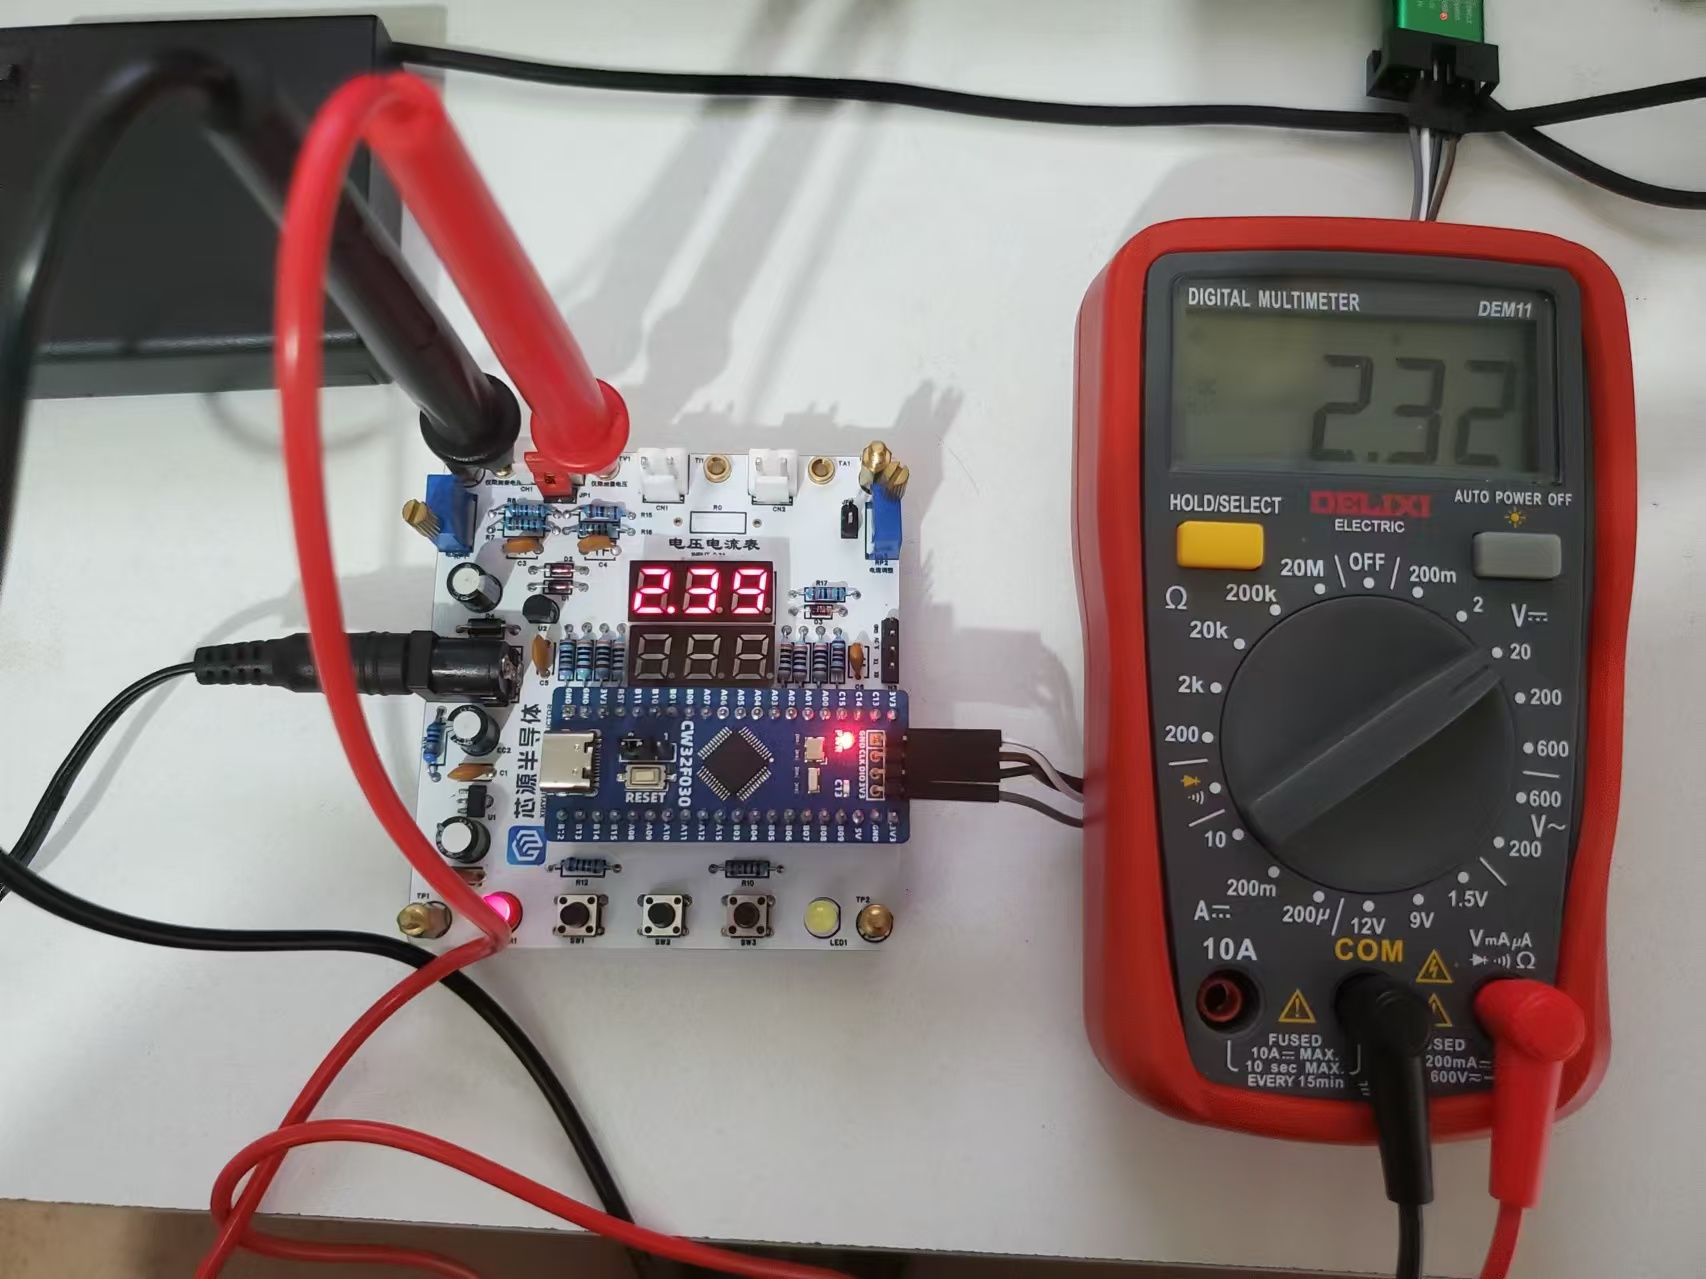
1. Assuming the measured voltage is 160V, the solution is to increase the voltage reference to expand the measurement range.
2. Given that the voltage division ratio of the selected resistor is 0.0145, we can calculate 160V * 0.0145 = 2.32V using the formula. Therefore, we can choose a 2.5V voltage reference to achieve the range expansion (expanding the range will reduce accuracy).
Considering the potential fluctuations in the measured power supply, a 10nF filter capacitor is connected in parallel with the low-side voltage divider resistor in the circuit design to improve measurement stability.
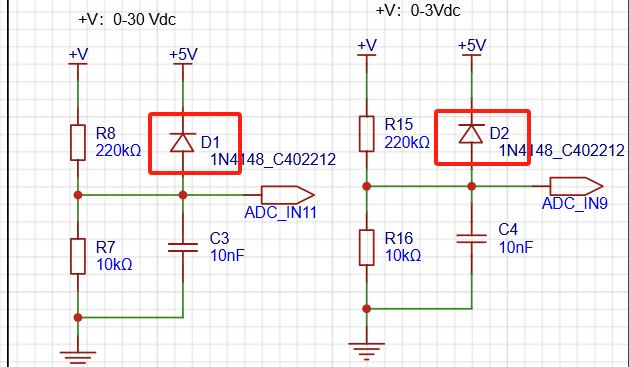
Diode clamping ensures MCU safety.
In designing this project, I added an additional 1N4148 (D1, etc.) as a clamping diode to the sampling circuit. This is to avoid
damage to the chip pins due to incorrect voltage input during learning and debugging. Diode clamping is an important electronic circuit design technique. Its main function is to protect the circuit by
limiting the voltage amplitude, preventing damage or malfunction caused by excessively large or small signals.
Clamping in circuits refers to limiting voltage, while diode clamping specifically refers to the technique of using a diode to limit the potential at a certain point in the circuit.
Diode clamping primarily utilizes the unidirectional conductivity of diodes. When the positive voltage of a diode is greater than its negative voltage and it conducts, the voltage across the diode is limited to
its voltage drop across the diode, typically around 0.7V for a silicon diode.
The clamping process involves forcibly pulling the clamped potential towards the reference terminal through the diode's clamping action, thus limiting the potential. Clamping does not alter the original signal
waveform; it merely raises or lowers the reference potential.
Depending on the diode connection method, clamping circuits can be divided into positive clamping circuits and negative clamping circuits. This project only designs a positive clamping circuit.
- Positive Clamping Circuit: When the positive terminal of the diode is grounded, it is a positive clamping circuit. During the positive half-cycle, the diode is cut off; during the negative half-cycle, the diode conducts, and
the capacitor is charged to a certain voltage, limiting the output voltage within a certain range.
- Negative Clamping Circuit: When the negative terminal of the diode is grounded, it is a negative clamping circuit. The working principle is the opposite of the positive clamping circuit. The components labeled T_V and T_GND next to
the circuitry used for simulating voltage measurement, calibration, and measurement assistance are
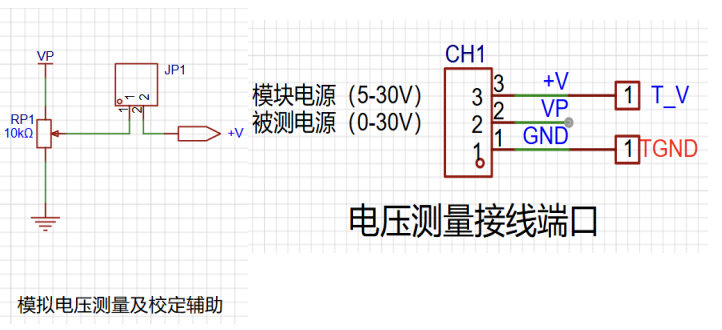
the 2mm banana plug connectors on the development board, used to connect multimeter probes. You can insert the probes of a multimeter or a high-precision benchtop digital multimeter to verify the accuracy of the development board's measurements. Alternatively, you can insert 2mm banana plug multimeter probes to replace the CH1 port for handheld measurements.
The VP pin is the power supply pin for the development board and should not be connected when using the DC port. When not using the DC port for power and the measured value is greater than 5V and less than 30V, you can connect it to the power supply under test, or it can be powered independently.
Use the multi-turn adjustable potentiometer (RP1) to divide the development board's power supply voltage and connect it to the +V network through the development board's internal circuitry. Note that JP1 needs to be shorted in this case; a jumper cap is sufficient, and a long-handled jumper cap is recommended. Do not short JP1 if this function is not used.
4. Current Sampling Circuit
This project uses a low-side current sampling circuit for current detection. The low-side of the sampling circuit shares a common ground with the development board's meter interface.

Analysis:
The sampling current designed for this project is 3A, and the selected sampling resistor (R0) is 100mΩ.
The selection of the sampling resistor mainly needs to consider the following aspects:
1. The maximum value of the pre-designed measurement current, which is 3A in this project.
2. The voltage difference caused by the current sensing resistor, which is generally not recommended to exceed 0.5V.
3. The power consumption of the current sensing resistor; a suitable package should be selected based on this parameter. Considering the power consumption (temperature) issue under high current, a 1W metal wire-wound resistor was selected in this project.
4. The amplification factor of the voltage across the current sensing resistor: No operational amplifier is used to build the amplification circuit in this project, so the amplification factor is 1. The
current sensing resistor value can then be calculated using the above parameters.
1. Since this project does not use an amplifier circuit, a larger sampling resistor is needed to obtain a higher measured voltage for measurement.
2. Considering that a larger resistor would result in a larger voltage drop and higher power consumption, an unlimited selection of a larger resistor is not advisable.
3. This project uses a 1W packaged resistor, corresponding to a power consumption of 1W. Based on the
above data, a 100mΩ current sensing resistor was chosen. According to the formula, 3A * 100mΩ = 300mV, 900mW
is used to simulate current measurement, measurement calibration, and auxiliary circuitry for measurement calibration.

When using this function, do not solder the R0 sampling resistor. If this function is not used, disconnect JP2.
The essence of current sampling is to collect the voltage drop across the sampling resistor when current flows through it, i.e., the collected voltage value. This circuit uses RP2 to provide a
voltage value in the range of 0~0.238V (5V ÷ 210K * 10K), which is connected to the chip's current sampling pin via the I+ network.
In practical use, the voltage at I+ is simulated as the voltage drop across the unsoldered 100mΩ sampling resistor. At this point, the simulated measured current value I
measured = the voltage value Vi+ ÷ 100mΩ, which
is also exactly equal to the measured voltage value multiplied by 10. That is, it provides a simulated current measurement range of 0~2.38A.
Set a multimeter or high-precision benchtop digital multimeter to the voltage measurement port, with a range within 3V. Insert the black negative probe into
the T_GND interface next to the voltage measurement terminal, and the red positive probe into the TI+ port for current measurement to measure the actual voltage value of I+. Therefore, this circuit can not only
complete the above design tasks but also allow for a direct test to experience the accuracy of the MCU's ADC peripheral. You can write your own program to verify this.
5. Digital Tube Driver Circuit
This project uses a digital tube as the display unit.
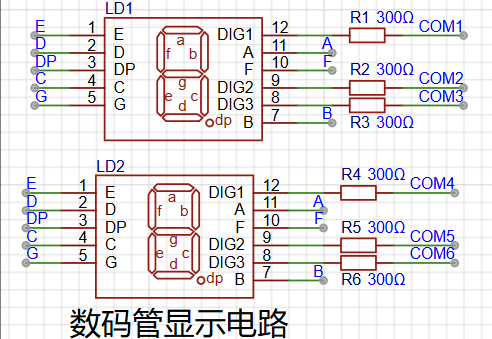
This project uses two 0.28-inch three-digit common-cathode LED displays as display devices. Compared to displays, LED displays offer better visibility in complex environments. The brightness of the LED displays can be increased by using smaller current-limiting resistors, depending on the specific needs of the application environment. Furthermore, LED displays have better mechanical properties and are less susceptible to damage from external forces than displays. They are commonly used in industrial applications requiring stability and reliability. From a development board learning perspective, this makes it easier to learn electronic measurement principles and related development in a targeted manner.
In this project, actual testing showed that the current-limiting resistors (R1~R6) for the LED displays were configured to 300Ω. The corresponding brightness for both red and blue LED displays was good, and the brightness was soft and not glaring.
Strictly speaking, the current-limiting resistors should be added to the segments; adding them to the digits would affect the display effect. Our design places them in the digits to save a few resistors, but the impact on the display is not significant. Therefore, we add them to the digits for convenience.
6. Indicator Circuit
This project also includes a power indicator and an I/O operation indicator.
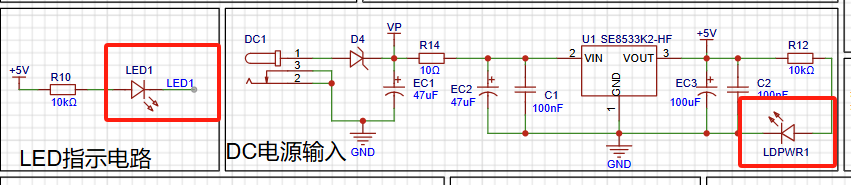
Since chip I/O often has a greater current sinking capability than current pulling capability, LED1 is designed to be active low (on). To reduce the current consumption of the LED, some LED brightness is sacrificed, the number of device parameters is reduced, and the current limiting resistor for the LED is chosen to be 10K.
7. Button Circuit

The button control circuit has various design methods. Thanks to the fact that the CW32's I/O port can be configured with pull-up and pull-down resistors internally, the button control circuit on the outside of the chip does not need to be configured. One end of the button is connected to the MCU's I/O, and the other end is grounded. When the button is pressed, the I/O is pulled low.
8. TL431 Circuit Design for Voltage Measurement and Calibration
This project adds an extra TL431 circuit to provide a 2.5V reference voltage, which can be used to provide an external voltage reference for the chip to calibrate the AD. From a product design perspective, due to the inherent ADC performance advantages of the CW32, this circuit is not necessary. This circuit is designed on the development board for learning the relevant application principles.

The TL431 is a relatively "old" device, very classic, widely used, and still found in many electronic products today.
Many beginners may be encountering this device for the first time, so I'll briefly explain its principles to help you better apply the TL431.
TI defines it as a "Precision Programmable Reference," and we can focus on several key characteristics on the first page of the references.
**Precision:** Precision indicates its highly accurate output voltage. I used a ±0.5% accuracy TL431, which measured 2.495V on the board at room temperature. This is a world of difference in accuracy compared to common Zener diodes. In application circuit diagrams, the TL431 is represented internally by a Zener diode symbol. **
Adjustable Output Voltage:** The adjustable output voltage is between Vref and 36V. In our project, we use the output Vref voltage, which is approximately 2.5V. Therefore, we use 2.5V in the description, which is approximately equal to Vref. **
Sinking Current Capability:** This refers to how much current the output voltage pin can provide, which is greatly influenced by the resistance (R13) in the application circuit. It should not be less than 1mA. If there is no need for sinking current, avoid designing the current too high to prevent unnecessary power consumption.
For detailed selection information, please watch the Bilibili training camp video
[Step-by-step guide to making a voltmeter and ammeter: 6.1 Hardware - TL431 circuit design for ADC measurement and calibration - TL431 related knowledge and principles] https://www.bilibili.com/video/BV1fm421g7rG?vd_source=06cecaca23249686a7e70301a347232a
III. Software Design
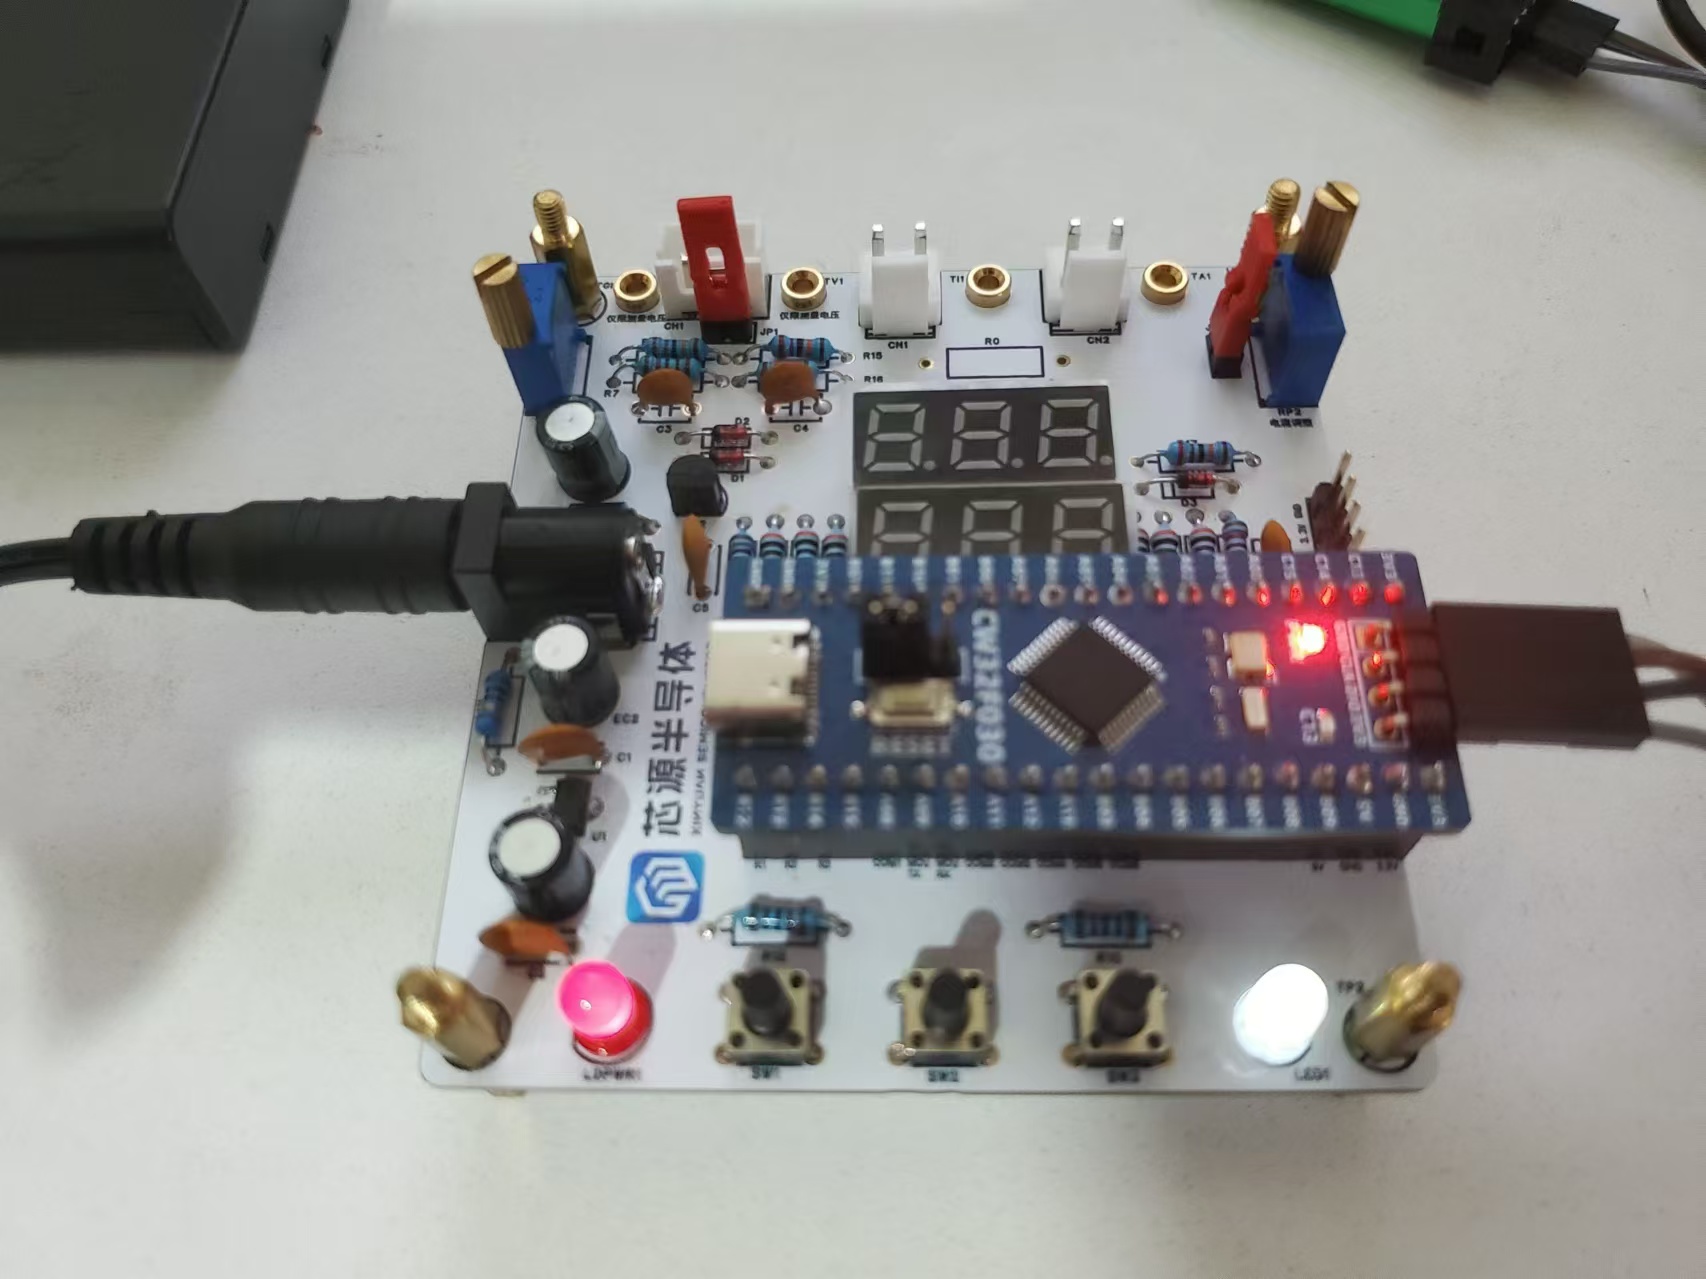
1. Experiment 1: LED Light Driver
The white light in the diagram is the control indicator for this experiment, which is an experiment to light up an LED.
Experiment 1: Experiment
Project Code
Link (with attached video): https://pan.baidu.com/s/1_Bp2aMDVo4oCAdDNNd18gw?pwd=LCKF Extraction Code: LCKF
2. Experiment 2: Button Test
Experiment Project Code Link
(with attached video ): https://pan.baidu.com/s/1yZTJBB3CLjEV1fUYAFA_nQ?pwd=LCKF Extraction Code: LCKF 3. Experiment 3: Digital Tube Display Experiment Project Code Link (with attached video): https://pan.baidu.com/s/1y-mlOgOIGsEFkSR_bjhCfQ?pwd=LCKF Extraction Code: LCKF 4. Experiment 4: Digital Tube Dynamic Display Experiment Project Code Link (with attached video): https://pan.baidu.com/s/1qvaiHRyza_Pw9WhpBqSewQ?pwd=LCKF Extraction Code: LCKF 5. Experiment Five: ADC Sampling Experiment Effect Diagram. Adjusting the potentiometer on the left can change the internal sampling voltage value as a test reference. The final result is shown below. Experiment project code link: https://pan.baidu.com/s/12eB_02H6dI1J7pwZ_0llhg?pwd=LCKF Extraction code: LCKF. Since the voltage and current meters are not yet calibrated, due to system errors, the displayed data still has some deviation. Calibration and debugging tutorials are provided later. 6. Experiment Six: Mean Filtering. 1. Common Filtering Algorithms. In embedded software development, there are various commonly used software filtering signal algorithms, each with its specific application scenarios and advantages and disadvantages. Here are some common software filtering algorithms: 1. Amplitude Limiting Filtering Method (also known as Program Judgment Filtering Method) : Method: Based on experience, determine the maximum allowable deviation value between two samples (let's call it A). Each time a new value is detected, judge whether the difference between the current value and the previous value is less than or equal to A, then the current value is valid; if it is greater than A, then the current value is invalid, discard the current value, and replace it with the previous value. Advantages: Effectively overcomes pulse interference caused by random factors. Disadvantages: Cannot suppress periodic interference, poor smoothness. 2. Median filtering method: Sample N times consecutively (N is an odd number), arrange the N sampled values in order of magnitude, and take the median value as the effective value. Advantages: Effectively overcomes fluctuation interference caused by random factors, and has a good filtering effect on measured parameters that change slowly, such as temperature and liquid level. Disadvantages: Not suitable for parameters that change rapidly, such as flow rate and speed. 3. Arithmetic mean filtering method : Take N sampled values consecutively and perform an arithmetic mean calculation. When the value of N is large, the signal smoothness is high but the sensitivity is low; when the value of N is small, the signal smoothness is low but the sensitivity is high. Advantages: Suitable for filtering signals with general random interference.
Disadvantages: Not suitable for real-time control with slow measurement speed or high data calculation speed, and it wastes RAM. 4. Recursive average filtering method (also known as moving average filtering method)
: Treat N consecutive sampled values as a queue with a fixed length of N. Each time a new data is sampled, it is placed at the tail of the queue, and the data at the head of the queue is discarded (first-in, first-out principle). The arithmetic mean of the N data in the queue is calculated to obtain the new filtering result.
Advantages: Good suppression of periodic interference, high smoothness, suitable for high-frequency oscillation systems.
Disadvantages: Low sensitivity, poor suppression of occasional pulse interference, not suitable for occasional pulse interference, and wastes RAM. 5. Median average filtering method (also known as anti-pulse interference average filtering method)
: Equivalent to "median filtering method" + "arithmetic average filtering method". N consecutive data are sampled, one maximum value and one minimum value are removed, and then the arithmetic mean of N-2 data is calculated.
Advantages: Combines the advantages of two filtering methods, and can eliminate sampling value deviations caused by occasional pulse interference.
Disadvantages: Slow measurement speed, relatively wasteful of RAM. 6. Amplitude Limiting Averaging Filtering
Method: Equivalent to "Amplitude Limiting Filtering Method" + "Recursive Averaging Filtering Method". Each new sampled data is first amplitude limited, and then sent to the queue for recursive averaging filtering.
Advantages: Combines the advantages of two filtering methods, and can eliminate sampling value deviations caused by occasional pulse interference.
Disadvantages: Relatively wasteful of RAM. 7. First-Order Lag Filtering
Method: Take a = 0~1, the current filtering result = (1-a) current sampled value + a previous filtering result.
Advantages: Has a good suppression effect on periodic interference, suitable for occasions with high fluctuation frequency. Disadvantages:
Phase lag, low sensitivity, the degree of lag depends on the value of a, cannot eliminate interference signals with a filtering frequency higher than 1/2 of the sampling frequency. 8. Weighted Recursive Averaging Filtering Method
: An improvement on the recursive averaging filtering method, that is, data at different times are given different weights. Generally, data closer to the current moment has a larger weight.
Advantages: Suitable for objects with large pure time delay constants and systems with short sampling periods.
Disadvantages: For signals with small pure time delay constants, long sampling periods, and slow changes, it cannot quickly reflect the severity of the current interference, resulting in poor filtering effect. 9. Debouncing Filtering Method
: Set a filter counter and compare each sampled value with the current valid value. If the sampled value equals the current valid value, the counter is reset to zero; otherwise, the counter is incremented by 1, and it is determined whether the counter is greater than or equal to the upper limit N (overflow). If the counter overflows, the current value replaces the current valid value, and the counter is reset.
Advantages: It has a good filtering effect on slowly changing measured parameters and can avoid repeated on/off switching of the controller or numerical jitter on the display near critical values.
Disadvantages: Not suitable for rapidly changing parameters; if the value sampled at the time of counter overflow happens to be an interference value, the interference value will be imported into the system as a valid value.
Change font color by modifying the hexadecimal color system.
2. Mean Filtering
: Mean filtering, also known as linear filtering, mainly uses the neighborhood averaging method. The basic principle of linear filtering is to replace the pixel values in the original image with the mean. Specifically, for the current pixel (x, y) to be processed, a template is selected, composed of its nearest neighbors. The mean of all pixels in the template is calculated, and this mean is then assigned to the current pixel (x, y) as the gray level g(x, y) of the processed image at that point. That is, g(x, y) = ∑f(x, y)/m, where m is the total number of pixels in the template, including the current pixel.
This is a method used in digital image processing, but it can also be applied to the ADC sampling data of our digital voltmeters and ammeters. We select twenty ADC sampling values and store them in the array Volt_Buffer. Then, we remove the maximum and minimum values from the array and take the average. The resulting value is displayed on the digital tube. This method can obtain more accurate and less volatile data.
The program can be slightly modified from Experiment 5. First, add and modify the following variables:
uint16_t Volt_Buffer[ADC_SAMPLE_SIZE]; // Store ADC sample values
uint16_t Cal_Buffer = 0; // Intermediate variable for voltage calculation
uint32_t Led_Dis_Time; // Time counter for the function, running once every 300ms
Next is the ADC sampling function, which is executed in the timer interrupt service routine of BTIM1. This interrupt service routine executes once every 1ms, and the function's effect is to obtain the raw ADC sample value once every 1ms and store it in the Volt_Buffer[ADC_SAMPLE_SIZE] array.
{
static uint8_t adc_cnt; // Define static local variable
ADC_GetSqr0Result(&Volt_Buffer[adc_cnt]); // Get the raw sampled value of the ADC
adc_cnt++;
if(adc_cnt >= ADC_SAMPLE_SIZE) // After sampling 20 times, start from 0 again
{
adc_cnt = 0;
}
}
{
static uint32_t Cnt;
/* USER CODE BEGIN */
if (BTIM_GetITStatus(CW_BTIM1, BTIM_IT_OV))
{
BTIM_ClearITPendingBit(CW_BTIM1, BTIM_IT_OV);
Get_ADC_Value(); // Run the sampling function
ADC_GetSqr0Result(&Volt_Buffer);
Cnt++;
if (Cnt > 2)
{
// Display one digital tube every 3ms
Cnt = 0;
Display_Refresh();// Digital tube scanning display
}
}
/* USER CODE END */
}
The following is the main function for mean filtering:
{
uint32_t sum = 0;
uint16_t max = 0;
uint16_t min = 0xffff;
int i;
for(i = 0; i < size; i++) // Traverse the array to find the maximum and minimum values
{
sum += value[i];
if(value[i] > max)
{
max = value[i];
}
if(value[i] < min)
{
min = value[i];
}
}
sum -= max + min; // Subtract the maximum and minimum values and then calculate the average
sum = sum / (size - 2);
return sum;
}
In the main function, recalculate the sampled and displayed values, and make the calculation run once every 300ms to prevent the digital tube from frequently changing the displayed values so that the human eye cannot distinguish the displayed numbers.
{
RCC_Configuration(); // Clock initialization
Seg_Configuration(); // Digital tube initialization
Btim1_Configuration(); // BTIM1 initialization
ADC_Configuration(); // ADC initialization
while(1)
{
if(GetTick() >= (Led_Dis_Time + 300)) // Change the digital tube display value every 300ms
{
Led_Dis_Time = GetTick();
Cal_Buffer = Mean_Value_Filter(Volt_Buffer,ADC_SAMPLE_SIZE);
Cal_Buffer = (Cal_Buffer * ADC_REF_VALUE >> 12) * (R2 + R1)/R1;
if(Cal_Buffer % 10 >= 5)Cal_Buffer = Cal_Buffer / 10 + 1; // Rounding
else Cal_Buffer = Cal_Buffer / 10; // The value at this time is 100 times the standard value
Dynamic_Display(Cal_Buffer);
}
}
It
is important to note that when calling GetTick() to obtain the system counter value, an initialization function needs to be added at the clock initialization point; otherwise, the counter value cannot be obtained.
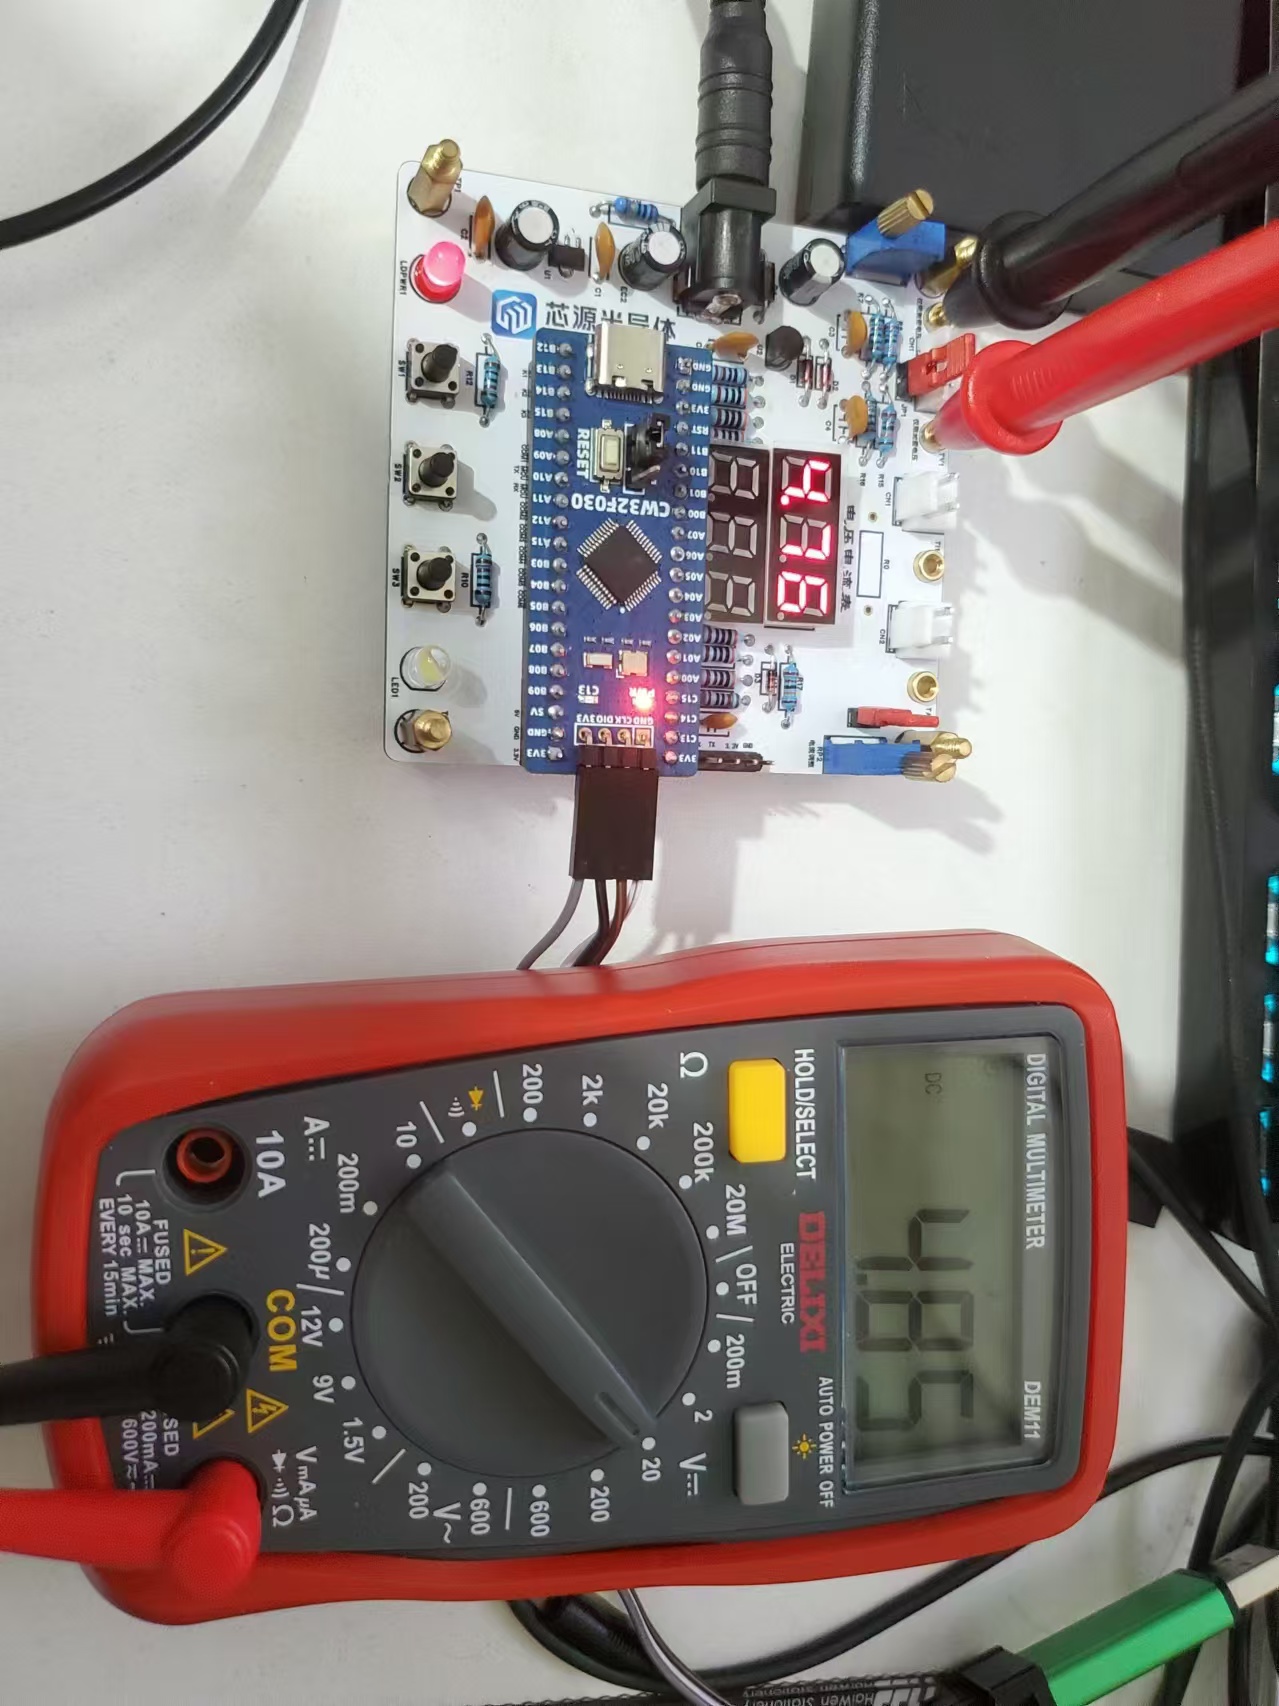
The final result is shown below. Compared with the previous result, the value displayed on the digital tube is more stable, filtering out the influence of interference on the MCU's operation.
Experimental effect diagram
Experimental project code
link: https://pan.baidu.com/s/1EZYiXBcDvlZBYspcixOB2Q?pwd=LCKF Extraction code: LCKF
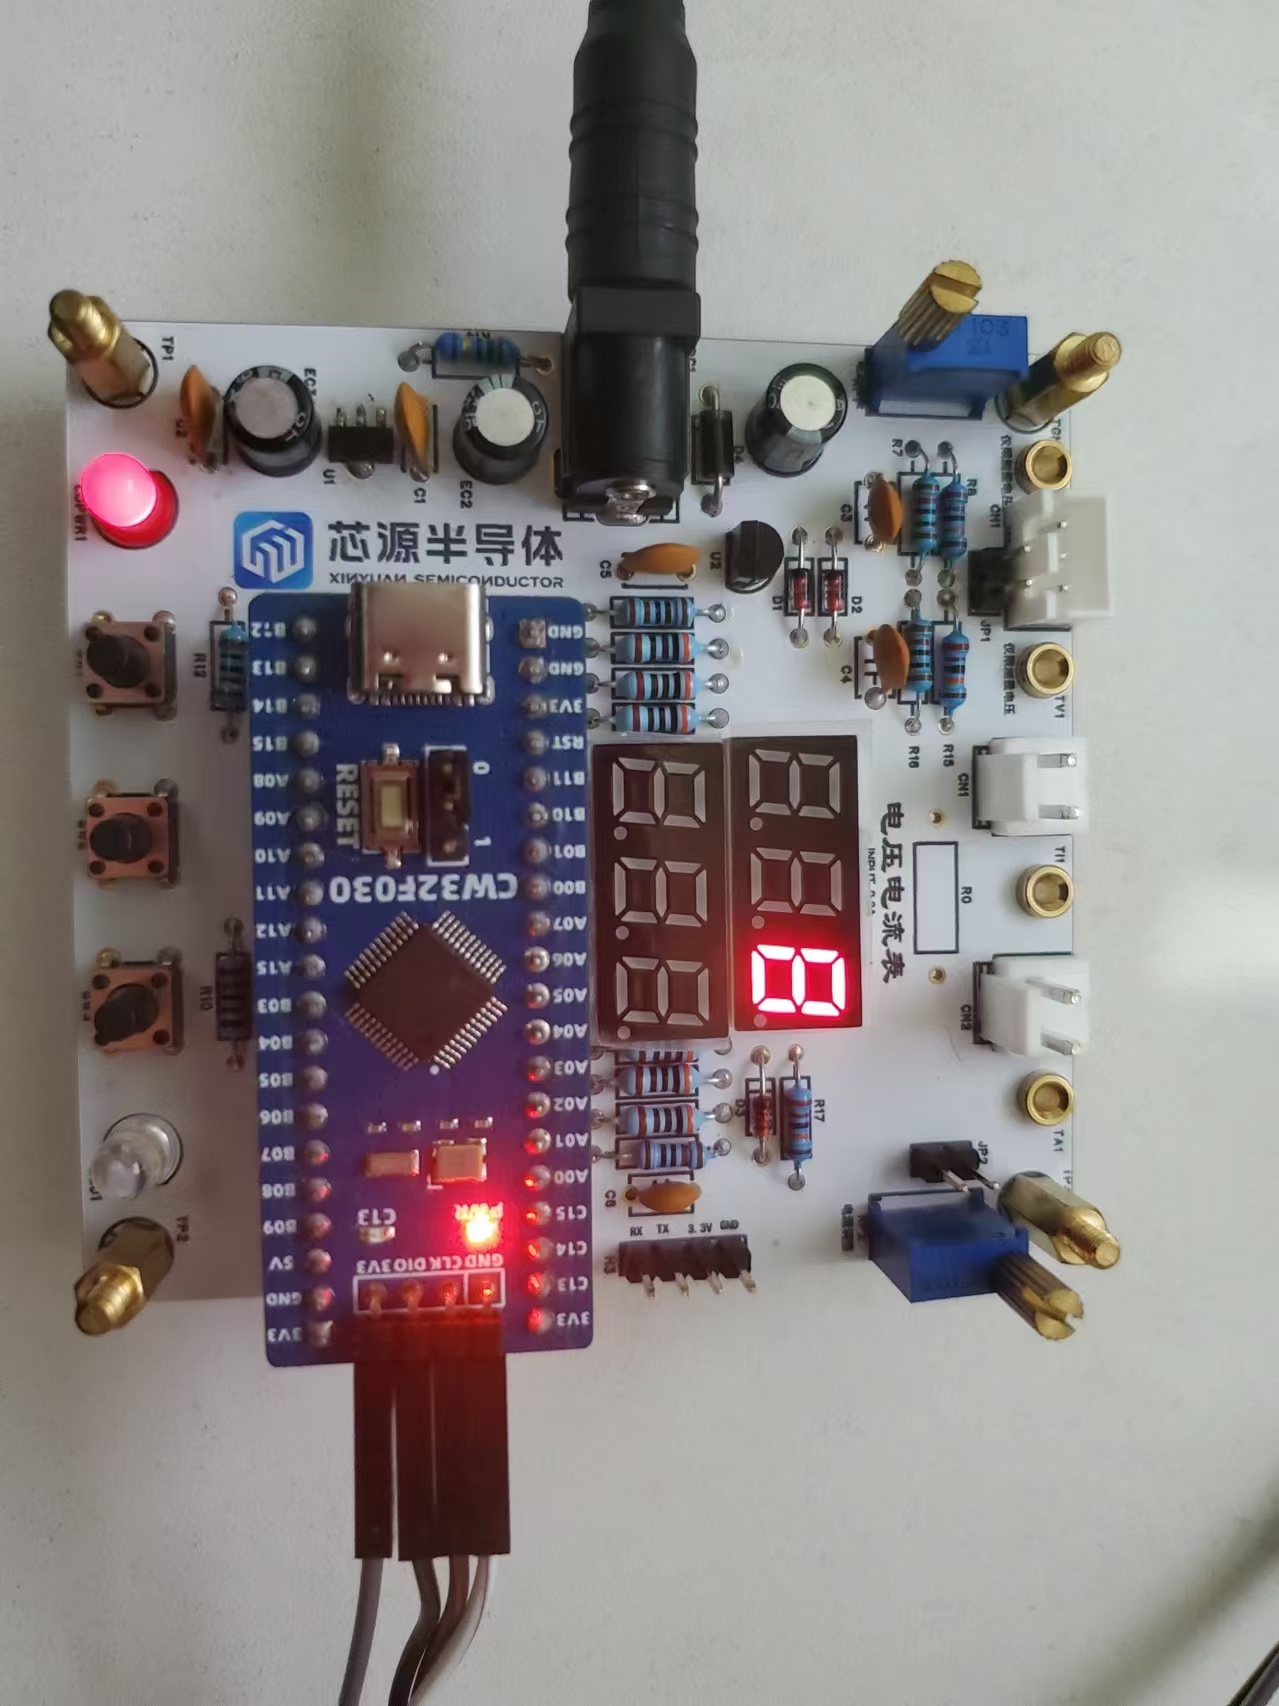
7. Experiment Seven: Current Channel Acquisition Voltage Display of a Six-Digit Display
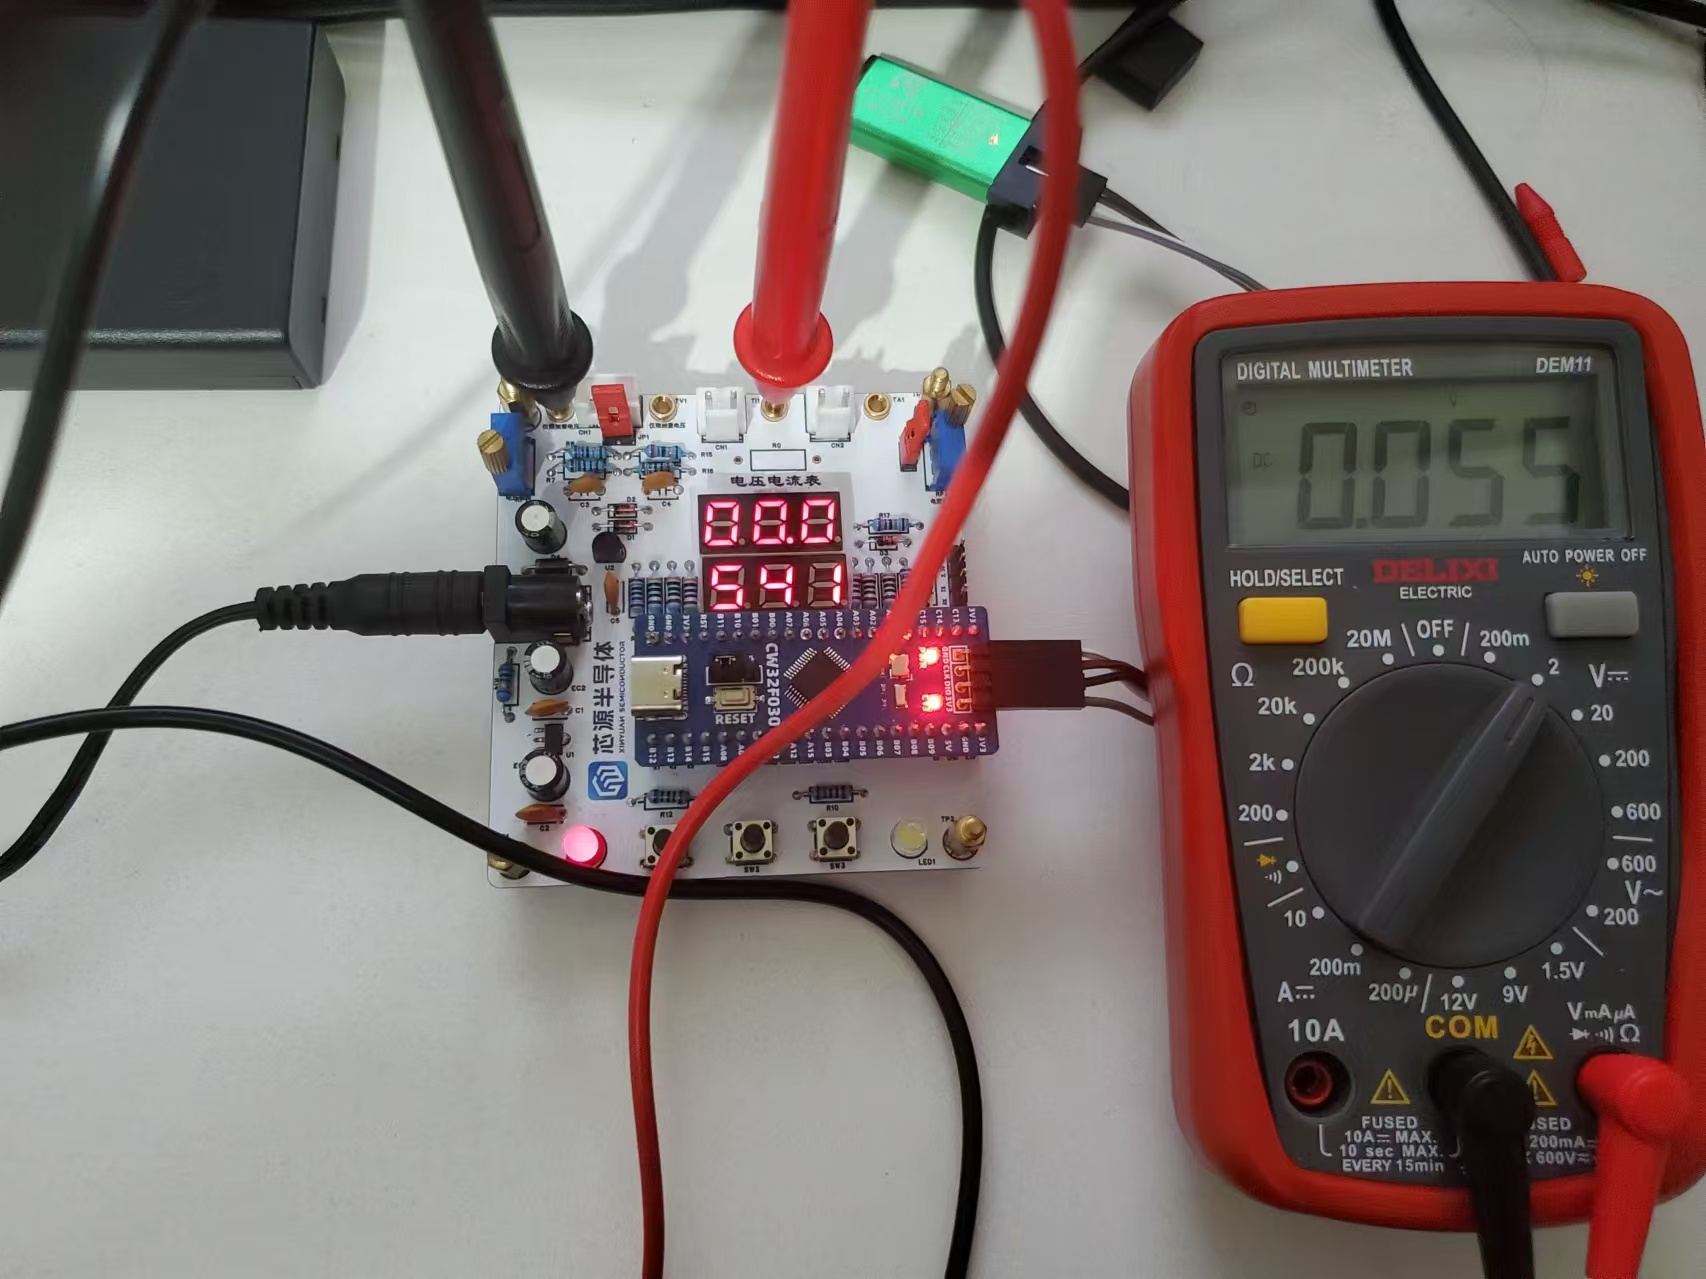
The purpose of this experiment
is simply to display the voltage using two digital tubes. This voltage is acquired through the current channel.
When we need to test the MCU AD sampling accuracy, we often input a specific adjustable voltage from the MCU AD pin, and then programmatically collect and calculate the pin voltage, comparing it with the actual voltage to observe the performance of the ADC conversion. In the development board, we can use the current channel to acquire and display the voltage to judge the AD conversion performance.
Current sampling is completed through the ADC_IN12 channel.
We can use the PR2 potentiometer to adjust the voltage value of the analog I+ input. The actual voltage value can be obtained by testing the voltage between the TI+ and GND terminals using a multimeter. The digital display shows the voltage value measured and calculated by the MCU. Comparing the actual value with the measured value allows for analysis to determine if the configuration or performance of the AD conversion process needs improvement.
Note: In this experiment, R0 is not soldered. JP2 jumper is shorted.
The voltage provided by RP2 is within the range of 0~0.238V (5V÷210K*10K) (ideal value; the actual value may be determined by the resistor accuracy), and is connected to the chip's current sampling pin via the I+ network.
The project code file is as follows:
Link: https://pan.baidu.com/s/1uKXCaQhElJfKU3FJsjP23Q?pwd=LCKF Extraction code: LCKF
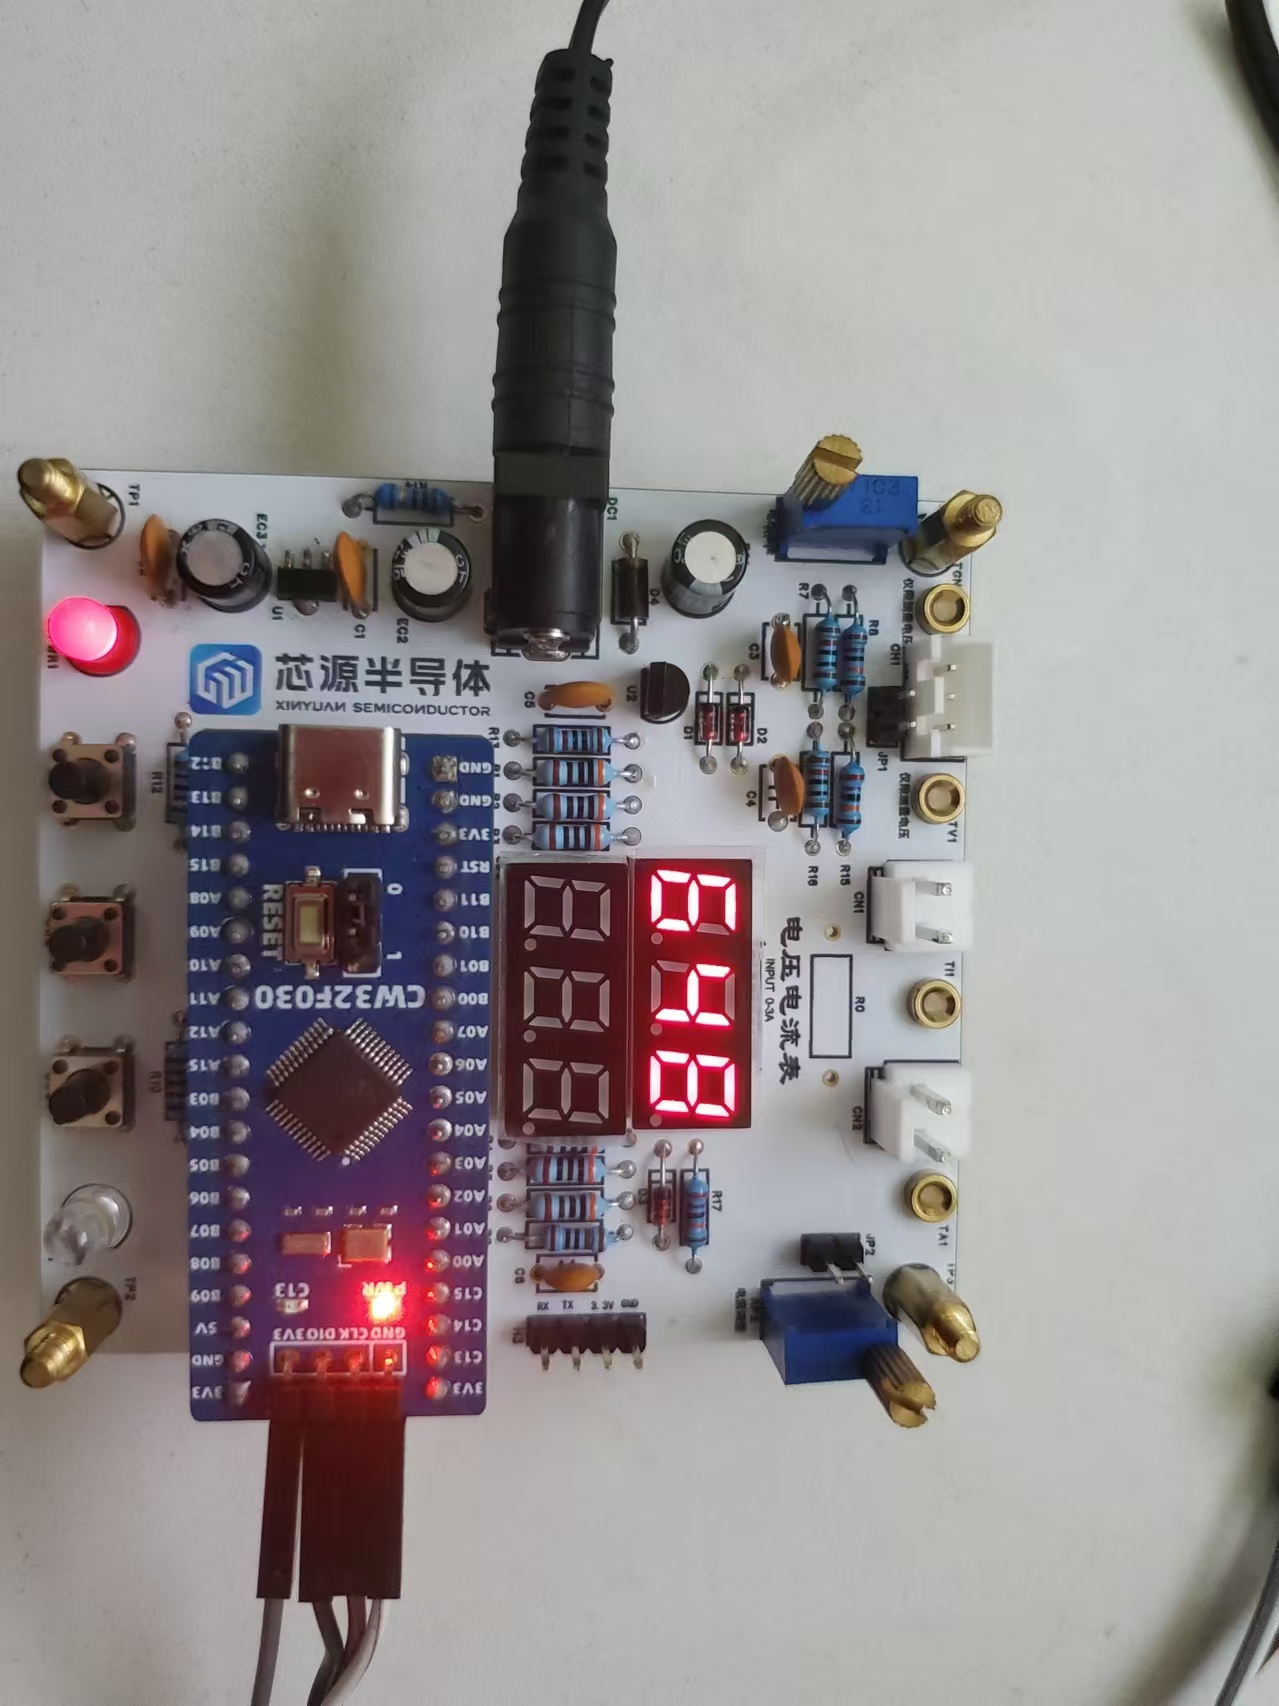
8. Experiment Eight: Simultaneous Voltage and Current Measurement and Display
The project code file is as follows:
Link: https://pan.baidu.com/s/1ExWP4fKwc6O8zjcyVymRVA?pwd=LCKF Extraction code: LCKF
Since there is no load to measure, only simulated voltage and current can be tested.
The experimental effect diagram
shows that the voltage at the measured terminal is 4.72V and the current is 0.54A.

9. Experiment Nine: Digital Voltage and Current Meter with Calibration Function
1. Concept of Calibration
Calibration is the operation of compensating for instrument system errors by measuring the deviation of a standard, thereby improving the accuracy and precision of the instrument or system. To improve the measurement accuracy and precision of the voltage and current meter, calibration is required.
The common calibration principle is as follows:
Assume a sampling system where the AD section can obtain digital quantities, corresponding to the physical quantity voltage (or current);
1. If an AD value point Xmin is calibrated at the "zero point" and an AD value point Xmax is calibrated at the "maximum point", according to the principle that "two points form a straight line", a straight line connecting the zero point and the maximum point can be obtained. The slope k of this line is easy to find. Then, by applying the equation of the straight line to solve for each point X (AD sample value), the physical quantity (voltage value) corresponding to that AD value can be obtained:
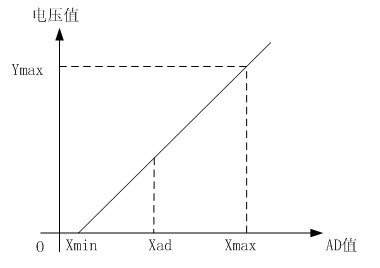
The slope k in the figure above:
k = (Ymax-Ymin)/(Xmax-Xmin)
(Because the first point is the "zero point", Ymin = 0 above)
2. The above algorithm only calibrates between the "zero point" and the "maximum point". Using intermediate AD sampling values will introduce significant errors in the corresponding physical quantities. The solution is to insert more calibration points.
As shown in the figure below, four calibration points (x1, y1), (x2, y2), (x3, y3), and (x4, y4) are inserted respectively.

This will result in a "reflection line" (equivalent to segmented processing) instead of a straight line. To solve for the voltage value corresponding to the Xad value at a point between x1 and x2:
y = k × (Xad – X1) + y1.
As can be seen above, the more intermediate calibration points inserted, the higher the "accuracy" of the obtained physical value.
In voltage and current meter measurements, a "voltage and current calibration board" or "multimeter" can be used to calibrate the collected voltage and current. The more calibration points, the more accurate the measurement.
2. Important Code Explanation
Document Tutorial - Experiment Nine: Digital Voltage and Ammeter with Calibration Function (
Link: https://pan.baidu.com/s/142prhrZlC8EnbcKCTgXrOg?pwd=ag2z
Extraction code: ag2z
) The example program uses three calibration points: voltage calibration points at 0V, 5V, and 15V; and current calibration points at 0A, 0.5A, and 1.5A.
The main program code is as follows:
{
RCC_Configuration(); //System clock 64M
KEYGPIO_Init();
GPIO_WritePin(CW_GPIOC,GPIO_PIN_13,GPIO_Pin_RESET);
Seg_Init();
Btim1_Init();
ADC_init();
read_vol_cur_calibration();
ComputeK();
while(1)
{
if(BrushFlag==1)
{
DisplayBuff();
BrushFlag=0;
}
if(timecount>= 300) //Change the digital tube display value once every 300ms//
{
timecount=0;
Volt_Cal();
BrushFlag=1;
}
}
}
The calibration code calculates the slope function as follows:
{
K=(Y15-Y05);
K=K/(X15-X05);
KI=(IY15-IY05);
KI=KI/(IX15-IX05); The
calibration
storage function is as follows:
{
uint16_t da[5];
da[0]=0xaa;
da[1]=X05;
da[2]=X15;
da[3]=IX05;
da[4]=IX15;
flash_erase();
flash_write(0,da,5);
}
The key detection and response are handled in timer BTIM1, and the code is as follows:
{
static uint32_t keytime=0,keytime2=0,keytime3=0,ledcount=0;
/* USER CODE BEGIN */
if (BTIM_GetITStatus(CW_BTIM1, BTIM_IT_OV))
{
BTIM_ClearITPendingBit(CW_BTIM1, BTIM_IT_OV);
Get_ADC_Value();
ledcount++; //LED flash
if(ledcount>=1000)
{PC13_TOG();ledcount=0;}
timecount++;
Dis_Refresh(); // Digital tube scanning display
if(GPIO_ReadPin(CW_GPIOB,GPIO_PIN_12)==GPIO_Pin_RESET)
{
keytime++;
if(keytime>=100 )
{
keytime=0; // Switch mode
Mode++;
if(Mode>=5)Mode=0;
BrushFlag=1; // Update digital tube
}
}
else keytime=0;
if(GPIO_ReadPin(CW_GPIOB,GPIO_PIN_13)==GPIO_Pin_RESET&&Mode!=0)
{
keytime2++;
if(keytime2>=100 )
{
keytime2=0; // Switch mode
if ( Mode == 1 )
{ save_calibration();ComputeK();Volt_Cal();BrushFlag=1;Mode=0; } if(Mode==3) { IX05=Mean_Value_Filter(Curr_Buffer,ADC_SAMPLE_SIZE); save_calibration();ComputeK();Volt_Cal();BrushFlag=1;Mode=0; } if(Mode==4) { IX15=Mean_Value_Filter(Curr_Buffer,ADC_SAMPLE_SIZE); save_calibration();ComputeK();Volt_Cal();BrushFlag=1;Mode=0; } } } else keytime2=0; if(GPIO_ReadPin(CW_GPIOB,GPIO_PIN_13)==GPIO_Pin_RESET) { keytime3++; if(keytime3>=100 ) { keytime3=0; //Switch mode Mode=0; BrushFlag=1; //Update digital tube } } else keytime3=0; } } 3. Calibration Operation Method of This Experiment This example uses key operation for calibration. The specific operation method is as follows: Define 5 working modes. The K1 key is used to switch the display mode. The K2 key sets the parameter value of the corresponding mode and saves it to FLASH. The K3 key returns to mode 0. Mode 0: Displays normal voltage and current values (the upper row of digital tubes displays the voltage value in .V or .V automatically, the lower row displays the current value in _.**A). Mode 1: 5V voltage calibration setting. The upper row of digital tubes displays 5.05. The lower row displays the current voltage value in _.V or ._V. In this mode, the multimeter should be set to 5.00V when measuring the measured position. Pressing the K2 key will calibrate the current value to 5V. Mode 2: 15V voltage calibration setting. The upper row of digital tubes displays 5.15. The lower row displays the current voltage value in _.V or ._V. In this mode, the multimeter should be set to 15.0V when measuring the measured position. Pressing the K2 key will calibrate the current value to 15V. Mode 3: 0.5A current calibration setting. The upper row of digital tubes displays A.0.5. The lower row displays the current current value in _.**A. Pressing the K2 key sets the current value to 0.5A. Mode 4: Current calibration value setting of 1.5A. The upper row of the digital display shows A.1.5. The lower row displays the current value *.**A. Pressing the K2 key sets the current value to 1.5A. Function demonstration video.


 京公网安备 11010802033920号

 SF31G
SF31G