Problem

Analysis and Requirements
: • Inductance/Resistance Measurement
• Inductance: Use an LM393 voltage comparator to form an LC oscillation circuit. Measure the oscillation frequency with and without the inductor being measured. Calculate the inductance value using the LC oscillation circuit frequency formula.
• Resistance: Use a 1kΩ resistor in series to form a voltage divider circuit. Calculate the resistance value using the voltage ratio.
• Resistance/Inductance Identification Principle
• Use a double-pole double-throw switch. When not pressed, the measurement path is short-circuited to measure the inherent oscillation frequency of the LM393. When pressed, the measurement path is connected, and a "pressed" signal is output to the microcontroller.
• Initially, the measurement is performed as an inductor. If the LC oscillation circuit does not oscillate, it is an open circuit.
• If the calculated inductance value is 0, switch to resistance mode measurement via a relay (disconnect the LM393 path and connect the 1kΩ resistor).
• If the calculated resistance value is 0, it is a short circuit, but it may still be an inductance measurement. Therefore, after a short circuit alarm, switch back to inductance mode.
• Frequency Measurement
• An LM393 voltage comparator and a Zener diode are used to convert the signal under test into a 3.3V PWM signal, which is
then measured by a microcontroller. • The microcontroller uses an external interrupt, and the frequency can be calculated by measuring the time difference between two rising edges of the interrupt. However, at high frequencies (approximately above 3000Hz), the time of entering and leaving interrupt mode can cause significant errors. Considering the range of the frequency under test, the frequency is calculated by counting the number of interrupts per second, which provides higher accuracy.
• Peak-to-Peak Measurement
• A half-wave precision rectifier circuit is used to convert the signal under test into DC power. The difference between the maximum and minimum values of the signal under test is then measured using the microcontroller's ADC to calculate the peak-to-peak value. (Direct half-wave rectification, diode voltage drop will cause measurement error)
• Waveform recognition
• With the help of a precision rectifier circuit, a large number of samples are taken to calculate the effective value of the signal under test. The ratio of peak value to effective value is used to determine the waveform. Hardware circuit
composition:
Raspberry Pi pico connected to PCB board. Wiring details are shown in the code. Note that the Raspberry Pi VUSB is connected to the PCB 5V. The Raspberry Pi is powered by USB, or it can be powered separately.
Program flowchart .

Physical display:
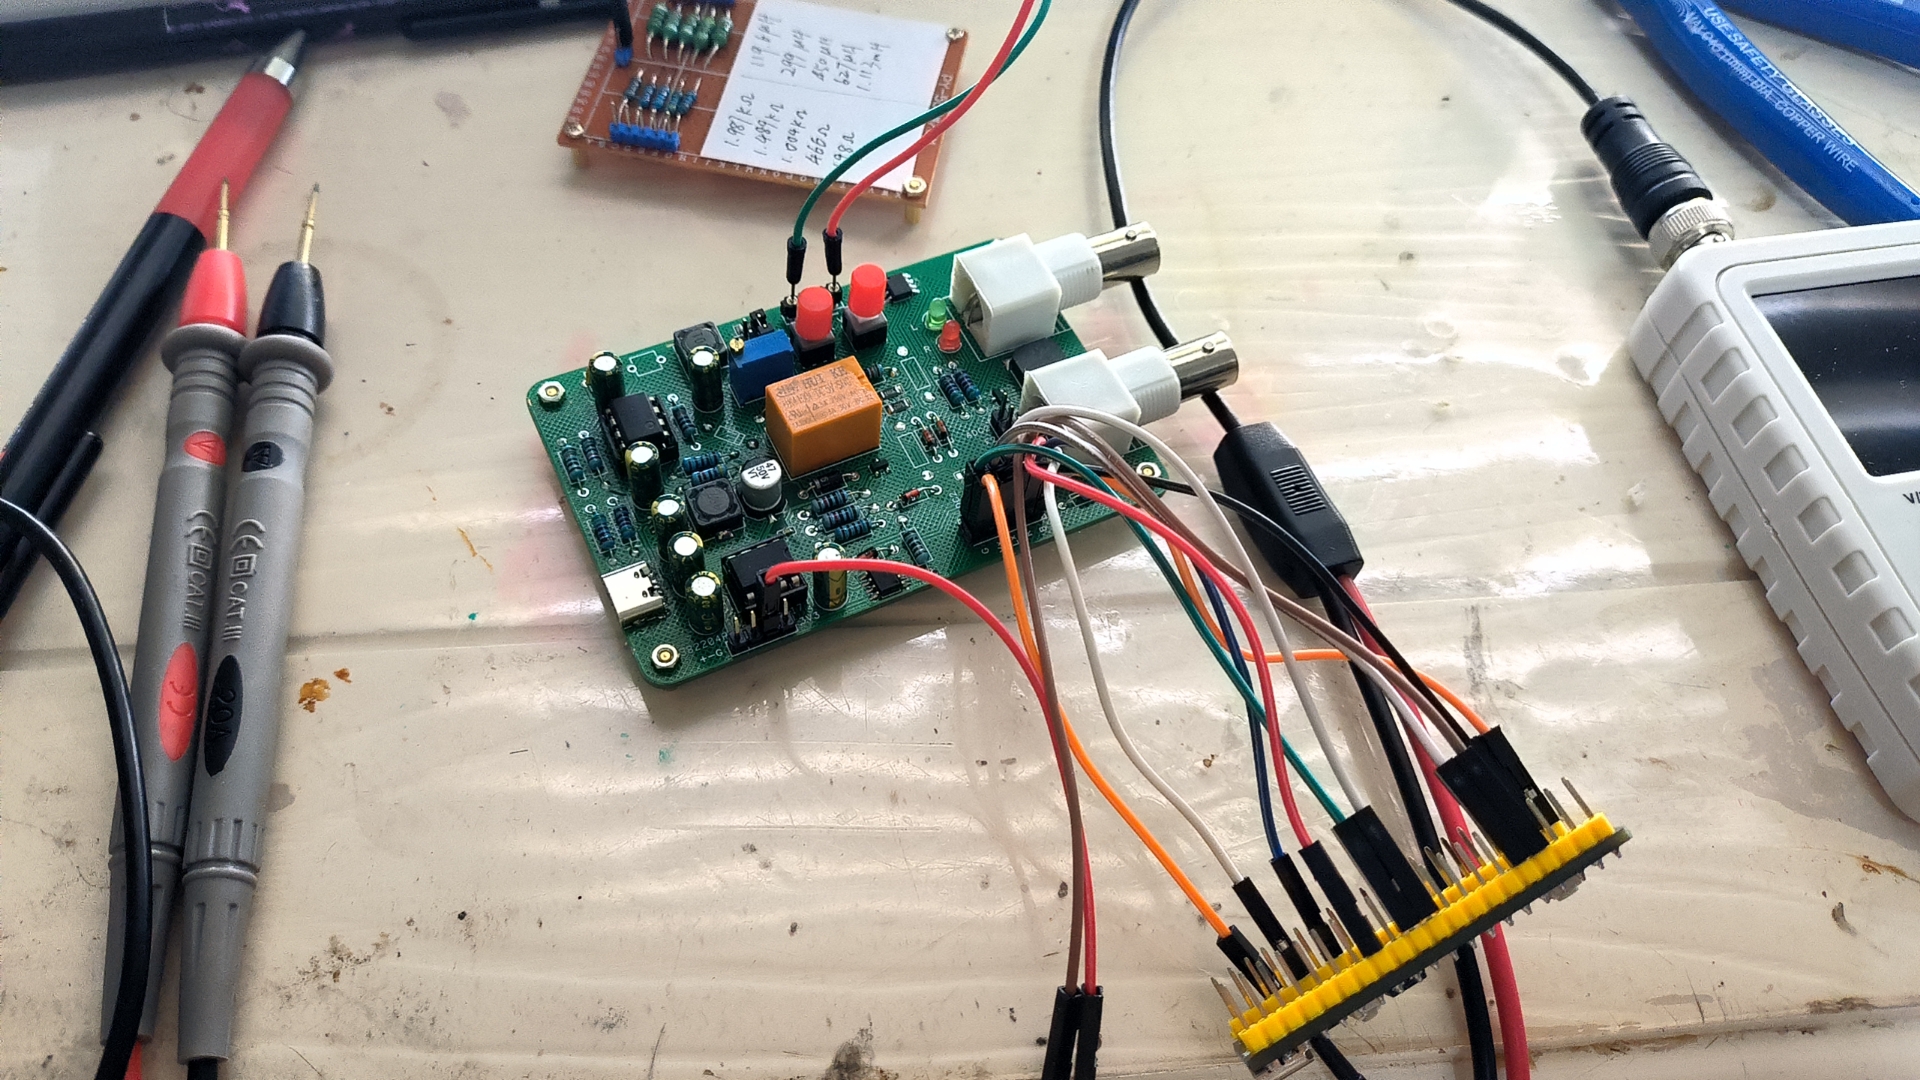
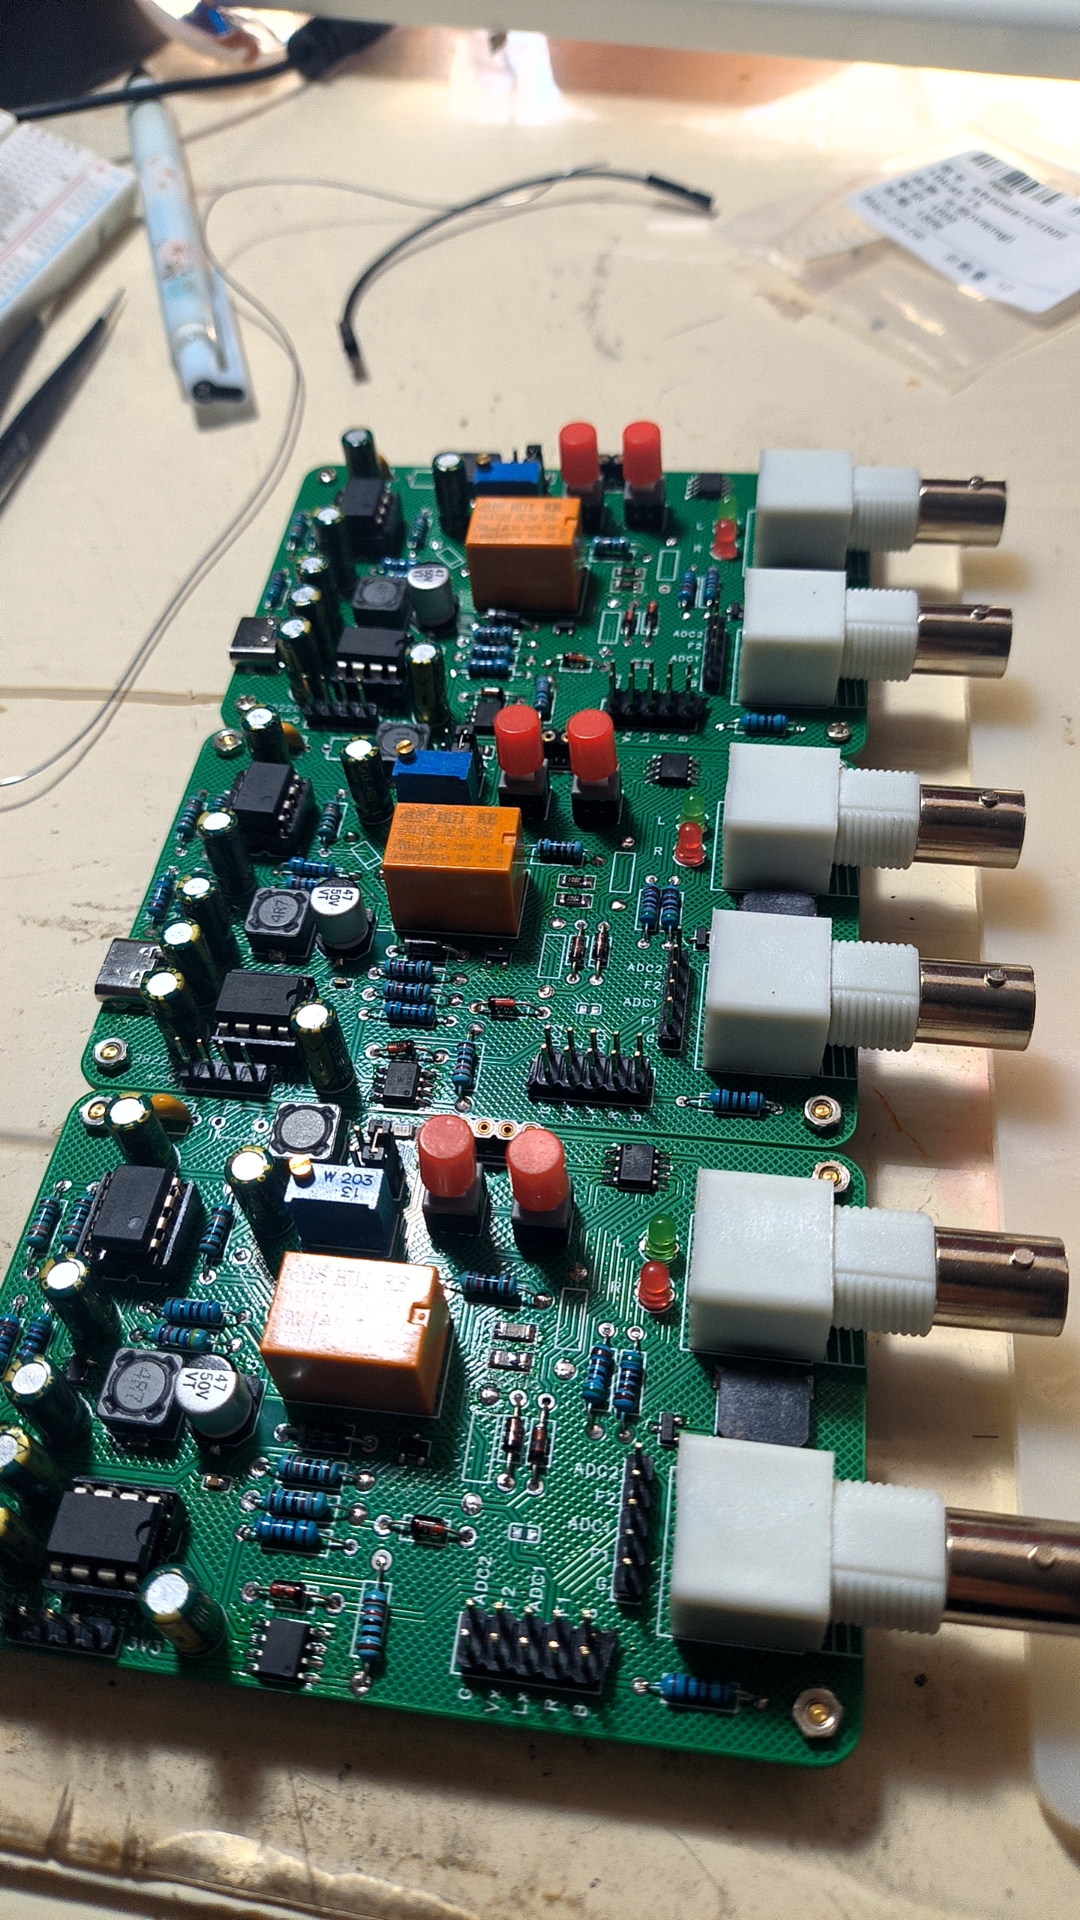
Demo board used for testing.
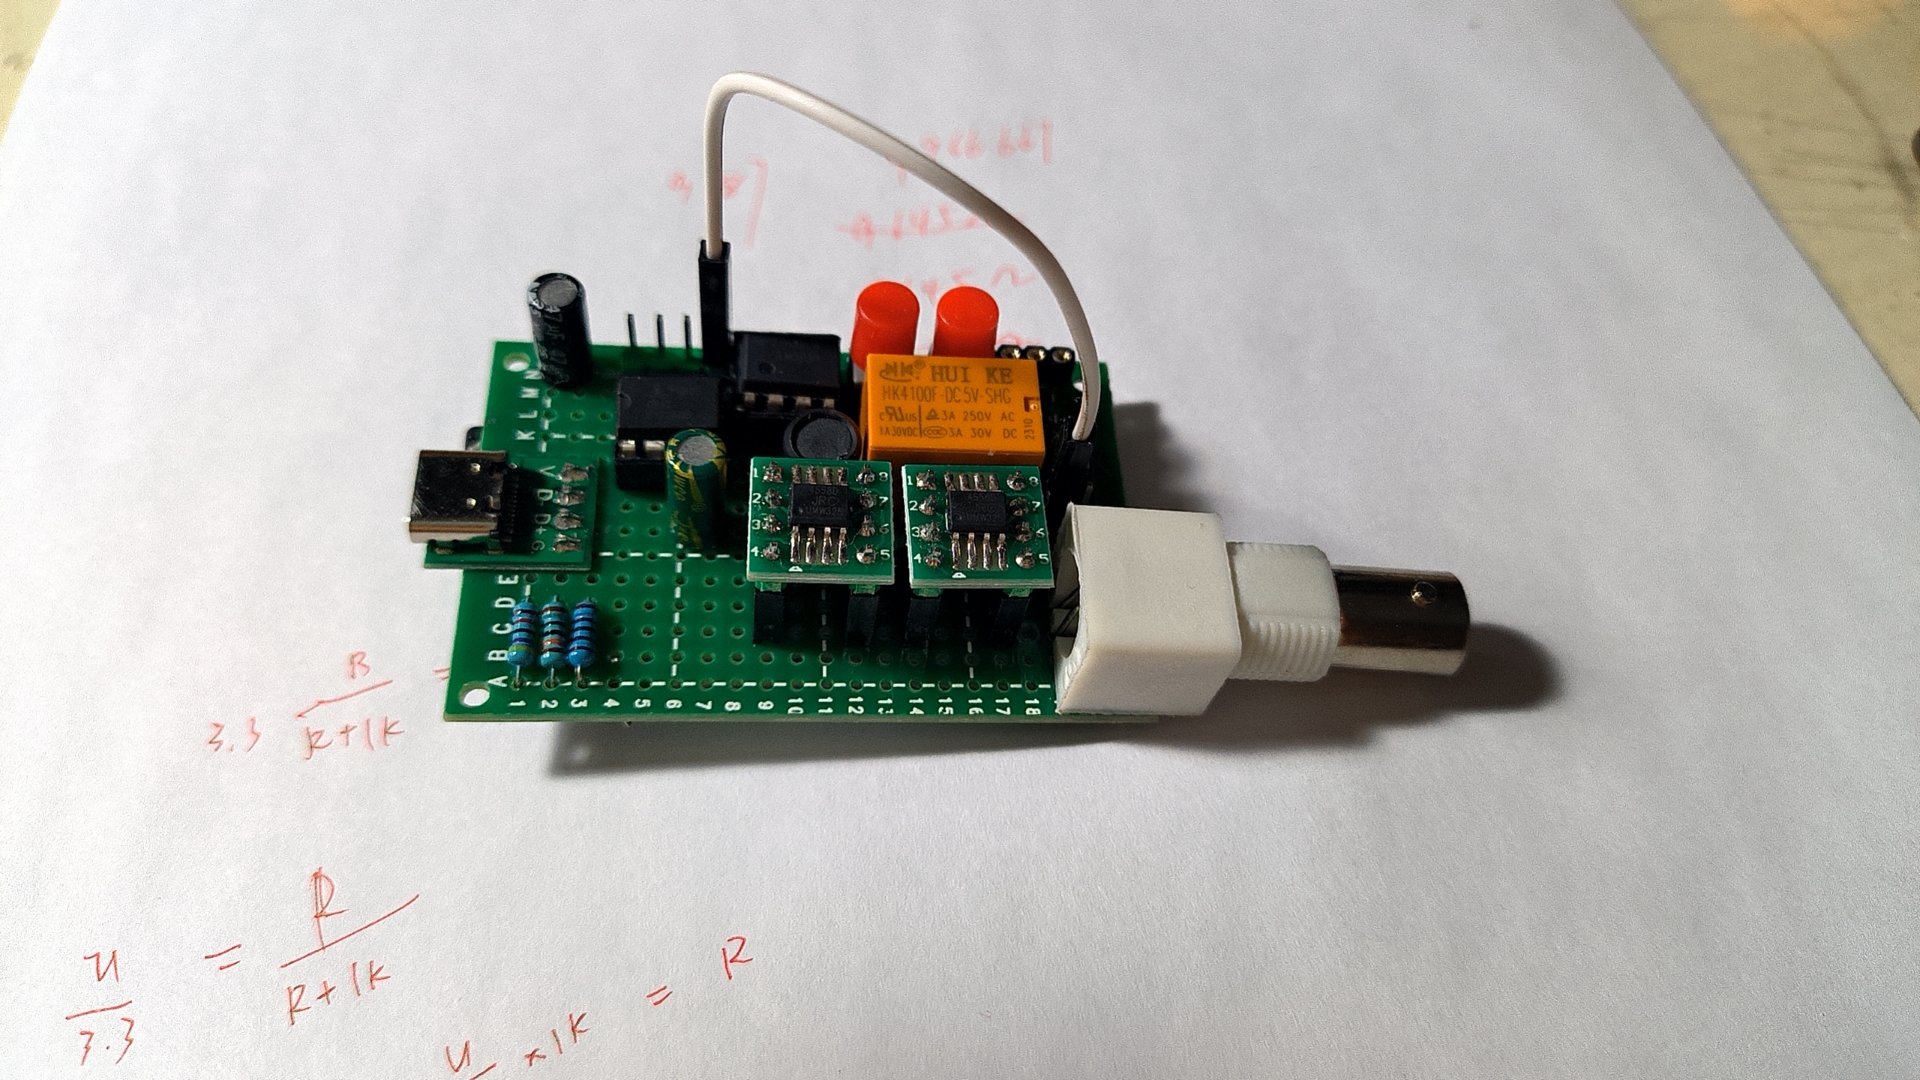
Demo board reverse side.

Note:
The effective value of the AC voltage of sine and triangular waves is the waveform. The measurement error is large (100mV+) at higher frequencies (10kHz+).
Physical picture: The PCB silkscreen is incorrect. The bottom of the vertical pin header is the AC voltage input instead of G (ND). It has been corrected in the file.


 京公网安备 11010802033920号

 FSX017X